This week we revisit the topic of Russia and the escalation in sanctions by the West. In particular we want to talk about the oft heard about but little known SWIFT system through which some of these sanctions are being imposed, the implications for broader markets and finally asset allocation within this context.
Latest developments since our last article
In the newsletter two weeks ago, we spoke about the historical and geopolitical context in which this latest conflict has taken place. Our base case was a de-escalation of the situation with some agreement being reached, concessions made and both sides being in a position to spin that they emerged “victorious”. Since then, events have evolved perhaps in a way we did not expect. Why?
For one, we did not expect the extent of the coordinated response from both the EU and the United States. The strong resistance that the Ukranian people continue to put up and the support that they have received globally. This does not necessarily translate into a direct confrontation between NATO and Russia but if Putin’s intentions were to counter NATO and create a proxy state which ensures that the EU does not encroach on his border, it may have backfired spectacularly. Not only has this incursion fostered increased support for the alliance but has elicited responses unprecedented in the modern context, including the German government committing itself to spending more than 2% of the nations GDP on defense (something the Americans have been trying to get them to do for close to three decades mind you). Immense public support in many ways forcing governments to take a harder stance than perhaps expected. Remember, sanctions aren’t anything new but think for a moment how oligarchs such as Abramovich have been able to do things like buy Chelsea FC and park their assets around the world (they have effectively been slaps on the wrist in the past).
Our view was that this would end up being more of the same. Something which Putin may have also expected given the reaction to the invasion of Georgia and annexation of Crimea. Domestically, the miscalculation has also seen protests in Russia itself, to the protesters’ own risk, and thousands of arrests. What we expect now may unfortunately have already been seen during the Second Chechen War with severe costs in terms of human life. Putin, the Russian Bear, is effectively backed into a corner and many of the soldiers deployed to the Ukrainian border still remain there, indiscriminate shelling and a blitzkrieg may follow.
Without trying to decipher why Putin has actually embarked on this undertaking, let’s get to what some of these sanctions mean and their broader impact. Before proceeding further, we must understand how global trade and financial systems work.
How is global trade currently facilitated?
To understand this, let us posit a simple question: if you are a business exporting from Australia to say Sweden, how do you get paid? The buying party can only pay you in Swedish krona after all, a currency you cannot spend in Australia. For thousands of years, this problem was solved through the use of base metals such as gold or silver (i.e. shiny thing has value everywhere). As you can imagine, this becomes a rather inefficient mechanism as trade increases; it would mean transporting physical bullion around the world. This creates the necessity for a reserve currency, one that can be trusted and depended on. Less relevant in during the peak years of imperialism as the European empires had their home currencies, the British pound filled this void in the wake of WWI with USD taking the reins post-WWII.
Why shiny things?
Studies suggest that human attraction to shiny things, and thus the value we have ascribed to them over the centuries, is rooted in evolution. Simply put, shiny surfaces are associated with fresh water; we need water to survive and so we are drawn to shiny things. After all, how many practical applications for gold were there prior to the technological revolutions that began with electricity.
In the instance of an Australian business exporting to Sweden, you would have the below transaction: Krona > USD > AUD with the reserve acting as somewhat of a replacement for having to transfer physical bullion. USD did not become the reserve currency by accident and due to its status as currency of a superpower but did so by agreement. Following the end of WWII this was the format setttled on in an agreement called Bretton Woods, somewhat infamous now. While the architect, Keynes, envisioned a global currency (namely Bancor), the US, as the only surviving Western power and given current account surpluses, put its name forward. The system after this would still be similar to how trade has been conducted for centuries in many ways. Namely that, like most paper currencies to this point, there would be an implicit trust that USD would be convertible against bullion (hence the Fed having to hoard the shiny metal in facilities like Fort Knox). Following the advent of the Vietnam War (and the tremendous amount of debt that was required) along with French President Charles de Gaulle calling out “America’s exorbitant privilege” and exchanging his county’s USD reserves for gold at the official rate in 1965, President Nixon suspended USD convertibility against gold in 1971.
What remained however was the centrality of the USD to global trade after nearly two decades of usage by the financial system, it was just no longer pegged to gold. It required nations to effectively put a bid for treasuries and created perhaps one of the biggest markets in the world, one whose size isn’t exactly known: the Eurodollar market, referring to time-deposits outside of USD and thus outside of the control of the Federal Reserve. This also presented a quirk, legally speaking these dollars remain under the jurisdiction of USA (as the issuer). It also allows the US government and state department to enforce restrictions globally. This is how ironically, the Fed nominally became Earth’s central bank.This presents another question; how do banks actually go about facilitating trade globally? Does this mean nations in essence have to keep US dollars and treasuries as means? The answer to the latter is simple, yes. The answer to the former is a little more complicated but we will try to simplify it. With the advent of modern communications, this simply required banks to use what was effectively IOUs to each other and double entry accounting to cross out incoming and outgoing transactions. The regulator here is the Bank of International Settlements (BIS); you may have come across the term Basel requirements (this is the institution under whose auspices they were bought about).
For much of the 20th century, until the 1973, these IOUs were made through traditional means given the technology at the time, including telex (a public system of manual entry). Prior to SWIFT, each transaction would require a clerk for a couple of hours on either side of a transaction. As global trade exploded and the volume of transactions increased, it created necessity for an alternative, one that allows for 1) common standards; 2) efficiency in terms of transactions; and 3) decreased counterparty risk. The answer was The Society for Worldwide Interbank Financial Telecommunication, or S.W.I.F.T. SC, domiciled in Belgium and owned by member banks.
SWIFT is a critical part of the communication infrastructure that facilitates international money flows but doesn’t actually transfer or hold any funds. Think of SWIFT as like a simple email or messaging system enabling secure messages across member banks. This network sees an average of about 40 million messages a day, providing banks with a reliable and safe method of communication to deal with trades, payment confirmations, FX exchanges and orders.
SWIFT & Relevance
Theoretically, SWIFT is an apolitical organisation not beholden to any one nation or state. It was after September 11 that American intelligence agencies started trying to track SWIFT transactions in the name of the Terrorist Financing Tracking Program. Remember, messages in this context are as good as direct money transfers. Unfortunately, one of the problems with SWIFT’s greater technological efficiency is that it makes government overreach far easier. This was somewhat scandalous when it came out in 2006 as it raised the issue of privacy laws being violated and data being provided to US government agencies by an organisation that was deliberately supposed to be apolitical.
Despite the above scandal and the reputational damage to the organisation itself, the EU signed an interim agreement (almost certainly under pressure from both US State and Treasury) to allow data exchange. This was done on 30 November 2009, a day before the Lisbon Treaty, which would have almost certainly made it illegal, came into effect mind you. The proviso here was that there would be oversight provided by the EU’s regulatory agencies. The agreement was rejected by the European Parliament in February 2010. Despite this, the power imbalance favouring the US was made clear in 2012 when the US decided on sanctions against Iranian banks. When SWIFT refused due to the arguable legality of such a move, the Senate Banking and Finance Committee decided to impose sanctions of SWIFT to pressure them into removing the blacklisted Iranian banks from the system. Over the years the EU also decided to overlook these issues and the situation became such that SWIFT effectively enabled the US government and the EU to use it as a geopolitical tool to impose mutually agreed upon sanctions.
Again, returning to how the financial system works, the modern system effectively relies on IOUs or communication systems. While it is true that SWIFT is (at its simplest) a messaging/communication mechanism, cutting off an institution can have a drastic impact on their ability to do business globally. About half of all large cross-border transactions use the SWIFT network.
Think of it this way. Imagine going to the supermarket, trying to pay and being told by the cashier that you aren’t allowed to use the EFTPOS terminal to tell your bank to send money from your account to theirs. It’s not that you don’t have the money for the transaction or that the other side is necessarily unwilling to do business with you, it’s that you are being frozen out of the system that communicates that the transfer needs to happen. (This is in no way a perfect analogy as EFTPOS systems actually facilitate the transfer not just the communication).
Moreover, if provided access, the ability of the EU and the US to effectively trace where money is going also enables them to track individuals and place punitive measures on them in some cases, such as say an oligarch.
So, what’s happening regarding Russia?
This has arguably been the biggest achievement to date of the Biden administration, not only placing the sanctions but doing so in a multilateral manner and with the cooperation of the US’ allies. The sanctions are wide ranging and, although the Russian government has been rather effective in building what has often been termed a fortress economy (in building food independence), we are likely to see things change rather drastically. Let’s sum up what the sanctions have included so far:
Cutting the Russian financial system from the SWIFT network along with debt and equity restrictions on institutions holding nearly 80% of Russian banking sector assets;
Curtailing and restricting the Central Bank of the Russian Federation’s (or Bank of Russia) ability to use its reserves, including US Treasuries and Euros (the Bank of Russia has close to US $850bn in reserves);
Asset freezes of the country’s foreign assets;
Perhaps most interestingly it has also been targeted at freezing assets for individuals with close ties to the Kremlin, a who’s who selection of those ever present Russian oligarchs.
The last point may not seem important for us as investors but may have the biggest impact to the regime itself. To sum up rather simply, Russia is not a traditionally functioning system even by the standards of autocracies. There is only a thin line between the state and business with factions fighting for the rights to control the latter. A substantial amount of the President’s power lies in acting as a broker to these varied interests who are, in effect, kept in check while at the same time providing the Kremlin with much needed capital and resources. Cutting that off will certainly hurt the power structures. Any consensus forming within the various factions who stand to lose more than substantially and Putin may very well see cracks appearing in his power. The modern day oligarchs are effectively a replacement of the Politburo of days bygone. Stalin was infamous for his ability to pit groups/factions against one another as a means of keeping opposition in check and retaining power.
With that, let us come to our last point which is how this may impact asset allocation going forward and what about this matters for the investor.
Asset allocation & what matters for the investor?
Let’s begin with the obvious, the effect on CPI data. While it is true that energy was specifically left out of the sanction equation given the reliance of the EU on Russian sources, it will nevertheless exacerbate pre-existing supply bottlenecks and put immediate upward pressure on spot prices for Brent. Conversely, some of it maybe curtailed by OPEC increasing its own production to meet increased demand. We find it hard to believe that the Saudi’s would not take advantage of the situation by going above quota but not so much as to impact on spot prices too much.
Russia’s exclusion from the SWIFT network ironically means that Putin may have increased Russia’s reliance on China and her alternative (but less efficient) CIPS. This is effectively very much a RMB trade story. Perversely however, we also think there maybe a marked incentive for the Chinese to buy from Russia (given her lack of alternatives) at a discount to spot markets. Given China’s growth issues, this may in fact be a reprieve for global growth numbers.
We will also likely see continued reshoring of supply chains and more targeted investments by governments to shore up critical infrastructure, including developing offshore LNG production and ramping up investment in green alternatives within the EU. With the US also likely to hand out some incentives for domestic mining.
Coming to the question of how to allocate within the above context, we see an increasing likelihood of central banks using Ukraine uncertainty to avoid having to raise rates. This is something which the RBA pointed to this week in its rationalisation of keeping the headline cash rate at 0.1%. Keeping that and negative real yields for an elongated period of time in mind, we see significant catalysts for the commodities market as well as energy and defence sectors. Aside from the traditional flight to safety, precious metals should also see increased demand given it will be the Bank of Russia’s only alternative in terms of reserves and China’s reluctance to get rid of her capital controls.
On the point of allocation, many may have seen the price action in crypto, including bitcoin (+16% since Monday). We have little doubt that this is/was a Russian play to circumvent sanctions (we wont assume what the make up is of government, oligarchs and everyday people) or at least people pre-empting such a play. However, this may have forced a landmark moment for cryptocurrency, creating perhaps the biggest risk we’ve seen in recent times for its future. This creates a marked incentive for increased oversight of the space, the US Treasury already pressuring crypto exchanges to make sure they are operating in line with current sanctions. One of the bull cases for bitcoin/crypto is directly tied to all this; potentially finding a use as a decentralised global reserve or trade currency (i.e. not USD, which affords one particular country undue influence). Our view? Central banks and regulators are happy enough to use the underlying blockchain technology, even let it exist as a mode of speculation. However, the moment it becomes a commonly accepted mode of exchange that may be detrimental to policy outcomes, there will be consequences. After all, who likes ceding control?
To sum it up, the impact of the crisis on global growth will be harder to predict than the market maybe expecting, with government expenditures accommodating for any fall in consumption. In terms of inflation and CPI data, almost certainly it will exacerbate the pre-existing conditions but the question becomes what will be done about it? Judging by what we’re already seeing, not much. We’ve seen this story play out before, global public debt will fall while rates stay put as inflation eats away at overhand. Which makes it rather confronting is that investors continue to buy bonds. A sure fire way to lose money at this point.
This week we will continue looking at reporting season with a look at two companies that saw challenging trading conditions in the half as a result of Covid-19 impacts and explain why their outlook for FY22 is strong. Many companies saw tougher trading conditions but not all were able to navigate through the half without a severe impact on operations. Further, January has been impacted by omicron but, looking forward, we are starting to see a more normalised trading environment.
Probiotec Limited (PBP.ASX)
Probiotec Limited is a manufacturer, packer and distributor of a range of prescription and over-the-counter (OTC) pharmaceuticals, complementary medicines, consumer health products, and fast-moving consumer goods. The company owns six manufacturing facilities in Australia and distributes its products both domestically and internationally. Products are manufactured by Probiotec on behalf of a range of clients, including major international pharmaceutical companies.
Results
Despite a challenging half with supply chain problems, PBP were able to navigate these issues and report a good result. PBP saw their pro forma EBITDA up +24% to $14.9m with pro forma revenue up +3%. PBP’s clients are looking to shore up their supply chains as a result of the challenges overseas and are looking for onshore manufacturers, benefitting PBP in the half. Their cold and flu segment took a c.$20m hit in FY21 but they should win back $8-12m in 2H22 and there is potential upside in additional cold and flu revenue in FY23. During the half, PBP were selling additional packaging services to manufacturing clients and vice versa. While it was a small one, their acquisition of H&H Packaging has integrated well and is trading ahead of expectations.
Source: PBP company filings
Outlook
PBP has great earnings visibility and were able to provide FY22 guidance of $170-180m in revenue and EBITDA of $32-33m. PBP have been active in the M&A space and will continue to go down that path. They are sitting on a strong balance sheet and only have a net bank debt/underlying EBITDA ratio of 0.75x, leaving them plenty room to grow through M&A. As mentioned, we see further upside in the recovery of their cold and flu segment for FY23. PBP have secured all the contracts required to meet their FY22 guidance so there is a good chance we see them beat that. Currently PBP are trading at an EV/EBITDA of 6.15x. We believe this is too cheap heading into easier 2H trading conditions, we expect to see a number of acquisitions this year.
Healthia (HLA.ASX)
Healthia is an integrated allied healthcare organisation that includes networks of optometry, podiatry, and physiotherapy clinics across Australia. The physio/podiatry industry in particular is a fragmented one that has allowed Healthia to grow through an aggressive acquisition strategy, giving them a strong presence throughout Australia. HLA currently has 292 clinics across their different businesses.
Results
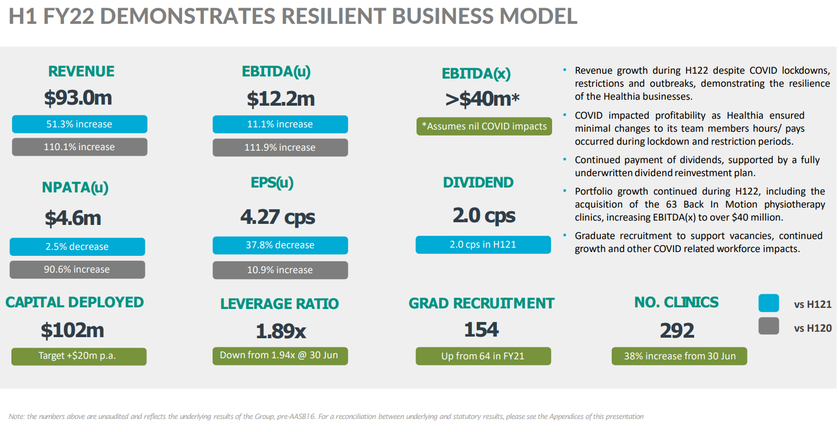
HLA had a challenging half with lockdowns in NSW and VIC; they had huge staff impacts from Covid-19 and the lockdowns heavily affected their operations. They didn’t lay any staff off which led to a higher fixed cost base. Their natural fit stores were mostly closed during Q1, hurting margins. They continued their acquisition strategy during the half, acquiring 76 physio clinics in the period (along with 3 optical stores and a podiatry clinic). Even with all the headwinds during the half, HLA saw a +51.3% increase in revenue to $93m and an +11.1% increase in EBITDA to $12.2m. Their ‘Bodies and Mind’ stores were minimally impacted and were stable during the half, recording a 19.4% EBITDA margin (still below expectations). ‘Eyes and Ears’ were the most impacted but there should be plenty of pent up demand for this segment, people still need to get their eyes tested but have just delayed their visit; unlike the physio segment which has very little pent up demand comparably.
Source: HLA company filings
Outlook
HLA had a tough half but, looking forward, they are targeting 3-6% same store growth. As long as they continue to acquire clinics at cheap prices, they are building a super profitable business that is growing rapidly through M&A. There have been some impacts felt in January and February but from here they should be hitting full steam. In November they saw a more normal trading environment, seeing +5% organic growth. The management team knows what the business can do in good operating conditions. Q4 will be a great indicator of what the business will look like moving forward and HLA has provided the market with a FY23 EBITDA target of $40m. Importantly, this number is based on their current portfolio and doesn’t account for future acquisitions. Based on their FY23 target, they are trading at a forward EV/EBITDA of 8x.
Disclaimer: PBP and HLA are both currently owned in TAMIM portfolios.
Continuing on with our reporting season notes, we will cover a few more of our key holdings across TAMIM’s Australian equity portfolios. There has been increased uncertainty across markets as geopolitical tensions in eastern Europe have come to a head alongside hawkish central bank commentary. Any company even remotely connected to the word ‘growth’ is apparently tainted and has been sold down accordingly.
Author: Ron Shamgar
Despite mostly good results across our portfolio the market is unwilling to rerate them; this is something we anticipated given the uncertainty currently at play. An opportunity for the enterprising investors perhaps.
Webcentral (WCG.ASX)
Webcentral, once Netregistry, is an Australian owned digital services company who empower more than 330,000 customers to grow and thrive in the online world. Their portfolio of digital services is extensive, with market leading offers across domain management, website development and hosting, office and productivity applications and online marketing. Webcentral currently owns and operates its own Nationwide highspeed Data Network with points of presence in all major Australian capital cities.
5GN Acquisition
WCG completed the acquisition of 5GN, a telecommunications carrier providing datacentre and cloud solutions across Australia. Webcentral and 5GN operate in complementary businesses and the merger will result in a market leading, full-service online/digital solution provider that delivers strong value and growth opportunities to shareholders. This will come with synergies. During the half, 5GN saw strong customer growth and completed $12m in contract renewals.
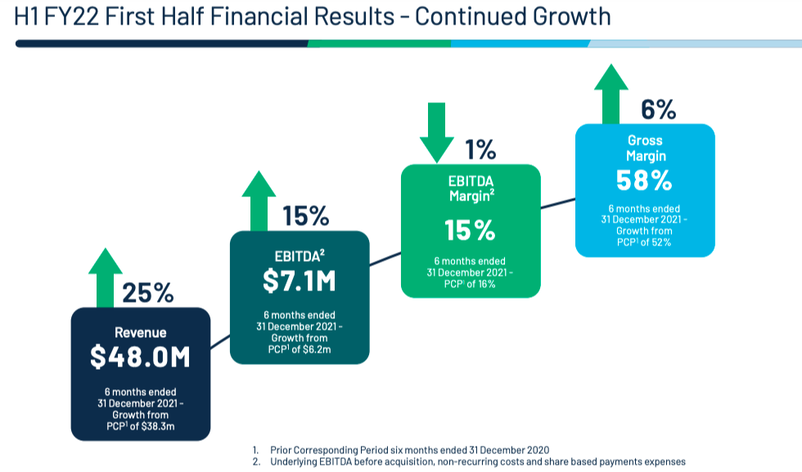
Source: WCG company filings
Results
WCG saw their revenue climb to $48m, up +25% on the previous comparable period (pcp), with EBITDA of $7.1m, up +15%, for the half. They beat guidance on EBITDA while revenue came in at the top end of the range. WCG’s gross margin improved to 58% from a combination of organic growth and direct cost synergies. The company experienced a lack of hardware and software orders due to Covid-19 which disrupted installation. They also noted that this segment is skewed towards H2. It was stated on the earnings call that hardware sales are already recovering as we edge into H2. New data centre sales are currently tracking at $100,000 per month and they have seen improved customer retention. Looking to H2, WCG will be launching their domain business on March 24. They believe that it is a significant market and internal forecasts suggest that WCG will take approximately 30% of the market. WCG is also expecting 10-20% of their 330,000 strong SME customer base to take up their initial NBN launch in June.
Outlook
We were surprised to see WCG slide down after providing this result. Despite seeing weak hardware and software sales, they are still on track to meet their long terms goals. They are forecasting that they reach $29m in EBITDA in FY23 and are very confident on achieving a 20% EBITDA margin for FY22 There are also a lot of small M&A targets being looked at and they have seen an increased volume of inbound deals from brokers. In terms of their ~18% stake in Cirrus Networks (CNW.ASX), they are waiting to see their results and take action from there. They are also forecasting a gross cash position of $55m in FY23. Right now WCG are trading on an FY23 EV/EBITDA of 3x, a level that we believe is far too cheap given their growth initiatives.
SRG Global Limited (SRG.ASX)
SRG Global is an engineering-led specialist construction, maintenance and mining services group operating across the entire asset lifecycle. SRG operates three segments, namely Constructions, Asset Services and Mining Services.
Source: SRG company filings
Results
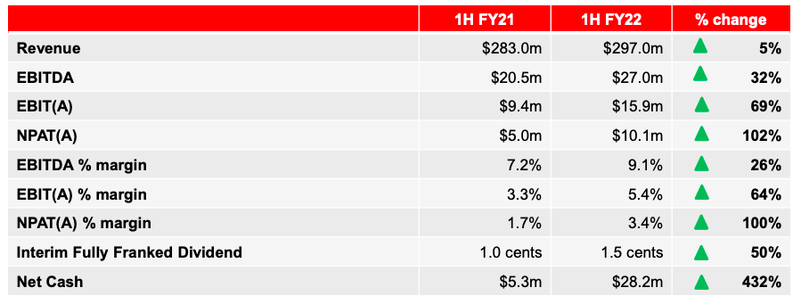
In what has been a tough operational environment for the sector due to Covid disruptions and labour shortages, SRG posted a strong result for the half year. SRG was able to weather the storm and grow revenue by +5% to $297m and EBITDA to $27m, +32%. SRG has seen a $40m swing from net debt to net cash since FY20; net cash now sitting at $28.2m. SRG’s strategic plan is to transition the business toward recurring revenues, providing better earnings visibility. Currently recurring revenue makes up 67% and they are hoping to boost this to 80%. SRG launched their Engineering Products segment which SRG are very excited about, believing it could grow to be their fourth operating arm. Alongside this, the revenue is recurring in nature. SRG have built a strong suite of clients, including the likes of Iluka (ILU.ASX), Fortescue (FMG.ASX), and Rio Tinto (RIO.ASX); 70% of these top tier clients weren’t there three years ago. SRG have also stressed the cross-selling opportunities of services as well as being able to get more work once they are on site with clients.
Outlook
SRG has a strong pipeline, Work in Hand coming in at $1bn with a broader pipeline of $6bn. Management noted that they believe the business will do significantly better in an easier operating environment; the WA border opening being a tailwind and increased access to labour on the horizon as Covid-19 restrictions ease. SRG have done well in their transition to more of a recurring revenue based strategy; we believe will earn them a higher multiple. We expect SRG to grow through a mixture of M&A and organic growth and they are well funded to do so, being in a strong net cash position. SRG upgraded guidance to $54-57m, putting them at an FY22 EV/EBITDA of around 4x and will be paying a fully franked dividend of around 6% at current prices.
Disclaimer: WCG & SRG are both currently held in TAMIM portfolios.
This week we would like to offer our thoughts on certain megathemes that are impacting investment markets. Firstly, credit where it is due, this is a topic inspired by an oped in the AFR by James Thomson who summarises what he sees the recent bid by Cannon-Brookes for AGL represents. He categorizes the bid as representing three broad megathemes: 1) Energy Transition; 2) Private Capital; and 3) The Billionaire Activist. While we broadly agree with this categorisation, we would like to give our take on them and add in a final component that we feel is missing: the politicisation of everything.
Context: On Saturday Mike Cannon-Brookes, co-founder/co-CEO of Atlassian and Australia’s third richest person, launched an $8bn bid with Canadian company Brookfield (who will pop up again later) to buy AGL (AGL.ASX). The plan would be to shut all remaining coal plants by 2030 and spend $20bn replacing them with renewable energy and batteries. AGL’s board has rejected the offer, representing a 4.7% premium to their Friday closing price, saying that the consortium would have to pay a significantly higher premium to gain control. This is to say nothing of the feasibility of the 2030 timeline; AGL’s board and Scott Morrison, amongst others, saying that it is wildly unrealistic while the other side is adamant that it is perfectly reasonable with the resources and right experience (Brookfield’s in particular) behind it.
Many of you may be aware of our thoughts in this sphere given some of our previous pieces, especially in relation to oil and nuclear energy. Mr Thomson posits that the pace is accelerating rapidly, a pace at which policy makers are increasingly caught by surprise. We, however, have a different angle which is that this may just be more intentional than previously thought. AGL had previously announced the closing down of her coal fired stations and, despite the rhetoric from the government around the implications for power prices and the noise made, we are cynical enough to think that this might be just that, rhetoric. After all, it was a Liberal government (under Turnbull at the time) that signed (granted, non-binding) the Paris Accords, committing to a target reduction in emissions of 26-28% on 2005 levels by 2030. This showcased at least a broad willingness to consider targeting net zero emissions. At the end of the day, the transition is happening. The issue is currently one of the timeline.
We find it hard to believe that there is such little financial literacy amongst policy makers to understand that this places immense risks on any new financing for traditional fossil fuels projects. It raises the question of stranded assets, front and centre. After all, what rational banker would underwrite large capex projects with decades-long payoffs if the risk is that there may not be a market at the end of that time horizon? This is why the yields on debt for coal or oil producers remains egregious. Newcastle Coal Infrastructure Group’s (NCIG) shorter-dated 2031, for example, comes through at a coupon of 12.50% p.a.; low interest rates anyone?
In fact, if it were not for the easy money policy from the Fed over the decade plus since the GFC, much of the shale boom that made the US the largest producer on the planet would not have been possible. Assuming that is about to change, the implications are tremendous for high cost producers and US production broadly. What we feel has been lagging is at best a lack of forward thinking and at worst a blatant disregard for the transition period. Economies dont transition overnight. Our base case is peak oil and upward energy costs either way, which makes the economics of renewables easier to swallow.
2) Private Capital
We have seen an increasing amount of capital flow towards the private side of the equation. And little wonder. With yields negative (and likely to stay there in real terms), institutions are forced to find bond proxies. This is why we see tremendous appetite for utilities and infrastructure from private players. For the more cynical, illiquidity is precisely what makes them so attractive. Much easier to massage the numbers and even out volatility using private markets than it is in public. We refer here to asset revaluations and, in a world of heightened volatility in equity markets, we will see this trend grow. Especially so given an aging demographic and surplus savings in the form of superannuation and pension schemes.
Sydney Airport and AusNet – a takeover offer from a consortium (including Sunsuper and three Canadian pension funds) led by the aforementioned Canadian outfit Brookfield being approved a few weeks ago – are the first of what should be many to come over the next few years. Looking globally, pension funds will have nominal targets of 7% on average in order to keep up with liabilities. With financial repression (i.e. official rates staying below CPI) very likely on the cards (closer than many may think), we see an even greater incentive for institutional players to show a preference for private markets.
Infrastructure and utilities might be worth a look.
3) The Billionaire Activist
Not since the Gilded Age have we seen income and wealth inequality reach present levels. It is precisely this confluence of factors that enables and emboldens a new class of billionaires to be increasingly active in their investments. Mr. Thomson points to Twiggy Forrest and Mike Cannon-Brookes as his examples, but think for a moment about the political front. The amount of time and money spent Stateside on fund raising for election cycles – via PACs (Political Action Committees) or otherwise – or the sheer ratio of Wall Street lobbyists to Congressmen and women; those within these financial services firms contributing US $2bn to campaigns/lobbying in the 2016 Presidential cycle, US $2.9bn for 2020 (that’s about $4m a day!). The Koch brothers of Koch Industries fame are another prime example, activism in public markets is only one aspect of this.
What we feel is oft forgotten is that, despite the pushback from the more traditional central banker, QE has potentially given this trend further impetus. Valuations of tech giants and eyewatering multiples has ended up creating and exacerbating income income inequality not seen across most of the Western world since the late 1800s. It has arguably never been more visible. The Covid-19 era fiscal and monetary policies, for example, has allowed Australian billionaires to almost double their wealth.
Why does this matter to the investor?
This new class of billionaires will continue to have a disproportionate impact (more so than historically) upon both the policy environment and the investment landscape. This newer generation of billionaires clearly has no issue using their wealth outside the political sphere to advocate and/or force change. The more cynical view is that it is less to do with climate activism and more to do with the fact that there might now be outsized returns available in the green energy industry over the short to medium term. That is to say, the green transition is happening, the global renewable energy market was already valued at $881.7bn in 2020 (Source: Allied Market Research), and we are near an inflection point in terms of both technology and large scale adoption. Is this particular bid centred on Cannon-Brookes getting in early on a lucrative investment or climate activism?
Our guess at the reality? Two birds with one stone for Mike (he does have form on the climate change issue, to be fair).
4) The Politicisation of Everything
The recent price action around the ongoing Russian debacle is rather telling. Unfortunately, we have grown up in a world where markets are supposed to be forward looking instruments and efficient. Despite the tremendous amounts of work done by father of the efficient-market hypothesis Eugene Fama, markets are made up of people. People aren’t always rational. Take the US’ stance on Russia preparing for an invasion of Ukraine despite very little evidence provided by the Biden administration. The volatility that we saw in the market digesting this is, we would argue, in no small part that of some traders (even on institutional desks) disbelieving an administration that does not align with their views while the other side does.
The debate on climate change and the energy transition is one we feel should be a purely economic question. But somehow it has ostensibly become a political debate between left and right, something we see as a megatheme the world over. The level of polarisation Stateside is at levels not seen since the Civil War. The debates across most of the developed world are similar, no doubt helped along by strongmen like Tsar Putin and Emperor Xi in their quest to dismantle a West they blame front and centre for their nations’ historic declines. Putin for the chaos after the fall of the wall (which arguably paved the way for his rise) and Xi restablishing Chinese “national pride” after the last 200-odd years of insults from the Opium Wars through to WWII and beyond.
But why does this matter to the investor? Simple, too often now we are seeing policy decisions made along broad partisan lines as opposed to being genuinely considered on the nuances/ economics of the matter. As the mainstream political spectrum has (seemingly) become wider and wider, compromise has become harder and harder. The Green Transition a perfect example; the further left you go on the spectrum, the more consideration given to immediacy and less consideration given to the economic impact (both the cost to consumers, how it will be achieved, and broader) while the further right you go it reverses. It is a variable that has become increasingly difficult to account for.
Over the next few weeks we will be providing commentary on half yearly results for some of our key holdings. During February companies report their half yearly results for the period ending December 31st while also providing an outlook for the full year results. Companies will typically host a conference call with investors and you’ll hear just about every analyst asking management to “provide more colour” to the results in the Q&A section to get as much commentary as possible on why the numbers came out the way they did and what to expect for the next set of results. This week we will discuss the results of MNY and SWM.
Seven West Media (SWM.ASX)
Author: Ron Shamgar
Seven West Media Limited is a national multi-platform media business based in Australia. SWM’s media comprises of Seven Television, The West Australian newspaper and associated WA regional newspapers and radio stations. Media companies like SWM have been overlooked by the market even though they are undergoing significant business transformations and generating lots of cash flow.
PRT Acquisition
Late last year SWM completed the acquisition of Prime Media Group, formerly Prime Television Limited, for a cash consideration of $121.9m (they also failed to acquire them in 2019). To fund the deal SWM refinanced their debt facilities, halving their interest costs and extending their maturities. PRT did $170m in sales in FY21 and over $30m in EBITDA. The rationale behind the sale is as follows:
Providing advertisers with a single platform that will deliver superior audience reach across metropolitan and regional markets
Unlocking the premium and integrated revenue potential of the combined metropolitan and regional audience base across broadcast and digital platforms
Enhancing the audience proposition through re-investment in content and expanding the digital delivery of SWM’s offering in regional markets
Generating estimated cost synergies of $5m to $10m on an annualised basis. The costs savings are expected to be fully realised within 12-18 months from completion of the acquisition. Revenue upside is also expected but has not been quantified
Source: SWM company filings
Results Commentary
We thought SWM reported a strong result with revenue up +27% and NPAT up +48%. Management also upgraded their FY22 EBITDA guidance to $315m-$325m, marking the second time they have upgraded guidance in the past few months. The key driver behind these results was the growth in digital revenue which was up +176% and made up 35% of the group’s revenue. This is projected to make up 40% in FY22. They commented on the integration of their PRT acquisition which has already realised $5m in cost synergies. It is important to note that PRT currently has no digital revenue and, seeing how SWM grew their digital EBITDA from $62m in FY21 to $130m in FY22F, there is potentially a lot of upside there. SWM had tough starts to the calendar year in CY20 and CY21, losing just about all their ratings weeks. However, in CY22 they have won the first four out seven weeks and are taking revenue share away from channels Nine and Ten. SWM currently has a 41.4% revenue share of a $3.8bn market and expect to maintain at least 40%. Seven are currently airing the Winter Olympics, boosting their digital numbers, while they also had the Ashes at the back end of last year.
Outlook
Whilst SWM reported a strong result we were a bit disappointed that there weren’t any capital management initiatives. They are on a leverage ratio of 0.9, well within their target range of 1-1.5x which means they are planning on returning capital and/or have room to look at more M&A. The board is assessing how they will be returning capital over the next six months and should announce a dividend or buyback in FY22. We think that the reinstatement of dividends is a major catalyst and currently what is holding the share price back. SWM currently has $295m of net debt and, taking their midpoint guidance, they are currently trading at approximately 5x FY22F EBITDA ($320m minus ~$40m of capex). Assuming they do $200m of NPAT for FY22 and they were to payout 30%, that would be a 4 cent dividend. A 5.6% yield at the current share price. Upcoming tailwinds include the return of their number one show, The Voice, as well as the upcoming Federal election. While it is a small piece of the business, Seven West’s Ventures portfolio is up +56% to $87m. This portfolio is part of their ‘media for equity’ strategy where they provide advertising for companies in exchange for equity. Recently they did a deal with Raiz Invest (RZI.ASX) which saw SWM gain a 6.6% stake in the company.
Money3 (MNY.ASX)
Money3 Corporation Limited is involved in the delivery of secured automotive loans as well as secured and unsecured personal loans. The secured automotive loans relate to the purchase of a vehicle with the vehicle as security for the loan. MNY currently has a loan book of $600m, having grown considerably over the past few years. They operate through three segments:
Money3, its Australian auto finance business,
Automotive Financial Services, prime consumer and commercial loans
GoCar Finance, NZ auto loans business
Source: MNY company filings
Results Commentary
MNY also provided a strong update for H122 with revenue up +34.5% and the loan book up +45.7% to $690.8m. MNY are on track to reach an $800m loan book for FY22 and are currently originating around $40m of new loans every month. Their EBITDA margins have been higher as result of artificially low bad debts due to a lot of MNY’s clients benefiting from the superannuation drawdown. The team still expects to maintain margins above 50%. MNY also saw the credit quality of their loans rise in the half.Looking at their other businesses, GoCar and AFS, their NZ-based business GoCar has struggled over the past six months as a result of lockdowns, meaning dealerships were closed. Management noted that in September they were operating at 20% of their usual volume. It will take time to rebuild their pipelines but simply reopening is a huge tailwind. Their AFS business has seen strong originations with its loan book up around +80% since MNY acquired them last year. In terms of further M&A transactions, MNY are looking to broaden their addressable market. It would have to be either product expansion (i.e. personal finance) or another loan book that gives them access to more dealers and a larger overall presence.Rising rates is a huge concern for financing companies like MNY as their cost of funding will rise accordingly. However, MNY believe that their cost of funding will continue to decline even in a rising rate environment. A significant portion of MNY’s loan book has been funded through equity; MNY were late to the party in terms of establishing debt facilities which means their funding costs are higher than their competitors. With the credit quality of MNY’s loans rising and with the increasing scale of their facilities, MNY expects their funding costs to decrease even as interest rates rise.
Outlook
MNY are forecasting an NPAT of at least $50m for FY22 which currently places them on a PE of around 14x. MNY are well on track to reach their goal of achieving a $1bn loan book by FY23, this should translate to at least $60m of NPAT, putting them on a forward PE of 11x earnings. All while paying out juicy dividends. The semiconductor shortage remains a tailwind for the industry with second hand car prices at all time highs, increasing the value of MNY’s loans and reducing bad debts. We also expect to see their NZ business gain momentum coming out of lockdowns.
Disclaimer: SWM & MNY are both currently held in TAMIM portfolios