This week we again look to the headlines and look at an issue that has been front and centre for the markets, that of the Ukraine situation (perhaps a reprieve from the endless monetary policy commentary). Firstly, we begin with a rather macabre fact about the markets. Wars (we aren’t suggesting that this will be an all out conflict, at least in the traditional sense) aren’t necessarily bad for returns, think back to the First Gulf War. Looking through history, some of the best returns for equities investors in the first half of the last century were in fact the US’ entry into WWII (1942 – 1945) before entering into a period of what has been termed the postwar blues (1945-50). When was it they saw the next leg up? While it may be a touch oversimplified, entry into the Korean War. For the precious metals fans amongst you, gold hit all time highs over the course of the first year of the Soviet invasion of Afghanistan (1980).
So now with that rather calming start, lets look at Ukraine and where this situation might head. Ending, as always, with the implications for the investor.
A walk down history lane
Again, we begin with the usual disclaimer for the historians amongst you that we are taking a rather broad strokes approach to explaining what can at best be summed up as a complex situation. This is a topic one could write books on, we’ll attempt to sum it up in a few paragraphs.
The second largest nation in Europe (as we know of it today) is one that , some may be surprised to learn, actually preceded the power that now seeks to dominate it in many ways The Kievan Rus’ was a loose federation of tribes (categorised as East Slavic, Baltic and Finnic peoples) that arguably came into existence by the sheer force of the Varangian, being a name given by Eastern Romans to Vikings (primarily Swedes), prince/chieftain Rurik (reigning 862-879). Thus founding the Rurik dynasty which ruled the Kievan Rus’ and its successor states until the 17th century; over the centuries consolidating power and creating some semblance of a Rus’ identity. As with all things, dynasties in particular, this particular federation eventually disintegrated; dissolving into independent principalities each ruled by a separate branch of the Rurik dynasty by the mid 12th century. Of particular importance to remember here is that the Principality of Muscovy became the dominant player in the region. So much so that when Ivan IV (commonly known as Ivan the Terrible) came into his inheritance at the wise old age of three, his appointed regents decided to crown him Tsar of all Rus’ (his grandfather Ivan III, Grand Prince of Moscow, being the first to style himself as “tsar” of all Russia, albeit not officially) .
Unfortunately for the Rurik dynasty, Ivan’s formidable anger also saw him kill his eldest male heir in a fit of rage, he also saw the miscarriage of a daughter-in-law while the one son that did inherit his seat (Feodor) wasn’t able to leave a male heir upon passing in 1598. Leading to the eventual extinction of the house of Rurik (at least in the male line). This again led to disintegration of what was previously the somewhat united Rus’ until the ascension of 16 year old Michael I (Mikhail) of the house of Romanov to the Tsardom in 1613. A decision made entirely by the nobility at the time despite the initial protests of young Michael’s mother; the title carried with it a rather fatal reputation at this point. This particular house, with its quite legitimate concerns around stability (and self-preservation), instituted a trend towards the centralisation of power in the hands of Moscow. Bringing to heel many of the outer principalities, including what we know to be Poland (more recent Tsars also being Grand Dukes of Poland), modern Ukraine, the Caucasus and central Asia.
The above is a vast simplification given that it is primarily Russia-focused. Failing to focus on the uniquely Ukranian principality of Kyiev which reached its zenith in the reign of Vladimir the Great (985-1015) when its place on the top of the food chain ensured that the Rus’ adopted christianity, in particular the Byzantine version of Eastern Orthodoxy. Following the latter’s disintegration, later rulers could legitimately claim leadership of the church. It also ignores its dramatic fall from grace under Polish influence (when that particular polity was still independent of Moscow), the Mongol hordes and the Ottoman Empire (the Rus’ submitting to Mongol rule for 300-odd years). The context we are trying to establish is that the concept of Rus’ is evolving, the ethnicities/cultures quite diverse and the way in which Moscow dealt with the situation was to centralise power.
How did Moscow go about this? Let’s take Catherine the Great as an example, her attempt to ensure stability involved inviting Germans into the lands that are now modern Ukraine in the hopes of changing the demographics of the population. Ring familiar to recent events? That is, the granting of Russian passports to Ukranians (Russians, by the way, are the largest ethnic minority in Ukraine). Add to that the process of what is now referred to as Russification, a process by which culture would be standardised and a common language adopted.
So how did the Bolsheviks handle this trend? For one, it was more of the same, perhaps worse. Once coming into power, their quest for getting rid of feudal traditions and rapid industrialisation led to even greater centralisation in the hands of Moscow. It was Stalin (a Georgian himself) who is perhaps most infamous in the Ukraine story. Manufacturing a famine in the region that wiped out close to five million people in order to force them toward collective farming and quell any vestiges or notions of independence. Suffice it to say, they continued Russification but this time on an industrial scale.
So, the point of the above brief history? Moscow has seen these peripheral territories as her own for the best part of 500 years and any instability (at least insofar as it is not aligned with her interests) is automatically deemed to be her issue.
Kiev
So, back to the modern context?
Let’s begin with the agreements, handshake or otherwise, that Western governments (NATO included), especially the US, made with Moscow. Eastern Europe was supposed to be out of bounds, Regan went so far as to assure Gorbachev that no military installations would be made there. Fast forward to the Yeltsin era, we all know the debacle and chaos that was 90s Russia. It is within this context that a little known but rather efficient ex-KGB agent named Putin (serving in a number of roles in the upper echelons of the St Petersberg administration) really began his ascent. Appointed by Yeltsin as Director of the FSB in 1998, Putin was Prime Minister by the end of August 1999 with Yeltsin also making it clear that he had found his successor. When Yeltsin unexpectedly resigned on 31 December 1999, Putin became Acting President of the Russian Federation. Arguably escalating the Second Chechen War over the course of his time as Prime Minister/Acting President, Putin’s popularity rose (war does tend to do wonders for approval ratings). That conflict also shows Moscow’s views on stomaching diversity (it is, after all, a confederation in name at least). Officially inaugurated as President on 7 May 2000, Putin installed another strongman, Kadyrov, as “head of administration of the Chechen Republic” in June and ensured the capital’s supremacy. High oil prices during the first half of the 20th century saw a resurgent economy and surging approval ratings.
Fast forward to post-GFC, sanctions had taken their toll and low oil prices saw the economy in doldrums. So, the rhetoric again changed. This time it was Georgia as a substitute for Chechnya, nominally supporting independence for South Ossettia and Abkhazia. The story again, much like the Second Chechen War, centred on stability and ensuring safety (at this point, there may be a pattern emerging). This is all despite ethnic cleansing of Georgians from her previous territories…
Which brings us to poor old Ukraine. A nation that fought for her independence and, during the initial days of the collapse of the Soviet Union, was given assurances by both sides that there will be little interference. Believing this to be the case they promptly disarmed (the nation having one of the biggest nuclear arsenals at the time) and even more promptly fell apart (politically with interference). Being pulled on one side by the prospect of greater integration with the EU, which aggressively took on ten new additional members previously under Moscow’s reigns in short order, and on the other by Russian fears of encroachment.
On the latter front, Moscow decided that the best potential strategy was to rig the elections that saw Viktor Yanukovych come to power. Following public outcry, it also decided to use one of its more infamous problem solving techniques; radiation poisoning of the opposition candidate Yushchenko. This however led to the Orange Revolution and, despite back and forth between establishment parties over the next decade, it was the public that paid the greatest price. Yanukovych eventually came to power again in 2010. Some stability followed but following his dislodgement in 2014 in favour of the Pro-EU Poroshenko, Moscow’s response this time (instead of poisoning) was an outright annexation/secession (whichever way you wish to look at it) of Crimea. Again, an oversimplification but the broad strokes are there.
The latest foray by Moscow can perhaps be construed as another penalty on Ukraine for the election of a pro-EU government led by outsider, actor/comedian Volodymyr Zalenskyy, in 2019. Whose most recent claim to fame at that point, by the way, was playing the role of the President of Ukraine in a TV show. One can appreciate the level of the public’s disenchantment with the establishment for this to have occurred (with this disenchantment perhaps we see parallels with US politics recently). Again, in sticking with tradition, the message from Moscow is rather clear; if you want stability, the only way you get it is via Moscow.
Not to mention, as with all Tsars of the past (there is little doubt in our minds that the Rus’ never truly let go of the concept, whether they wish to call them Tsar, Comrade or President), justification and legitimacy has always been on the premise of looking towards Moscow for direction. Effectively in his third decade in power, Tsar Vladimir Vladimirovich of the House of Putin does need to justify his rule after all.
Where does this go then?
Perhaps the one of the best analogies to the world of geopolitics is that it is closest to the game of chess. At the end of the day the outcome is predicated on the king, it is not a question of who takes the most pieces in the game. Great powers/leaders are exactly that. It is not quite immediately obvious how precarious their situation is until the very end (and they can usually move very little). But the pieces around them are exactly that; some are pawns, some rooks and others queens. Their survival predicated on their ultimate necessity to the king, sacrificing a piece is so often the play. Don’t believe us? Look at the Cold War. How many proxy wars? How much collateral damage? And yet the two “kings”, the US and Soviet Union, never came into direct conflict. Only to fall like a house of cards. More recently, the untouchable Gaddafi (who died in a gutter). And if certain intelligence services are to be believed, the supposed rigging of an entire election in that bastion of democracy that is the United States of America (take your pick, depending on which side of the political spectrum you sit on, 2016 or 2020).
Back to the issue at hand, neither “king” can afford to lose face and must withdraw amicably, perhaps at the cost of a pawn (i.e. Ukraine). Basically, Moscow cannot lose face nor its influence in its so called backyard. Europe cannot put its energy supply at risk and the US cannot afford a war over Ukraine (to be blunt, it just might not be valuable enough). There will be a solution at the expense of Ukraine for the kings to draw back and not surrender at the feet of the other. Biden ironically made the first move by implying that Russia was amassing troops at the border for an invasion which Moscow explicitly stated was not the case (they were of course in our view waiting for the right weather and an opportune excuse). If they invade, it makes them look like they reneged on their word to the international community. However, if they withdraw Putin loses face to the gallery (i.e. electorate) with the added advantage the US administration can claim to have de-escalated the situation. Our base case? Some nonsense about perceived (real or otherwise) oppression of ethnic Russians being sorted out and lip service given. It will be back to business as usual with Russia gaining concessions and biding its time, waiting to rig the next election. There will also be an understanding that Ukraine will not have the opportunity to join the EU or NATO any time soon (if ever). At least not as long as Tsar Putin is in power (given that he has spent part of his reign ensuring he can basically remain in power indefinitely, this could be a while).
As Biden unfortunately put it, Russia would “be held accountable if it invades [but] it depends on what it does…it its a minor incursion….etc”. Basically indicating that it could get away with something, within reason of course. In many ways this dovetails perfectly with the other side of the equation; the Russian stance here reeks of Putin testing where the line is (in saying that, his Chinese counterpart will be watching this unfold with great interest). He may stick his toe over the line but we doubt very much that he would cross it properly and risk full scale war with the US/NATO (though the odd cyber attack clearly isn’t off the cards).
Outcome driven, pure and simple, no one actually wins. The major players will advertise that they did while Ukraine certainly loses. Its the unfortunate reality of the world we live in.
Implications for markets?
The uncertainty will certainly put continued upward pressure on the price of Brent and LNG. Although a perceived resolution should see some reprieve, given our contention around peak oil, this will be short-lived (a buying opportunity perhaps?). The most important implication for us however will be the impact on monetary policy, especially CPI data (upon which central banks must at least be seen to do something about). We could either see this turn the Fed more hawkish or offer a much needed excuse for why inflation is not transitory thus allowing them much more flexibility. If the latter, then this may be good for the marginal investor. If the former, we could have a problem.Nevertheless, we stick to our contention that there is very little breathing room left for the Fed. Why do we say this? If we go to historic norms about the nominal yield being at least 50bps above inflation, then the rate should already be at around 4%. Good luck with that. Effectively quadrupling the interest burden on state and local governments within the space of a year? One wonders how long central banks may stay independent in that instance (i.e. without pushback from the political establishment).
If there is an accident and there is a conflict (more likely to be via a proxy). It will almost certainly allow for more dovish stances from central banks with some much needed reprieve for the equities investor (not to mention precious metals).
Concluding remark
The above may seem a rather cynical and blasé approach to take and we do firmly acknowledge the blatant unfairness and disregard for even common decency that the situation entails in relation to the Ukrainian citizenry. Being a pawn in a larger game of geopolitical chess is no fun for the pawns. If you do truly want to avoid more wars in Eastern Europe, pray that oil prices stay high enough and sanctions are dialed back enough that the modern Tsar wont need another war to push up his approval ratings domestically.
2022 hasn’t started like most people were hoping with January being the worst start to a year on record, the S&P500 being down -11%, at one point. The ten largest stocks on the index were down -20% at one point and the average Nasdaq stock was down -50%. In Australia, the tech index hit an intra month low of -25% while the Small Ords was down -13% at one stage. This week we have seen a bounce back in equity markets but one could argue that we are in bear market territory based on some of those figures, yet there’s no global recession in sight.
Author: Ron Shamgar
In our view, this is primarily caused by inflation concerns which will lead to higher interest rates this year and next. We are of the view that inflation will ease in twelve months as Covid-related supply bottlenecks and labour shortages ease up. In saying this, some companies are actually significant beneficiaries from an inflationary environment and higher interest rates, today we highlight three:
EML Payments (EML.ASX)
EML Payments Limited (formerly EMerchants) are a provider of payment solutions; offering payment technology for payouts, gifts, incentives and rewards, and supplier payments. EML issues mobile, virtual and physical card solutions to a number of corporate brands around the world and manages more than 3,500 programs across 26 countries in North America, Europe and Australia.
Outlook
EML has seen a depressed share price since announcing its issues with the Central Bank of Ireland (CBI) in May of last year, even though these issues have since been resolved. It makes no sense that EML is still trading at half the market cap they were since resolving their CBI correspondence. EML is now trading at a lower multiple to its peers despite their FY22 guidance being reaffirmed, which should see a 30% increase in EBITDA. Their pipeline is huge at $10.5bn while their recent acquisition of Sentenial and their contract with Banco Sabadell gives them a huge presence in Europe. Heading out of lockdown and into Christmas they would have also seen an increase in their gifts and incentives segment. EML is sitting on an EV of around $1.05bn, we believe EML will do at least $80m of EBITDA in FY23 which will put them at a forward EV/EBITDA of around 13x.
Source: EML company filings
EML will be a big beneficiary from rising rates. As a global E-money issuer, they currently hold a growing balance of customer card funds worth $2bn. EML gets to invest those funds but, with rates at zero, they aren’t making any return at the moment. Going forward, investors should think that for every 1% rise in rates across the US/UK/Euro, EML should earn $20m of incremental profit. If rates rise 2-3% over the next couple of years, EML will earn an incremental $40-60m of profit (2-3x their current profitability). We don’t believe investors have fully grasped this and it is why EML is our top pick for 2022.
PeopleIn (PPE.ASX)
PeopleIn, formerly People Infrastructure, is a provider of workforce solutions mainly in health and IT. Services provided by the group include recruiting, on-boarding, contracting, rostering, timesheet management, payroll, and workplace health and safety management. The four main sectors PPE is targeting include healthcare, community services, industrial services and information technology. PPE has a track record of successfully acquiring and growing businesses through leveraging its core capabilities in the sourcing, skilling, deployment and management of workforces
Outlook
PPE has a strong pipeline of acquisitions and is well funded to pursue them with $50-70m of available funding through debt and free cash; given their strong funding, the strategy is non-dilutive to shareholders. Their past acquisitions have been earnings accretive and have expanded the industries PPE operates in. Their most recent acquisitions, Techforce Personnel and Vision Surveys, increased earnings per share by 19% and the combined deal was done on a valuation of approximately 3.7x pro forma EBITDA. Their acquisition strategy opens up new regions for PPE to capitalise on and creates a much bigger addressable market for the group, as seen by their move into the healthcare recruitment space.
Source: PPE company filings
PPE provided a robust update recently, confirming FY22 earnings to be within analyst expectations (PE multiple of 12x). Their business is a massive beneficiary of wage inflation driving higher margins as they earn a commission. In addition, low levels of unemployment in Australia and a high turnover of employees, are all factors seeing higher demand for PPE services. With the borders reopening PPE should benefit from the resumption of international labour. Next catalyst for the stock is acquisitions which they have been very disciplined on. Our valuation is $5.00.
Note: At the time of writing, PPE announced the acquisition of Perigon Group, a leading accounting recruitment business, which will be key in executing PeopleIn’s growth plan with high anticipated growth expected in finance and accounting recruitment services over the next five years. Annualised expected EBITDA contribution of ~$4.3m and earnings per share accretion of approximately +8% in FY23. Upfront consideration of $16m (on a cash and debt free basis) representing a multiple of 3.7x pro forma expected FY23 EBITDA
OFX Group (OFX.ASX)
OFX is a provider of Forex services to consumers and corporates globally. As revenue is transaction based, OFX is a beneficiary of elevated inflation. Last week OFX provided a strong Q3 update with revenues up 21% to $39m. Management has upgraded FY22 guidance from 10% growth to 17-22% revenue growth. We think that’s conservative based purely on the Q3 run rate.
Firma Acquisition
At the back end of last year, OFX announced the acquisition of Canadian foreign exchange business Firma for AUD $98m, representing 9x Firma’s LTM EBITDA. The deal will mostly be funded through a new $100m debt facility OFX has secured, meaning the deal is not dillutive for shareholders. The acquisition is part of OFX’s strategy to increase their presence in North America and it will allow them to further leverage their sponsorship of the NHL. Firma will add over 9,600 clients, increasing OFX’s North America revenue by 121%.
Source: OFX company filings
Firma will add $50m of revenue and approximately $11m of EBITDA to the group. The deal makes a lot of sense; it will be immediately EBITDA accretive and give OFX increased exposure to corporate clients who are more stable than the consumer market.
Outlook
As mentioned, OFX is a beneficiary of elevated inflation. We have already touched on their strong Q3 update (revenues up 21% to $39m) and upgraded FY22 guidance (to 17-22% revenue growth) which we think is conservative based on the Q3 run rate. The above acquisition should see EBITDA grow to $55m in FY23, placing OFX on a 10x EV/EBITDA valuation. This, in our view, is cheap compared to global peers and we think OFX is worth $3.00. OFX have been buying back shares and will be releasing their full year results mid-May.
Growing up it was ingrained that two topics are rather taboo to discuss at the dinner table; the first being politics and the second money. So, with the hope that you’re not having dinner as you read, this week we discuss the former while touching on the latter. Perhaps a subject that you may not be expecting to read about in an investment newsletter.
In particular, the subject we wish to explore is whether our esteemed or not so esteemed PM (depending on which side of the political spectrum you sit on) has been backfooted in formulating a national strategy with regards to Covid policy and in particular in relation to the McGowan government of WA and their stringent adherence to a 0-Covid policy (a policy that rhymes with that of Beijing one might add). So, we would like to address that topic and whether it is even the right question to ask of a Commonwealth Prime Minister? This may not seem like a topic of particular interest to the investor but bear with us and toward the end you may just understand why it does.
For the lawyers or historians amongst you, this may seem rather basic. Before proceeding further however, let’s begin with the conclusion. It is a definitive no. Why? In order to understand that one needs to understand how institutional building occurred in this country.
A walk down history lane
Have you ever asked the question why we need different licenses when we cross state borders? After all, we live in the same country. This is the question that started a journey to understanding how Australia has been built. The nation and polity as we know it today is a young one, one that came into being in 1901 when six self-governing colonies decided to join together to form a Commonwealth (on a side note, Fiji and New Zealand were also initially part of these discussions before going their separate ways). A process that took close to five decades given the original idea (justified by efficiency) was drawn up by the 3rd Earl Grey (his father, the 2nd Earl Grey, being of Earl Grey tea fame according to some legends) in 1847.
The idea of federation received much opposition (justifiably so) during the initial stages given that many of the smaller colonies feared that a national polity would be dominated by the more populous states and their rights suppressed; each colony having evolved its own unique sense of identity and organically developed their own institutions at this point. It is within this context that Australia, unlike the UK with a unitary polity, developed its federal structure. A structure which, after much negotiation, was supposed to ensure checks and balances, whereby a Federal government would be curtailed to issues of national interest. The constitution specifically enumerates 39 areas in which the Federal Parliament may make laws, the most important of which is trade and commerce, taxation, immigration and external affairs. Those areas which are not specifically set out still reside with state legislatures by default. There was such suspicion about government overreach that when states decide to voluntarily delegate certain powers to the federal level out of necessity, sunset clauses (whereby they expire after a certain date) can be applied. Many may be familiar with the debate on funding for public hospitals which was a rather contentious topic what seems like a lifetime ago, in 2007. In particular, should the Federal or state legislatures bear responsibility for it. States are still responsible for health.
So, why then has the Commonwealth become so powerful? Simply put, control of the purse strings. Remember that it is the Commonwealth that has the first right to levy taxation. The most familiar of taxes, income tax, was first imposed by the Commonwealth during WW1 as a temporary wartime measure and, up until 1942, was imposed both by State and Commonwealth governments. Following WWII, the Commonwealth took over the raising of all income tax to the detriment of the states. In essence, while the states remained responsible for providing the majority of services, the revenue primarily remained with the Commonwealth. Ensuring an unequal partnership.
Aside from this, landmark decisions by the High Court have supported this power imbalance. The case in question here is the Tasmanian Dam Case (Commonwealth v The State of Tasmania, 1983), where the Hawke government prevented the Tasmanian government from constructing its hydroelectric dam on the Gordon river by using nebulously defined provisions under its enumerated powers (i.e. external affairs) and claiming the dam went against Australia’s obligations under the UNESCO world heritage program. It was a direct examination of the division of powers between the Australian federal government and the individual state governments. Part of a broader trend that sequentially ate away at state powers.
So, with that history, let’s come back to the present. Asking whether our PM is showing a lack of backbone in dealing with state policies that seemingly go against the Commonwealth government’s stance?
Our system and constitution, much like the US or many modern democracies, was designed with the intention of checks and balances. As it currently stands, this is a state issue and it is arguably not a call for Scott Morrison to be making. It is a choice for the people of WA, who have seen fit to re-elect the McGowan government with a resounding majority. Moreover, even the implication that a Commonwealth PM attempts to circumvent institutional frameworks and take a hardline against what has been explicitly stated as a state issue is, in our view, a dangerous precedent to set. That is not to say that the Federal government could perhaps have done more in taking a leadership position on the issue or been more or less forthcoming with support, we are not here to pontificate on that, but the issue is ultimately a state one as the Constitution of Australia is currently understood.
Our democracy may seem flawed at times, it may be that times have changed and people no longer think in terms of state identities, but the question of checks and balances should be one that is always front of mind. We’re not making a judgement but let’s put forth the hypothetical that what was supposedly said by Cabinet members in recent text messages is true and we do have a so-called “psycho” or “liar” running the country. The very framework that seems so blatantly inefficient at times is also one that protects us. This isn’t an issue unique to Australia, we don’t need to go into the issues around the US political system and how their checks, balances and inefficiencies in dividing state and federal power are probably in need of review. None of these systems of government are perfect.
So, why should we care about this as investors?
In our view, we see the rhetoric and the positively vitriolic debate, as well as a blatant mistrust of institutions, as a potentially dangerous move for the investor. And one which the investor must always be cognizant of. Larger global institutions like the UN, EU and WTO may be flawed, our Federal structure may be flawed but one must remember why they were created in the first place. The first two institutions, over-simplifying things a touch, so that we don’t kill off each other at an egregious pace. How often were all out wars fought in Europe pre-EU and how often after? The drop off is remarkable. The WTO may also seem flawed but, again, how many trade wars and nations undertaking beggar-thy-neighbour mercantilist policies did we have preceding its creation and how many after.
For every failure of the rules based democratic institutional framework, there are countless other success stories. For every China that didn’t follow the path, there is a South Korea, a Taiwan, a Japan etc. The spectrum is broad.
So coming back to the local context, next time you get frustrated perhaps ask your Premier or your local representative? Too much has been lost and countless sacrifices made for our democracy, whatever its flaws may be.
As for the protests and the countless ethical and social questions, this particular author would be more concerned if there were no protests at all. Whatever your view may be on the validity of the opinions of the participants. If one truly believes that there is government overreach (whether in reality or not) and does not do anything about it, that is arguably more dangerous for democracy than anything else in a given democracy. It would be fantastic if we could vote on every issue and live in a true “democracy” (not a guarantee that anything would be or have been different) but this simply isn’t feasible or efficient. It was even less feasible when many of these systems/democracies were formulated (think about how technology and communication has advanced). Hence functions like three, four, five year election cycles. Modern democracies are a compromise of efficiency and democracy and the checks and balances that surround this.
So no, whatever Mr Morrisons faults may be, an unwillingness to bully states as a Commonwealth PM in a Federal structure is not one of them. If you expected him to do so because you don’t necessarily agree with what your state governments are doing, then ask the question (at the risk of making a slippery slope argument), if the Commonwealth steps in on this issue, where will it stop? Were income taxes not meant to be a temporary measure? We all know how that went. If you think they were, do reach out, it would save us a lot of helpless despair and tears during tax season.
Coming back to investment markets, we feel that this is one of the biggest risks you should be aware of. The gradual decline of institutional trust and the frameworks that helped us all as investors see phenomenal returns were made possible precisely because of this context. Have you ever wondered why, despite a 0.1% cash rate or laughable interest rates across most of the developed world, investors still pay a premia to park their funds there? It is a trust in the institutions. Consider even a mining company with operations in say Guinea with the same economic metrics as one in Australia, the differential in valuations are astounding.
It may seem that we are drifting away from the original question of the Morrison government and its stance, but we see this as a broader tendency (and a global one at that) which questions the very foundations of our so called neo-liberal world order. Every little instance, such as a Twitter feed, matters. This, in our view, is one of the greatest long term risks for the investor. One that much be watched carefully.
We may feel frustrated, we may rant, the alternative for the investor is the differential in valuation between an Alibaba and an Amazon. It is precisely the reason why Gazprom, despite arguably better metrics, does not have the same value as an Exxon Mobil. The protection of the rules based global order is the single and most important aspect of the global economy.
Still can’t accept this notion? Consider Ukraine at the moment. What most people consider when looking at this story is the fact that a significant amount of the EU’s gas and energy supply comes from Russia and thus any imbalance will have a significant impact on global growth. But look further, there is another story, it is a contest between a rules based, liberal democratic outcome and one expounded by Russia, of ruthless pragmatism. For the investor, consider also something that most people don’t look at. Something as simple as sunflower oil, for example. Ukraine accounts for around US $4bn in that particular export to India, stop that and you will have a significant impact upon CPI data with flow on impacts on monetary policy. Flow on effects on monetary policy means asset valuations and growth. Say India’s growth slows as a result, what is the effect for you as an Australian investor? Ask the question what is the eventual impact for commodities such as iron ore?
This is not to say that the current institutions aren’t flawed, all compromises require give and take, or that we don’t need to examine and evolve our institutions over time. But perhaps the greatest advantage of institutions is that they curtail action (it may seem inefficient and frustrating but thank god/s for that).
Ron Shamgar lays out the investment thesis for a stock he believes will soon be the subject of a takeover offer.
ClearView (CVW.ASX)
Note: This investment thesis was originally circulated to clients on 9 December 2021. CVW remains a position in TAMIM Australian equity portfolios.
ClearView is a financial services company which partners with financial advisers to provide life insurance and wealth management services. The company has undergone substantial changes in recent years and is focused on developing their new platform for life insurance to drive scale and efficiency. Clearview currently works with 772 dealer groups, representing over 4000 advisers. Clearview has been performing well in challenging market conditions; they saw increased claims last year and with interest rates at an all-time low, interest income has been significantly impacted. That being said, ClearView continues to execute its strategy which has led to a steady share price recovery. We believe the company remains materially undervalued given its strong growth profile and embedded value (EV).
Life Insurance Industry
Authors: Ron Shamgar & Adam Wolf
The life insurance industry was rocked by the 2019 Royal Commission which saw many of Australia’s major financial institutions in the news for all the wrong reasons. This was further exacerbated by other negative events such as the Freedom Insurance debacle. The impacts of this were mainly centred on how life insurers sell their products, and this has put a huge stain on the industry in recent times, but this is now in the past and ClearView is on a growth trajectory. The industry participants have also been engaged in the very unprofitable activity of scrambling for market share by lowering costs. This has seen a collective $5bn being blown up by insurers over the past five years in a race for market share. New regulations from APRA have seen the sector change their policy prices, bringing the sector back to profitability.
Source: CVW company filings
The recent issues faced by the sector has seen several insurers trading at depressed prices and, with investors overlooking the sector in general, we see a huge opportunity in ClearView. The sector has returned to profitability and the company looks to implement transformative initiatives in order to grow their business. Looking forward, life insurance is a necessary product and all working age individuals have a need for income protection insurance. Australia also has sky high household debt, typically a tailwind for Total and Permanent Disability (TPD) insurance cover which covers the costs of debt repayments. High household debt coupled with population growth and the repricing of policies gives us a positive outlook for the growth of the industry in general.
Source: CVW company filings
FY21 Results
FY21 saw ClearView report a strong result to the market with operating earnings up +83% to $23.9m and underlying NPAT up +54% to $22.7m. Considering the challenges presented by low interest rates and Covid-19, this was an exceptional result for ClearView. They saw their gross premium income rise +7%; this growth will follow through to FY22 as they raise their pricing policies. Even though funds management represents a very small piece of the business, the core focus is firmly on insurance, ClearView also increased their funds under management by +22%.
Capital Management
It is important to assess a company’s ability to allocate capital, what capital management strategies they are using to return value for shareholders and whether they are making the most of opportunities. ClearView has been buying back shares aggressively and, while we typically prefer dividends (it makes more sense with franking credits as opposed to US companies that prefer buybacks), they have executed these buy backs at an opportune time (around 50 cents per a share). They have also extended the program, indicating that management still think the share price is too cheap. ClearView has also reinstated their fully franked dividends and intends to payout 40-60% of operating earnings.
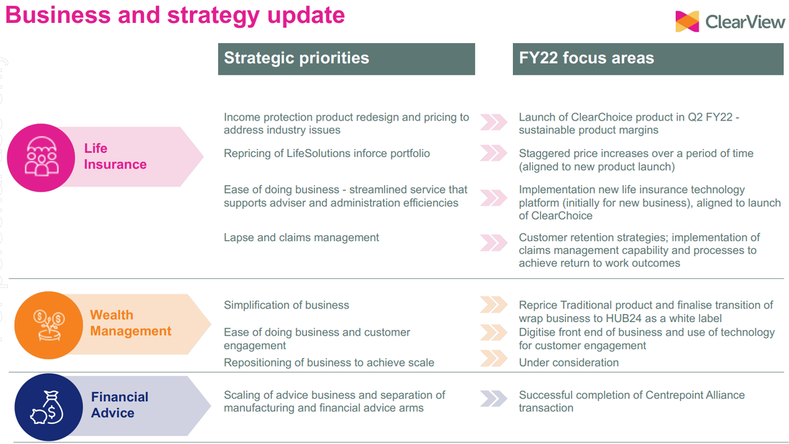
ClearChoice Transformation
As part of ClearView’s multiyear transformation they have been developing and investing in their new insurance platform ClearChoice, which will be replacing their existing life insurance platform. The new platform will deliver an enhanced user experience, drive efficiencies, and become a single source of truth for all customer data. Improved access to accurate customer information and the ability to generate data-driven insights to capture timely opportunities and aid strategic and tactical decision-making is one of many benefits to come from ClearView’s new ClearChoice platform. The platform is launching in Q2 FY22 and will also implement new policy pricing increases which will increase operating earnings.
Source: CVW company filings
Sale of Financial Advice Business
In August ClearView announced the sale of their financial advice business to Centrepoint Alliance (CAF.ASX), another holding in our Australia Small Cap Income portfolio. The total consideration for the sale was $15.2m to be paid in cash and shares, Clearview receiving 48m CAF shares and $3.2m in cash. The deal with Centrepoint Alliance provides the combined entity with immediate scale, a strong and effective management team, best of breed technology/processes and the capability to take a market leading position in the financial advice industry to build a strategically successful and profitable financial advice business. The deal allows ClearView, through their interest in Centrepoint Alliance, to continue participating in the growth of the financial advice sector while effectively removing any perceived conflict of interest.HUB24 Partnership
Last year ClearView announced a partnership with HUB24 which will see over $1bn in funds under administration migrated from the current ClearView WealthSolutions wrap platform to HUB24. The partnership is set to deliver on ClearView’s previously advised project seeking a modern replacement solution for its wrap technology. It is expected to substantially address the tax credit issue for the ClearView Retirement Plan and foster business simplification as they continue growing their life insurance and wealth management businesses.Manulife Partnership
ClearView has entered a strategic partnership with Canadian wealth firm Manulife Investment Management, the global wealth and asset management segment of Manulife Financial Corporation (MFC.TSE), to launch a range of products with an immediate focus on retirement income solutions. It is important to note that it is a non-binding memorandum of understanding (MOU) (we typically don’t like to pay too much attention to non-binding agreements). The partnership will leverage ClearView’s local product development and distribution capabilities with Manulife’s global expertise across public and private asset classes as well as ESG integration. Given Australia’s rapidly ageing population, this is a thematic worth targeting.
Outlook
As mentioned, the life insurance industry has been through a particularly turbulent period due to pandemics, Royal Commissions, and broad poor pricing policies. With all this now in the rearview mirror, the industry has returned to profitability and is growing. Yet Clearview is still trading at a substantial discount to its asset base. This is despite the fact that it is a profitable business with sustainable recurring revenue that has made a number of strategic adjustments to turn the company around. APRA’s new regulations on pricing policy will boost profitability and, given how high household debt is in Australia, insurance policies are always going to be in high demand. Additionally, Clearview’s new ClearChoice platform will help them create more efficiencies in the business and begin to leverage the data they collect to produce insights that will further help them grow the business.
But none of this is why we bought this stock as a takeover target.
Strategic Review
In early September of this year [2021] CVW announced that:
“following an evaluation of the Company’s future capital structure and discussions with CVW’s largest shareholder, Crescent Capital Partners, the Board has commenced a strategic review process. Its objective is to maximise shareholder value, determine the optimal future direction of the Company to protect and enhance customer and policyholder outcomes, and achieve a long term shareholding base.
This review will assess strategic options to unlock and enhance value for shareholders, including potential change of control transactions. … Crescent Capital Partners has advised the CVW Board that it supports the strategic review.”
Source: CVW company filings
Why do we believe a takeover is imminent?
Very similar wording to the above was used by Crescent holdings Cardno (CDD.ASX) and Intega (ITG.ASX) when strategic reviews were announced for them in June, both stocks were held in TAMIM funds. Approximately four months later both companies had received significant takeover proposals from strategic acquirers.
CVW represents the last remaining meaningful life insurance asset up for grabs in Australia with approximately 7% market share. We believe this share is significant enough for someone looking to enter the domestic market and grow but also not large enough to cause competition concerns for an existing player to acquire.
In addition, we believe Crescent’s investment in CVW must wind up and realise its investment into cash by June 2022. This means that they are a motivated seller which in turn makes a favourable outcome (for other shareholders) highly likely by February 2022, as signalled by the board.
The value of an insurance business lies in the embedded value (EV) of its policies and their future cash flows discounted to today. This embedded value can change over time based on new business growth rates, franking credits). Historically, life insurance companies have been acquired in the range of anywhere between 0.8x to 1.6x EV. In the case of CVW, this suggests a figure in the range of 77 cents to $1.54. Usually, when an insurance business is growing like CVW, it is trading or acquired at a premium to EV.
CVW has previously seen two takeover attempts; the first in 2012 by Crescent and the second in 2016 by Sony Life. Due to several reasons at the time, neither eventuated but the offer then was $1.50. While it is unlikely that shareholders will see $1.50 again, we cannot rule it out. Most likely, and based on the current environment, we believe that our base case scenario would be a takeover at a premium to EV of +10%. With some luck, we may end up seeing a bidding war which may then see a much higher offer, i.e. toward $1.50 mark.
We believe that the most likely acquirers would be either a Japanese life insurer, private equity or a new domestic entrant looking to diversify into the life insurance industry. As discussed above, the conditions for the industry are finally positive again.
Disclaimer: ClearView is currently held in TAMIM Australian equity portfolios.
This week we are looking at a small cap company that is providing software solutions to the hospitality sector while also expanding into overseas markets with huge addressable opportunities. The company has a market cap of only $100m and has mostly gone unnoticed to date, without any media coverage, even though they have been growing quickly, making acquisitions and are now EBITDA positive. The events and hospitality industry are clear post lockdown winners and the companies that provide the sector with services will benefit accordingly.
Author: Adam Wolf
MSL Solutions (MSL.ASX)
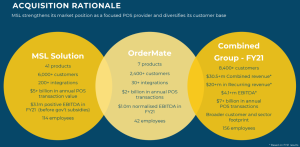
MSL is a global provider of software solutions to businesses in the sport, leisure and hospitality industry. MSL employs 160 staff and has grown its footprint to service more than 8,000 venues around the world. Only two years ago the serviced less than 1,500 venues. MSL develops and delivers fully integrated and modular systems that connect customers to venues through mobile and contactless entry, ordering and payment solutions. MSL’s solutions seamlessly connect front-of-house to backoffice, offering an end-to-end guest engagement platform which provides actionable insights on key success metrics to venues of all sizes.
Acquired in late 2020 after years of being their largest reseller, MSL’s centerpiece offering is point-of-sale (POS) software SwiftPOS which provides an end to end solution for venue operators. The software is fully integrated and covers the whole value chain in operating a venue. The solution manages your inventory, CRM, loyalty programs, check ins etc. When running big events at stadiums and arenas the organisers need a one stop shop platform that can help them shift inventory, staff and decide who gets discounts in a matter of seconds, SwiftPOS does just that. The market for smart stadiums is growing as stadium owners are looking to lift the experience of fans through a fully integrated system that can be accessed online to handle things such as merchandise and parking availability. The solution also collects all the data which can later on be used for analytics to increase efficiencies for the customers.
Source: MSL company filings
OrderMate Acquisition
In October this year MSL acquired OrderMate for $5.5m in cash and $2.0m in MSL shares. To fund the acquisition MSL raised $4.5m from an oversubscribed share purchase plan (SPP) and issued a $4.5m convertible note with a 0% coupon rate to US based Taubman Capital. We will touch on this later. OrderMate provides POS services to Australian food and beverage venues, enabling efficient ordering, transactions and payments to over 2,400 customers. The focus is on restaurant, cafe and fine-dining venues with the business delivering normalised FY21 EBITDA of more than $1m.The acquisition will provide the group with synergies as they leverage sales and marketing channels and costs alongside aligned business development efforts that will help MSL benefit in sales growth by leveraging new sales channels in Australia, UK, US. There will also be efficiencies across combined cloud hosting / service fees.
Source: MSL company filings
In the recent presentation call, CEO Pat Howard noted a few times that the plan is to take OrderMate to the UK, leveraging their extensive reseller network to grow sales. The UK has been out of lockdown for a while now and entertainment/hospitality has been booming, making this a timely opportunity for MSL to enter the market.
OrderMate is fully integrated with over thirty providers. These include payment providers, CRM, accounting software etc; thismakes it more salable and removes the hiccups that businesses may have in integrating the software into their business.
Source: MSL company filings
The team have proven they are more than capable at executing M&A transactions that unlock strategic value for the business, realise operational synergies and create value for shareholders. As mentioned, they acquired SwiftPOS in November 2020. MSL was the largest reseller of SwiftPOS and the acquisition has now become the main focus of the business, seeing a 20+% increase in revenue in FY21 on a like-for like comparison to FY20.
Recently we saw OrderMate partner with Doshii to provide OrderMate venues the ability to connect even more of their hospitality apps. This partnership is the second agreement between Doshii and MSL Solutions after the announcement between Doshii and the MSL owned SwiftPOS in March 2021. An Australian scale-up, Doshii is a middleware platform that enables hospitality venues to seamlessly connect their point-of-sale with a wide range of hospitality apps, including pickup and delivery, in-venue ordering, rostering and reservations apps. Doshii helps venues eliminate double handling of orders, reduce mistakes, and find new opportunities to streamline their operations and increase revenue. The agreement is expected to be worth over $800k over the next five years. This is in addition to $1.3m+ over five years announced in March 2021.
Taubman Capital
As mentioned, MSL issued a convertible note to private equity firm Taubman Capital to raise cash for the OrderMate takeover. Looking deeper into Taubman’s operations and other investments, this is far more significant than first meets the eye. Taubman, a US based PE investment firm, has investments into leisure, venues and hospitality in North America. Over the last 71 years, the Taubman family has built Taubman Centres into a leading global owner and operator of regional and super-regional malls. Taubman Capital’s most recent investment, Venuetize (who have partnered with MSL to target US customers), is an e-commerce platform in the sports and hospitality sector in the US. Spanning nine US sports leagues, this includes customers such as Live! casinos, the PGA Tour, the NBA’s Memphis Grizzlies, MLS’ Los Angeles F.C.. Having Taubman as a shareholder is strategically huge for MSL given that their other portfolio of investments could provide significant material contracts for MSL’s POS systems. MSL’s relationship with Taubman is exactly what they need to strengthen their foothold in the US market.
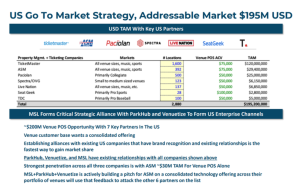
US Opportunity
The US market represents a huge opportunity for MSL to capitalise on. American sports leagues are enormous and have a presence throughout the country both in top tier pro leagues and college sports. MSL’s strategic partnership with ParkHub, a parking management system, and Venuetize makes their overall proposal much stronger as these customers are looking for one system that can do everything. Given the number of venues some of their target customers run, it would only take a few of customer wins to substantially boost their recurring revenue. On the back of their relationship with Taubman alone, MSL should have a good runway to execute on their US growth plans.
Source: MSL company filings
This pipeline above represents real targets that MSL are aiming to convert on in the medium term. Venuetize has a strong relationship with ASM Global, who have 392 locations across the US including the likes of Soldier Field and Barclays Center (in Australia they own major venues like ANZ Stadium, Suncorp, RAC Arena, Qudos Bank Arena etc), which could provide a $30m opportunity for MSL. To put that in perspective, MSL’s FY21 revenue was $25m. A contract of that scale would more than double their revenue.
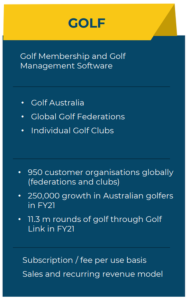
Golf
MSL also provides solutions to golf clubs that help them manage the club and the relationships with members. While this is a smaller part of the business, MSL have secured long term contracts that provide annuity like income with Golf Australia and other federations. The software also collects a lot of useful data about the members and can even tell you their score on the day, something that will become more and more useful as the field of data science grows. Revenue from golf products accounted for 35% of FY21 revenue but this will slowly become less important as SwiftPOS and OrderMate gain scale.
Source: MSL company filings
Outlook
MSL is a business that has made a number of strategic acquisitions and partnerships and is now well set up to take on huge addressable markets. Yet they haven’t received much attention, which is why there is an opportunity for investors. MSL ticks a lot of the boxes for us for in terms of a GARP (growth at a reasonable price) investment. They are currently trading on a market cap of about $100m and have a cash balance of around $8m. Their revenue is mostly sustainable and recurring subscription revenue, a key consideration for our investment process.
Source: MSL company filings
Looking forward, the company is now EBITDA positive and has a huge pipeline ahead of them. The OrderMate acquisition strengthens their POS offering, opens up a big addressable market in the UK and should add over $2bn in annual transaction value. As of right now the business generates most of their revenue from subscriptions fees, in the future we think MSL will look to start generating transactional revenue and, given the group are doing over $7bn of transactional value annually, this represents a huge up side scenario.
Source: MSL company filings
While MSL has integrated with payment providers like Tyro, they are unable to extract value from them. Given the role that payment providers play in POS, we think that MSL will look to do some more M&A in this area and maybe takeover an existing payment provider. There are quite a few payments businesses that have invested a lot of money building the business but have struggled to gain traction and the owners may be looking to exit. A transaction like this would make a lot of sense for MSL.
We also expect MSL to start leveraging the data they are collecting to provide businesses with deep analytical insights to create efficiencies going forward. Whilst payment providers can tell you where consumers are spending money, they can’t tell you exactly what items or products they are spending on whereas MSL’s solutions can; this is far more valuable.
In a November update MSL saw Q1 FY22 revenue of $7.7m (unaudited), an increase of 40+% from Q1 FY21 (prior corresponding period), driven by UK business rebounding post-Covid and the positive contribution of the SwiftPOS acquisition completed in November 2020. MSL’s pipeline should look far bigger in a post lockdown environment. The timing of the OrderMate acquisition has coincided with the NSW and Victoria states emerging from lockdown seeing 85 sales orders closed, making October OrderMate’s highest sales month for 2021.
Finally, the big driver of the business will be expansion into the US. It only takes a few contract wins to add significant revenue to the business given how many sites it could add for SwiftPOS. MSL’s convertible note issue to Taubman, who are now well aligned to support MSL’s growth in the US, gives them a foot in the door and an opportunity to win contracts from Taubman’s other portfolio of companies.
Disclaimer: MSL is currently held in TAMIM portfolios.