This week we look at a contracting company that provides infrastructure services to the energy industry. The company should also be well positioned to benefit from the shift toward clean energy. Contracting companies typically trade at low multiples due to their low margins and cyclicality, the stock we are covering is growing revenues at 25% and is seeing their renewables division doubling YoY.
Quanta Services (PWR.NYSE)
Quanta was founded in 1997. The company is a leading specialised contracting services company, delivering comprehensive infrastructure solutions for the electric power, energy and communications industries. This includes design, installation, repair and maintenance.
With operations throughout the United States, Canada, Latin America, Australia and select other international markets, Quanta has the manpower, resources and expertise to safely complete projects that are local, regional, national or international in scope.
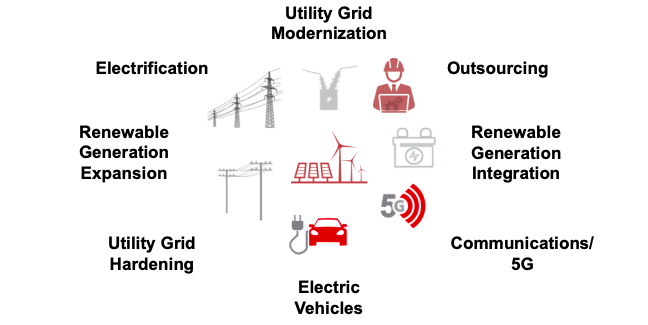
Levered Towards Favourable Long Term Trends
Quanta is well positioned to benefit from the energy transition toward a carbon neutral economy. They offer investors exposure to favourable long-term trends such as utility grid modernisation, system hardening, renewable generation expansion and integration, electric vehicles (EV), electrification and communications/5G.
Source: PWR company filings
Investing in areas that offer exposure to clean energy and the shift towards ESG is a hot theme in markets the world over; many companies are now trading at a premium for their sustainable practices. While you can invest directly in renewable energy and the commodities that will enable them, Quanta offers exposure to the thematic but with less risk. Quanta will see increased work due to the infrastructure required to effectively implement renewables to the grid; Quanta is one of the few companies actually able to physically connect renewable sources and storage to utility buyers. Key to PWR’s growth is the fact that as utilities add intermittent renewables like solar and wind (often in locations that are remote from demand), they need new transmission lines. These are built by Quanta.
Source: PWR company filings
We have begun to see worldwide energy shortages exacerbated by the Russia/Ukraine conflict. However, these shortages were well underway before recent geopolitical events. The shift towards clean energy has led to an underinvestment in fossil fuels essential to bridge the transition period, such as natural gas. We have also seen a number of nations shut down nuclear power plants. In order to keep the lights on, we need to invest in upgrading the infrastructure of our energy grids and in the integration of renewable energy.
US: Bipartisan Infrastructure Spending
As part of a broader $1.2tn infrastructure stimulus package, the Bipartisan Infrastructure Law is aiming to upgrade US infrastructure (in dire need of this) and develop the infrastructure needed for a carbon free economy. The bill will also create plenty of jobs in the US and help stimulate the economy. Quanta should be one of the biggest beneficiaries of this bill as it is targeting areas that Quanta has developed a strong foothold in. The Bipartisan Infrastructure Law includes the largest investment in clean energy transmission and grids in American history. It will upgrade power infrastructure, building thousands of miles of new, resilient transmission lines to facilitate the expansion of renewables and clean energy while lowering costs. The legislation will also invest $7.5bn in building out a national network of EV chargers. Quanta’s management did recently note that the stimulus package will only add to growth and the company was not dependent on the deal, already working on multi year contracts to modernise the energy grid.
Q4 to Full Year Results
Despite the global pandemic, Quanta has continued to deliver for shareholders having delivered four years of record adjusted EBITDA and EPS. Q4 revenues rose nearly +35% to US $3.9bn, Quanta’s renewable energy segment was a key driver in Q4 with revenues up +113%; expected to more than double in FY22. Quanta also saw continued backlog growth driven by record high demand in communications services as a result of 5G build out. While FY21 was a better than expected year for Quanta, it would still have been a tough operating period due the impacts of Covid. With international travel yet to fully recover, labour markets and supply chains have been problematic. The labour shortage impacts contracting companies in particular and we see this as a tailwind heading into a more normalised environment.
Source: PWR company filings
Outlook
On the back of energy transition tailwinds, we continue to see strong earnings and revenue growth for Quanta. Quanta will be a significant player in America’s move towards renewable energy and the utility industry’s heavy spending programs on grid hardening. This exposure to renewable energy goes beyond just solar and wind, also including renewable diesel, hydrogen, and carbon sequestration. In addition, Quanta also participates in the rollout of 5G and in the building of necessary infrastructure for EV charging stations.
Quanta has a diverse but high quality portfolio of clients including American Electric Power, AT&T, Verizon and BP. We are seeing these companies grow their investment in capex and infrastructure. Quanta has one of the best reputations in the industry and has long term relationships with their clients, contributing to repeat work.
Source: PWR company filings
FY22 Guidance
Revenue
$16.25bn
Adjusted EBITDA
$1.64bn
Free Cash Flow
$750m
Net Profit
$567m
Adjusted Diluted EPS
$6.25
If Quanta were to hit the midpoint of their guidance, they will see revenue grow +25%; significant for a company in the contracting industry. A more normalised environment with fewer headwinds on supply of labour will help Quanta’s margins. Contractors are the most impacted by these shortages given their enormous need for labour to carry out projects. PWR’s $6.25 EPS guidance puts them at a PE ratio of 20x; the average PE for the S&P500 is currently approximately 24.5x. Given Quanta’s growth rate and their exposure to renewable energy thematic, it wouldn’t be too farfetched for the stock to trade at a premium.
Disclaimer: PWR.NYSE is currently held in TAMIM portfolios.
This week we would like to look at the commodities market. This is a fascinating topic in a world coming out of a global pandemic, in the midst of a “Green Transition” and tackling exacerbated income inequalities. Toss into this mix the context of Russian sanctions. These sanctions matter and will have outsized impacts given that the country has a GDP about half that of the UK.
At the cost of dragging out the introduction and getting to Russia, we would like to give a little context about the world as it is today. Before proceeding further, credit where it’s due, this examination was inspired by a keynote address at BMO’s 31st Metals & Mining Conference by Canadian Financier Robert Friedland (of Ivanhoe fame). To sum up his key points succinctly, they are:
On Copper – The total amount of Copper mined since the advent of human civilization is around 700 megatonnes (Mt). In order to maintain 3% global growth (target rates), we would need to mine another 700 Mt in the next 22 years… This is without taking into account the Green Transition.
Green Transition – An EV takes around 84kg of copper, or approximately 3.5x that required for a combustion engine. This is what you see on the surface but look further and think around the tremendous pressure on the electricity grid should this transition accelerate. And don’t think just Australia. Think about the 1.4 billion people in China as well as the fast growing middle class of the 1.38 billion in India. This is not taking into account the replacement of the 100 year old transmission capacity in a developed nation such as the US.
The problem with the above scenario? As most will be aware, the commodities market is notoriously cyclical. This makes it excessively difficult to finance and bring additional projects online. Since the last bust in mid 2015, there has been scarce investment made in financing any new exploration or bringing new supply to market. As an example, Rio Tinto (RIO.ASX) has a payout ratio of around 72% with $17bn in dividends paid to investors in 2021 alone. New projects?
We touched on copper and its centrality to EV so far, but what of the hydrogen “alternative”? This requires immense demand for platinum (key). Another key material that has been heavily underexplored and developed.
Policy Missteps – This is one issue that we have been on about for a few years now. To imagine that the largest component of the energy mix across the globe (i.e. hydrocarbons, which includes crude oil, natural gas and coal) can be turned off and simply be transitioned over to wind and solar overnight is/was, in our view, the greatest debacle of the 21st century.
With the above context we turn to the issue of Russia and why it actually matters. Before proceeding further, we understand, energy is one issue that tends to be divisive (despite our view that it is a purely scientific and economic question). Whatever your view may be on the issue of climate change, it is worth noting that this might be the first time in human history that we have intentionally transitioned from a more efficient to a less efficient means of production. Again not we are deliberately not taking a stance, as the technology currently stands it is a reality. Critical components, namely the very building blocks, have been overlooked.
The other point that investors have to consider is that there is very little appetite left for investors to finance new hydrocarbon or oil projects, despite their necessity during the transition period. This does make sense when you consider that many economies are targeting net zero (or at least vast reductions) by the time these projects would finish their life cycles. The most rational decision for existing players given the uncertainty is that they cannibalize existing assets and strip cash flows to distribute to shareholders. In fact, most US shale producers are mandated contractually to distribute cash flows back.
So, why does Russia matter?
It is within the above context that Russia matters. With apologies to any Russians reading, but the easiest way to describe the nation is the petrol station of the world. The nation’s exports since the demise of the Soviet Union (and even preceding that) sit predominantly within the energy sector. The top four export categories by percentage are:
Fuel & Energy – 53.6%
Metals & Metal Products – 11.2%
Chemical Products – 7.6%
Food Products & Raw Materials for their production – 7.2%
The common theme of the above? All four fall squarely in the CPI basket and how it’s measured. Take the EU as an example, close to 30% of her petroleum oil imports come from Russia, also accounting for a staggering 39% of natural gas. The EU was first amongst the world in implementing targets towards net zero while basically crippling drilling and production. This came at the same time as there was pushback against alternative sources such as nuclear production in Germany following Fukushima in 2011. A policy failure that came to the fore in the wake of the Russia-Ukraine conflict. This remains the reason why the Biden administration is finding it difficult to have sanctions include energy. Putting it simply, there is no alternative.
To give a sense of the magnitude of Russian production specifically in relation to energy, the nation accounts for around 10.1m BPD of crude oil and natural gas condensate. The world consumes around 97m BPD of crude. Push this mode of sanction too far and the globe risks taking away approximately 10% of her energy supply. The US, while producing 11.1m BPD, still remains a net importer of the black gold. The end result, given the centrality of the crude to the global economy, is that it adds substantial inflationary pressures to the global economy while providing big risks in terms of what is already turning out to be a fragile recovery.
We found it almost beyond belief that policy makers failed to understand the nature of the energy transition. It is not an overnight effort to switch energy sources after all. While the EU’s move towards the green transition is commendable, to rely on one source for a third of her energy mix baffles to say the least. Regardless of your stance on climate change, relying on a nation ruled by a man that has consistently taken a rather adversarial approach for that much of your energy is perhaps an equally egregious policy failure. The latest fiasco has at least moved several governments to reconsider nuclear within the energy mix it seems.
Starting with the price of crude, we move to the other categories that are of particular concern. Take the last time we had a substantial rise in the food price index (FPI) for example. Many may still have memories of the 2007-2008 world food price crisis, which also happened to be the last time spot prices for Brent hit the triple digits. The root causes of that particular crisis were a confluence of factors including the use of arable land for the production of biofuels (substitution effect), costs of fertiliser (directly related to oil) and costs of transportation. The massive fall in demand as a result of the GFC was the factor that eventually led to stabilisation, though problems arose later in 2011-2012. The political and economic instability that followed cannot be understated.
Moving to metals and metal products. Russia, as an example, produces for a third of the globe’s supply of nickel (an essential component of lithium-ion batteries). It is also the eighth largest producer of copper and the largest producer of palladium (an essential component of chip manufacture). Again, a policy failure of note. Let us assume that governments wish to speed up the process of the energy transition, copper as it currently stands is vastly underproduced for status quo demand (as mentioned above). We are essentially seeking to take out the eighth largest player, accounting for around 820 metric tonnes, while trying to build out wind and solar alternatives which require precisely those materials at the same time.
Aside from the green transition and the bottlenecks that may have resulted for the more short term oriented, as it pertains to the second category of metals and mining, palladium is the more important to remember. Global supply chains are already stretched (Covid-19 related) when it comes to chip manufacture, now take out the supply of an essential component. Importantly, this effectively freezes up production of automobiles, another component of CPI.
We already touched on the impact that higher oil prices may have on food prices but, as if that weren’t enough, some may be surprised to learn that Ukraine and Russia account for about a third of global wheat production, 19% of corn and a staggering 80% of sunflower oil. Again, think through the impact upon this for importers such as India, China and the rest of emerging Asia. These economies are the drivers of growth for the foreseeable future. The direct results, of course, will once again be upon CPI.
What’s the takeaway?
Firstly, one can very reasonably ask the question why a nation with such abundant resources key to global supply chains remains an economy with half the GDP of the UK? And, by extension, what the massive stores of wealth built up by the oligarchs actually implies about the sheer scale of the outright loot. But let’s move on from that and focus on the implications for us investors.
At the time of writing, the Fed has not released its announcement. We would suggest that monetary policy makers will find the current situation exceedingly difficult especially within the context of a global supply chain already stretched to the limit. We would guess a 25bps hike with more through the year. The irony of this is that raising rates slightly (as mentioned in our previous article) might actually be inflationary. Consider the amount of debt for higher cost shale producers in the Permian. Energy companies, including the likes of Exxon (XOM.NYSE) and Chevron (CVX.NYSE), are back in the limelight (perhaps for the right reasons for once?). There will need to be a drastic rethink of the fragility of global supply chains and overreliance on particular nations/economies for critical components; something that has already begun with incentives for rare earths manufacturing capacity in the US. We would also make the call (and assuming monetary policy makers are reasonable) that as long as growth stays at reasonable levels, this particular conflict may have just manufactured an imperative for speeding up the process of looking for alternatives.
On that final point and in order to make it clear, should oil continue on its upward trajectory (which we do expect), there is a turning point; something in economics termed demand destruction. That is, the market speeds up the process of actively looking for alternatives. The irony perhaps being that it could very well make the economics of renewables much more attractive, though it has not been talked about. The administration Stateside and in the EU may now seek to incentivise new exploration but we somehow doubt that energy majors are going to bring on new supply or additional production (it must be remembered these projects are high CAPEX and long payoffs). It would be much more rational for management to continue distributing cash flow to shareholders as opposed to new production. While the price may be attractive at the moment, there is too great a degree of uncertainty around how much longer the industry lasts. This is one policy misstep by the West that consumers are likely to pay for, for a long time yet.
On the point of monetary policy, we remain of the view that policy makers are caught between a rock and hard place. The rhetoric will be substantively different from policy outcomes. One cannot see any other outcome but to keep nominal rates below inflation. We find it rather hard to believe that perfectly rational and respectable investors are calling for 5-8 rate hikes. Yes, it is true that if one were just focused on inflation it would be what is required but consider the interest burden for local and state governments Stateside or even at home? We neither have the demographics nor the scaffolding of Volcker. That said, we are not making the call of seeing the 70s again given demographics. Oversimplifying the issue (a proper explanation is an article in its own right) but suffice it say, an ageing demographic acts as a counter to an inflation. That and the sheer amount of household wealth tied to the property sector in Australia, which believe it or not, does matter substantively (despite rhetoric).
Finally, to the question of a secular bull cycle in commodities? We stated that this would be the case before this latest crisis. It may have just put the foot on the gas pedal and sped it up though!
This week Ron Shamgar takes a look at an expanding healthcare services company that has traded well despite a tough operating period; a stock that could also potentially be interesting from an M&A perspective.
Monash IVF Group (MVF.ASX)
MVF is a leader in the field of human fertility services and is one of the leading providers of Assisted Reproductive Services (ARS) which is the most significant component of fertility care in Australia and Malaysia. ARS encompasses a range of techniques used to assist patients experiencing fertility issues to achieve a clinical pregnancy. In addition, MVF is a significant provider of specialist women’s imaging services
Source: MVF company filings
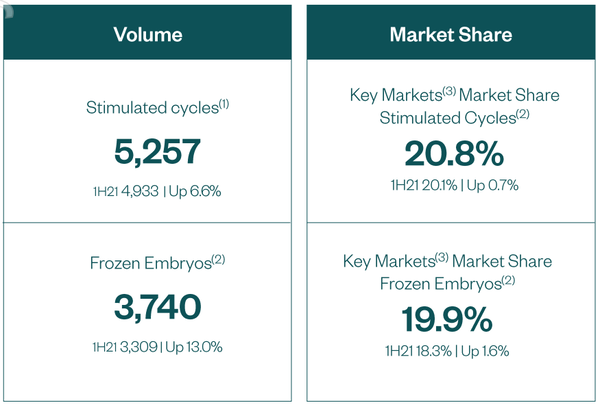
MVF has clinics in Australia and is expanding internationally through their Southeast Asia strategy. MVF have approximately 20% of the market share in Australia. They have seen continued growth in their cycles, up +6.6% on previous comparable period (pcp). MVF’s first half results were solid given some of the impacts they would have experienced due to Covid-19. The biggest impacts were on their ultrasound businesses along with their clinic in Kuala Lumpur which was affected by movement control orders. It’s also worth noting that MVF saw significant growth in H1FY21, maintaining those levels despite a tough operating period is what investors should be looking at. January would have been a slow month for MVF due to Omicron but we expect that cycles should stabilise from here as they operate in a normalising environment. These patients aren’t going anywhere, it just boosts pent up demand. Malaysia saw a recovery in Q2 with +15% growth in revenue, we expect this recovery to continue into the second half.
Source: MVF company filings
They have a great brand, are increasing pregnancies in a mature market, building their scientific capability and will continue to attract specialists. In the half, MVF attracted four new experienced domestic fertility specialists. It is important that MVF continue to invest in their scientific capabilities to continue attracting talent for expansion which will grow volumes in turn.
MVF will be opening clinics in Penrith and Darwin this half while also launching clinics in Singapore and Bali, which should add 300 cycles p.a over the next few years. Their Kuala Lumpur clinic was doing 1,000 cycles pre-Covid so Southeast Asia should be doing over 1,400 cycles p.a. in FY23. Given that MVF did 5,257 cycles in the first half, their Asia operations will form a material piece of the business. MVF will continue to look for partnerships in Southeast Asia as well as explore M&A if the right opportunity presents itself.
MVF are launching testing kits which will help people assess their fertility. They expect to be distributing 100 kits a month. The biggest benefit of this will be that the obvious choice for people that come up as at risk using the test kit will be to use MVF. They think that this could account for 10% of their volume in the next five years.
Takeover Activity
Fellow listed peer Virtus Health (VRT.ASX) received its first takeover bid from BGH Capital at $7.10 a share in December last year. The latest offer, from CapVest, was $7.70 a share. VRT operates in Australia, UK, Denmark and Singapore. We believe that VRT’s stronger international presence is what saw them receive takeover bids over the likes of MVF. MVF is the smaller of the two and has half the market share in Australia, nonetheless, MVF is working on their international expansion and we think they could be heading down a similar path.
The latest takeover bid for VRT values them at approximately 12.4x EV/EBITDA, making MVF look cheap given that they are currently trading around 8x EV/EBITDA. If MVF were to trade at the same multiple as VRT they would be sitting at a share price of $1.68 (based on FY22 EBITDA of $52.7m), a ~30% premium from the current share price.
Outlook
When looking at companies we also like to try to examine them through the lens of a potential acquirer. That is, what would someone else pay for this company? The recent bids for VRT show that there is interest in the IVF industry from private equity players. It also tells us that the multiple they are willing to pay is far above what MVF is trading at. MVF has a strong foothold in Australia (20% market share is nothing to sneeze at) and are building out their international presence so we wouldn’t be surprised to see MVF receive a takeover offer at some stage. Looking into the second half, MVF has seen an +11% increase in new patient sign ups domestically and has a strong pipeline of returning patients. The industry has also seen increased government support and they anticipate further government funding which improves affordability for patients, one of the biggest constraints of IVF treatment.
Disclaimer: MVF is currently held in TAMIM portfolios.
This week we continue with our examination of the news flow that has been rocking markets. We find it interesting that the headlines have inextricably linked the latest burst in inflation and energy prices squarely with the Russia-Ukraine escalation story. However, for those of you that have been long-term readers, you may remember that we had previously made the call for triple digit oil prices even before the Putin-made fiasco. The latest round of sanctions may have only sped up the process. Similarly, we made the call that higher inflation numbers were likely to be printed due to the fiscal impetus and the nature of the responses to Covid-19. Alongside this, we posited that central banks may find it more difficult to normalise policy than the markets may be expecting.
So with that, let us get into what we see as likely outcomes for the markets going forward. Starting off with energy.
Energy
Despite jawboning from the US government, led by Biden announcing the release of 30 million barrels from the Strategic Petroleum Reserve (SPR) at the State of the Union address, the upward momentum seems relentless; Brent hitting 130 USD/Bpb and WTI reaching a 125 USD/Bpb. This move, in our view, is rather short-sighted and does not address any of the underlying issues at hand while acting as a reprieve in the run up to the November midterms. The rhetoric by governments across the world, including Asia, has been similar. While the short-term price action may be a little overdone given that the US only imports approximately 700,000 barrels of Russian oil per day and the EU continues to import (30% of her consumption coming from Russia). We are seeing credible supply constraints, something we suggested was likely to be the case given the lack of appetite for investment in new supply.
In a perverse manner, should central banks take a more hawkish approach to tackling inflation, this may get worse. The US shale boom has ultimately been financed via cheap credit from the Federal Reserve rather than technological breakthrough. Turn off the taps and you have a spate of bankruptcies. However, one alternative that is now being talked about is rethinking sanctions on Venezuela and speeding up the Iran nuclear deal which, it is assumed, should bring on additional supply. The impact of this, however, remains up for debate. It is entirely plausible that Iranian supply is already online (i.e. it is simply a paper trick that roundtrips it through Iraq, making it look like Iraqi exports). Venezuela, on the other hand, still has to build out her infrastructure after years of disuse and disrepair. But what of OPEC and specifically the Saudis?
We don’t see the Saudis reneging on commitments made during the OPEC summit as pertaining to production targets. As mentioned previously, the Budgetary Breakeven price per barrel for the Kingdom (i.e. the price needed to bring about a balanced budget) is 80 USD/Barrell. We see it as likely that the Kingdom will use the current prices to rebalance the budget.
So, where to next for the black gold and what are the implications?
Higher highs are likely with a base case (for us) now at 150 USD for Brent. This is in spite of optimistic scenarios bringing Iran and Venezuela online. This has tremendous implications for a market (still recovering from a pandemic) and global growth.
Specific Implications
We see immensely consequential implications for global growth and inflation going forward. The last time we had a similar environment were the years between the invasion of Iraq and pre-GFC. The Reserve Bank of India, for example, estimates that for every 10 USD rise in the spot price of Brent, 0.5% is added to CPI in that country. We would posit a similar case for China and much of emerging Asia, which remain net importers of energy. A slowdown in growth across these engines will irrevocably impact global growth prospects.
For the equities investor however, the implications are a little more uncertain. Remember that the mechanism through which valuations are impacted, all things equal in the short run, is monetary policy. In the past, one might have had a great degree of certainty that growth would take precedence over inflation thus resulting in what maybe credibly termed a central bank put. The indication so far has been a little more concerning. The Federal Reserve maybe forced to raise the economy into recession (a rather small risk but now within the realm of possibility). As we mentioned, easing in would in fact have the opposite effect with supply constraints further exacerbated. If inflation is the biggest issue, there is simply no other way but to ensure an adequate fall in demand. Anything less and stagflation may ensue. On the other hand, and this continues to be the base case, Russia-Ukraine could very well be used as an excuse to take a more dovish tone.
Closer to home, we are of the view that Australian investors and the economy may be in a better place than would otherwise be the case. Inflation transmission occurs quite differently here. It must be remembered that this remains a commodities driven economy and one that is a net exporter of energy. This has two consequences; the first is that higher commodities prices globally, while creating inflationary pressures, are (at least relatively) felt less domestically; and two, this gives the RBA a lot more room and flexibility.
Let’s untangle the above sentence. Consider the nature of our exports and imports. Higher commodities prices inevitably become a positive for the nation’s balance of payments and put upward pressure on the AUD (than would otherwise be the case when comparing relative cash rates). The higher currency increases purchasing power and many of the imports that make up the CPI basket. That’s not to say we won’t have inflation, only that it would be less on a comparative basis. This in turn allows the RBA to remain dovish compared to her peers (good news for those of you that are property investors perhaps).
Where to allocate?
Let’s begin with where we don’t want to allocate. The immediate thought that crosses our mind is traditional fixed income. Why? For one, lets assume our most likely scenario that central banks continue to prioritise growth even at the cost of what they may call transitory inflation. In this instance, it could very well be that the coupon value turns negative in real terms as inflation is exacerbated. On the other hand, let’s assume that they do take an aggressive stance on inflation at the cost of growth, the rise in credit risk given the quality of issuance in the decade and a half since GFC makes us rather cynical of the risk-reward payoff.
Similarly, the higher PE stocks are not necessarily the place to be. This is not to say, they aren’t quality companies or that they don’t have secular growth stories. But buying what are effectively long-duration assets in a rising interest rate environment is not for the faint of heart.
So, where to allocate? Equities remain the place to be. Our base case of preferencing growth over inflation implies that cash will be negative yielding in real terms. What do we mean by this? Let’s say inflation stays around 4-5% p.a. and the cash rate, from its historic lows, normalises to 3% over the twelve months (a rather aggressive scenario), cash holders still lose 1-2% p.a. in real terms.
Companies with reasonable valuations and earnings effectively indexed to inflation are, in our view, the best place to be. Within the Australian equities portfolios we continue to own the likes of EML Payments (EML.ASX) and OFX (OFX.ASX). Globally, companies like J&J (JNJ.NYSE) and Home Depot (HD.NYSE) remain high conviction.
With reporting season now over, investors can take the time to review the results. Stocks will often take time to rerate after the release of a good result as they can get lost amongst hundreds of others. This week we will talk about IGL’s results and why we believe it was one of the best on the ASX. We will also dive into CAJ’s results and look at why they should do better in a normalised environment.
Author: Ron Shamgar
IVE Group (IGL.ASX)
IVE Group is a provider of print communications and marketing services. The company operates through the following four creative services: visual, motion, digital, personalised and structural (3D). Their operations include printing of catalogues, magazines, marketing and corporate communications materials and stationery as well as the manufacturing of point of sale display material and large format banners for retail applications.
Results
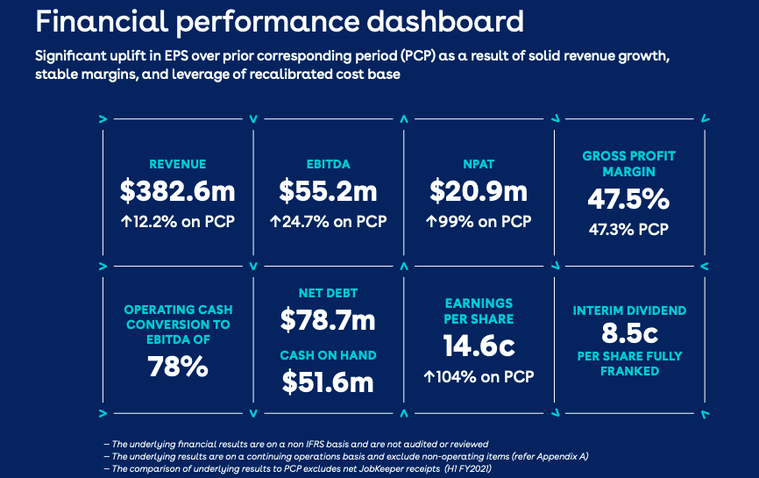
IVE reported great H1 results, arguably one of the best of the half year. Revenue climbed +12.2% to $382.6m while EBITDA rose +24.7% to $55.2m. IVE showed how stable their client base was and mitigated Covid issues extremely well. In some instances they even benefited; they saw a few clients come onboard as a result of looking to onshore manufacturing due to global supply chain issues for example. IVE also completed a few acquisitions in the half to expand their retail segment. We are expecting more to come.
IVE also announced an 8.5c dividend which puts them in the top quartile for dividend yields on the ASX. When asked whether they could maintain this, management were confident from an EPS perspective and we see no reason why they can’t.
Source: IGL company filings
Outlook
IVE has a strong balance sheet with $50m of cash and is sitting on a low leverage ratio, currently sitting at 1x but their target is 1.5x. This gives them a lot of room to execute on their M&A strategy. IVE is looking for an acquisition in the fibre packaging space and will be looking for bolt on acquisitions. They also will be investing in their Lasoo acquisition which will improve customer experience.
IVE will still need to mitigate supply chain issues and potential inflation but they have done a great job so far and, given how strong their relationships are with suppliers, purse rises will be harder to pass on to IVE. Their full year guidance is for $34m NPAT and $95.5m EBITDA, this puts IVE at an EV/EBITDA of approximately 4x, far too cheap for a company performing this well.
Capitol Health (CAJ.ASX)
Capitol Health is a leading provider of diagnostic imaging and related services to the Australian healthcare market. Headquartered in Melbourne, the company owns and operates 63 clinics throughout Victoria, Tasmania, South Australia, and Western Australia. CAJ’s operational focus is on delivering a community-based infrastructure for radiologists and related medical practitioners to deliver optimal, efficient, accurate healthcare service outcomes for patients.
Results
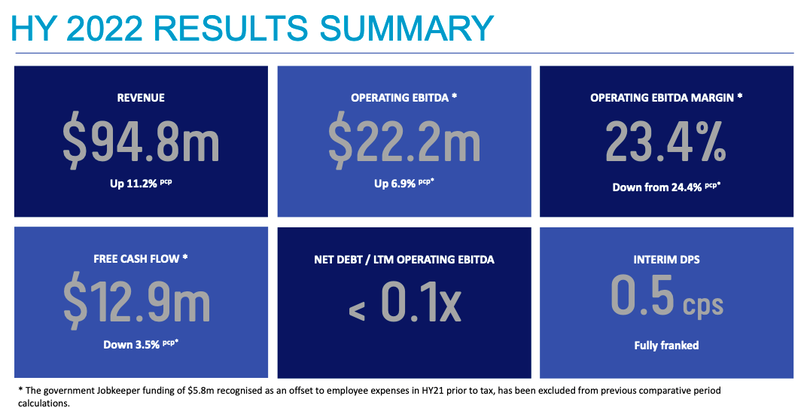
The half would have been an extremely tough one for CAJ and they were impacted heavily from the lockdowns, especially given their huge presence in Victoria. The biggest issue was staff shortages which hurt margins and volume. Even with the impacts, CAJ saw their revenue grow +11.2% to $94.8m with EBITDA up +6.9% to $22.2m. CAJ also declared a 0.5c fully franked dividend which put them at a dividend yield of 2.85%. These results look great when compared to listed peer IDX, who saw their EBITDA decline by -7.1% and their revenue up only +5.7%.
Source: CAJ company filings
Outlook
CAJ has already seen a bounce back post lockdowns and there is plenty of pent up demand. People still need diagnostic services; the revenue was just being delayed. CAJ has 2 new greenfield clinics opening this half but it takes a few years for them to be EBITDA positive. They will continue with their M&A strategy but their pipeline has slowed down. The 2H will be a much easier one for CAJ and they will realise the pent up demand and should see their staffing problems disappear.
The sector has been consolidating with several deals coming through recently. This includes the likes of Sonic Healthcare (SHL.ASX) buying Canberra Imaging Group at approximately 9x EBITDA, Quadrant selling Qscan to Infratil (IFT.ASX & .NZ) and a few other deals. We believe CAJ is a strong candidate as a takeover target and is trading at an EV/EBITDA of around 10x, an opportune time for acquirers.
Disclaimer: Both IGL and CAJ are currently held in TAMIM portfolios.