This week we review the recent influx of economic news and the implications for future monetary policy by the RBA.
Last week’s release of the June Consumer Price Index (CPI) told the market what it already knew: everything is more expensive. Headline inflation came in at 6.1%, the highest recording since the introduction of the GST in 2000. Trimmed inflation, which removes big price swings, hit 4.9%. The headline number was below economist expectations of 6.3%, but the underlying was above the expected 4.7%.
The major causes are well known but not easily fixed. Labour shortages have been exacerbated by two years of limited migration. Ongoing logistic constraints won’t be fully resolved until China ditches its zero tolerance to COVID-19 or Russia halts its invasion of Ukraine. Soaring commodity prices and abnormal weather are impacting input costs, which are subsequently passed on to consumers
Subsequently, fruit and Vegetables are up 7.3%. New housing for owner-occupiers increased by 5.4%. Small and large household appliances were up 7.1% and 5.7% respectively. Even the temporary six-month excise cut of 22 cents at the bowser couldn’t alleviate fuel pressures, increasing for the eighth consecutive quarter.
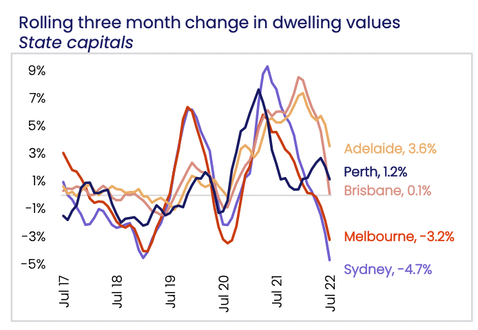
The weekly budget isn’t the only line item feeling the heat. Most superannuation account balances fell in the 2022 financial year, with just three MySuper products achieving positive returns. House prices are also beginning to roll over. Melbourne and Sydney are already contracting. Other capital cities are experiencing slowing growth.
Source: Corelogic
In summary, households have less money in their pocket and are less wealthy. The positive news is that there are signs of inflation pressures abating. Wholesale petrol prices are down 20%. Food and energy prices are retracing. Chip shortages and shipping rates are easing, albeit remain well above pre-pandemic levels. Purchasing Manager’s Indexes – a measure of economic activity – are retracing as corporates become more cautious.
US Fed alleviates market uncertainty
The CPI release wasn’t the only big economic news last week. The US Federal Reserve increased rates by 75 basis points last Thursday night to bring its benchmark rate to 2.25% – 2.50%. The Central bank has now raised rates by 225 basis points in just four months, demonstrating its commitment to bring down inflation. Again, the number was in line with economic forecasts. But what really caught markets attention was Chairman Jerome Powell’s shift in rhetoric.
He acknowledged current monetary policy is now at a neutral rate, i.e. neither stimulatory nor contractionary. Some further tightening will be required, citing prior Fed forecasts of 3.25% to 3.50% as an estimate, but also stating that the policy would be decided on a “meeting by meeting basis”.
Why is this important? Powell is giving certainty to the markets. The rapid increases are in the rear view mirror and the Fed will be more deliberate with its cash rate moves. Subsequently, the Nasdaq rallied +4.26% and the S&P/500 added +2.62%. Powell also toed the line that a recession is avoidable while acknowledging some pain will need to be felt:
“We need a period of growth below potential in order to create some slack so the supply side can catch up. We also think that there will be in all likelihood some softening in the labour market conditions, and these are things that we expect and we think are necessary to get inflation on a path back down to 2%”
Powell’s words rang true just 24 hours later when the US recorded its second consecutive quarterly decline in GDP growth and entered a technical recession.
The Fed faces a delicate balancing act. The more it wants to guarantee inflation is squashed, the further it will need to push the economy into a downturn. Fortunately, the economy is entering the recession from a position of strength with a strong US dollar and unemployment at just 3.6%.
The RBA blinks
With domestic inflation data and the Fed’s latest decision, it was time for the Reserve Bank of Australia (RBA) to step up. On Tuesday, Governor Philip Lowe announced a third consecutive 50 basis point increase, taking the cash rate to 1.85%. Just three months ago the cash rate was 0.10%. Similarly, none of this was very surprising. But like the Fed, there was a shift in attitude from the RBA.
Powell’s comments on reaching neutrality afforded Lowe the opportunity to slow the pace and severity of rate increases. And he took it with both hands. In the RBA’s monetary policy statement, the addition of two new lines demonstrates a more measured approach to future increases:
“The Board places a high priority on the return of inflation to the 2–3 per cent range over time, while keeping the economy on an even keel”.
“The Board expects to take further steps in the process of normalising monetary conditions over the months ahead, but it is not on a pre-set path”.
Most will interpret Lowe’s words as dovish. The RBA indirectly acknowledged the pain households and businesses are facing evident in the June CPI and highlighted it will balance both the economic and inflation considerations.
But what it implicitly says is that the economy is not as strong as once thought. The RBA downgraded its economic growth forecasts and also forecasted unemployment would rise. There was also no mention of the speech Deputy Governor Michele Bullock delivered just two weeks ago, that the vast majority of households can cope with 300 basis points worth of increases.
There is also a lot of scepticism around the RBA’s forecasts. Inflation is expected to peak at 7.75% before returning to 4% in 2023 and 3% in 2024. But we know inflation usually takes months if not years to flow through as fixed contracts roll over and businesses reset prices. After it backtracked on its own forecast that rates wouldn’t rise until 2024, how can one be sure the RBA has got it right this time?
To make sure households are able to cope with elevated inflation and rate rises, the RBA will be more measured and likely move in 25 basis point increments going forward. It could even pause towards the end of the year to evaluate how households are coping. This news will likely be a much needed reprieve for mortgage and asset owners. But it also signals that, should inflation linger for longer than expected, Australia will almost certainly experience an economic downturn as the RBA is forced to extinguish inflation.
This week we take a look at central bank guidance. What does it actually mean and what’s the point?
What is it good for?
Those of you of a certain age will know the next line from Edwin Starr’s 1970 hit song is “absolutely nothing!” He was talking about something far more serious, war. Nonetheless, the same sentiment is permeating markets after the recent performance of central banks.Let’s take a step back and look at what central bank forward guidance is and when it started. The Reserve Bank of Australia (RBA) defines forward guidance as “the central bank’s communication of the stance of monetary policy”. In layman’s terms, it is the RBA setting expectations as to its likely course of action regarding interest rates, through communication by its employees via speeches, interviews and other media engagements. If you recall hearing interest rates were not likely to rise until 2024 and are less than impressed by the rising cost of your mortgage in 2022; no, you didn’t imagine that. We will come back to that.
Forward guidance is considered an unconventional monetary policy tool and gained in popularity, following the Global Financial Crisis (GFC), from 2009. Many central banks had slashed interest rates to zero and were looking for other ways to stimulate their economies and provide confidence to markets, investors and consumers.
The aim of this is to influence the financial decisions of households, businesses, and investors by providing a guide for the expected path of interest rates. In the case of the post GFC period this was intended to spur economic activity and assuage fears of interest rates rises in the near future.
Forward guidance attempts to prevent surprises that might disrupt the markets and cause significant fluctuations in asset prices. This brings us to the most recent crisis which was cause by the outbreak of COVID-19. The RBA cut the cash rate, from 0.75% at the start of 2020, to 0.1%. With interest rates at zero and still seeking to provide stimulus it deployed unconventional monetary policies including asset purchases; the term funding facility and of course forward guidance.
Specifically, the RBA, through Governor Philip Lowe, began communicating that they did not foresee raising rates until 2024 at the earliest. This communication continued through 2021 and had the desired effect, keeping consumer spending strong and spurring lending which in turn translated to an increase in house prices.
As 2021 wore on the RBA’s communication began to be at odds with market expectations which began to forecast interest rate rises initially in 2023 and eventually 2022. In a speech to the Anika Foundation on Tuesday the 14th of September 2021 Governor Lowe lamented “I find it difficult to understand why rate rises are being priced in next year or early 2023”. As late as the 16th of November 2021 he remarked at a business event that “It is still plausible that the first increase in the cash rate will not be before 2024”.
Australia subsequently joined the rest of the world on the inflation freight train and, in a somewhat embarrassing turn of events, the RBA began lifting the cash rate rapidly. First on the 4th of May 2022 with a 0.25% hike followed by 0.50% on 8 June 2022; 0.50% on 6 July and another 0.50% earlier this week to take the cash rate to 1.85%. How many borrowed based on the notion of flat rates to 2024? How many spurned historically low 2-year and 3-year fixed mortgage rates under the assumption rates weren’t going to rise anyway?
We discussed earlier how one of the goals of forward guidance is to elicit activity without actually moving interest rates. This worked but the Governor admitted in May 2022 that holding the 2024 commitment as long as the RBA did was an “embarrassing error” and that the bank “should have done better”. As a consequence, the RBA will conduct a review into the forward guidance used during the pandemic period and publish the results later in 2022.
So, central bank forward guidance. What is it good for? As it turns out, a lot. Studies have shown the effect to varying degrees but it certainly exists. As the saying goes “with great power comes great responsibility” and central banks must wield their forward guidance responsibly to ensure they don’t cause what they are trying to prevent which is surprise to markets and consumers. Many Australians are contending with higher rates and mortgage repayments much sooner than they anticipated which is causing significant distress for some. The RBA will say it never “promised” but members of the public can’t really be expected to be fluent in central bank speak. In that context, perhaps a little more than an embarrassing error.
This week we visit a topic that has been persistent in recent headlines: coal. In doing this we will look at two large-caps that have delivered a seemingly extraordinary return in this bear market.
As always we begin with context.
Context
The story of coal is, as with all things this year, one of supply. The Russia-Ukraine war stands front and centre of recent price action, Newcastle coal futures climbing from circa. 151 USD/T to 385 USD/T now. So, what gives?
There are a litany of factors currently affecting the spot price of coal. As Russia is one of the world’s leading coal producers, the sanctions stemming from their invasion of Ukraine are definitely making their mark. But many may be unaware of the fact that, since the beginning of the crisis, Russian oil and coal revenues have both actually increased this year. Big net buyers, including India and China, have left no stone unturned in trying to obtain discounted crude and coal direct from the source (this discount still being a premia to the price at the beginning of the year). Given the assumption that Russian coal remains online, can we then conclude that the price action is overdone?
This is a little more complex. As usual, future expectations are also priced in. Longer-term, the global market is dealing with both the disentanglement of supply (i.e. as Germany is doing to avoid reliance on unstable players like Russia) and a broader shift in the energy mix resulting from the ongoing Green transition. In the medium term, price action may also be exacerbated as China comes out of lockdown, creating buying pressure. Short term, Europe is simply going into winter. These are just a few examples of the types of expectations affecting prices right now.
While the price action may very well be overdone right now there is every reason to believe that, after years of underinvestment and rising energy demand, we could have higher spot prices for longer. Where does that leave pricing? Our call is an average of 280-320 USD/T over the next two to three years before gradual declines over the following three. In doing so we make the following assumptions however:
Indonesian and Columbian production takes over the slack in Russian production. This could make up for around 70% of the Russian losses (i.e. substantially lower grade and energy content in both of these jurisdictions to recoup loss in absolute terms).
Russian losses are somewhat minimised as sanctions mature.
There is a ramp up of domestic Chinese production.
Take away any of these assumptions and the situation changes though. So, now that we’ve made a call on the spot price, let’s look to two securities that could be significant beneficiaries.
Whitehaven Coal (WHC.ASX)
This year, Whitehaven has actually been a pleasant investment for its long-suffering shareholders. The business has bought back around $70m of stock and paid out a further $80m in dividends. Even after this the business still sits on close to $161m in net cash. If those numbers aren’t enough, this implies $2.4bn in FCF for the year. What’s interesting about the latest set of results is that the realised price for the June Quarter was 229 USD/T, a substantial 18% discount to the average spot price over the same period. With FY22 guidance around production largely unchanged at 19-20.5 Mt (having now increased by 60%) on a ROM (Run-of-Mine) basis, we continue to see this business as substantially undervalued. This is even assuming shorter term gyrations in the spot price (though the price of the security may continue to closely track it in the short run).
On the flipside, costs driven by labour shortages and rising diesel costs continue to pose a threat. Current unit guidance ranges from $79-84 AUD/T. However, using our average price target for thermal over the medium term, we feel that FCF should more than offset any rises. At the current price of $4.91, this implies that the business trades at approximately a 40% FCF yield while the dividend yield of around 12% p.a. (again, assuming our base case for spot prices). Going to the actual valuation, it stands at an attractive 11% discount to NAV (which we estimate to be around $5.50 AUD).
To sum up, this is a capital return story and we expect a continuation of the strong share buyback and dividend program.
Note on the Queensland royalties: Many maybe aware of the new slate of royalties levied by the Queensland Government on coal. These were previously frozen for ten years. The new tiers (effective from 1 July) include an incremental rate of 20% for the value realized above A$175/t, 30% above A$225/t and 40% above A$300/t. This was previously capped out at 15% of realised value above A$150/t. Whitehaven’s primary exposure comes via the slated Winchester South Development which will not be online till 2026. While this does pose a potential longer term risk in terms of the actual profitability of the project, it is something to be monitored but a lot can change in four years.
Opinion on the Queensland royalties? Smart to take advantage of elevated prices but significantly hampers the overall sector in preference for less costly jurisdictions unless other states follow suit (mainly referring to NSW here).
New Hope Corporation (NHC.ASX)
New Hope is another security that has seemingly benefitted from the rise in spot prices. With production continuing to ramp up, especially with New Acland Mine (QLD) beating even the most optimistic estimates while NHC’s Bengalla (NSW) interest remained in line with expectations despite suffering substantially from wet weather.
Nevertheless, we feel that the business has continued to face significant headwinds from the external policy environment though the New Acland Stage 3 win at the Land Court offered some reprieve. Looking to the numbers, underlying EBITDA came in A$553m for 1H. Contract lags with South Korea, Taiwan and lower priced domestic contracts (which account for 3-5% of Bengalla sales) have proven to be hurdles. Add to this the royalty hikes, which put the company in the line of fire, and it appears to be less attractive than Whitehaven. Not to mention, from a valuation perspective, it trades at 1.1x NAV (i.e. compared to WHC trading at a discount).
Using our base case for spot prices and even accounting for the increase in royalty, we can still assume a forward dividend yield of approximately 10%. Thus, the company remains a reasonably attractive proposition. That said, this may be significantly dented by management’s stated M&A driven outlook. This is not perhaps as great a capital return story for the yield hungry investor.
Disclaimer: Both Whitehaven (WHC.ASX) and New Hope (NHC.ASX) are currently owned in TAMIM portfolios.
Attempting to time the market perfectly is typically a fools game. That said, it can certainly help to know what to look for when trying to identify the bottom. So, what signs are we looking for?
From March 2020 to mid-2021, Australian investors were treated to an impressive rally of almost 60% following the market’s COVID-lows.
So far, 2022 has proved far less generous with the S&P/ASX All Ords falling by as much as 15% since peaking in August last year.
However, last week felt like 2020 all over again – not just because the virus is ramping back up with talks of returning to mask mandates and the like, but because of all the green in the market. The ASX recorded its strongest week in four months, led by the banks, miners and tech stocks.
The question now is whether we’ve seen the bottom of the market, or is this just a bear market rally with further pain ahead?
No one knows for certain what lies ahead, but there are a number of factors that might just provide us with a clue of what’s to come. So, here are some things to look for that might signal that fear has peaked and the market has bottomed.
Peaking interest rates
Historically, markets don’t tend to bottom until interest rates stop rising and central banks adopt more dovish monetary policy.
At its July meeting, the RBA lifted the cash rate for the third consecutive month. It now sits at 1.35% after rising from an all-time low of 0.1%. The RBA meets again on Tuesday and another rise is widely expected.
The RBA has said that further steps to normalise monetary conditions in Australia would be taken over the months ahead. They believe that the current rate remains too low, particularly considering that inflation remains unacceptably high and the unemployment rate is at fifty year lows.
If inflation does moderate and interest rates are increased only modestly, the market may soon recover. But if inflation remains high, the RBA may have to keep raising rates (making a recession possibly unavoidable) and the sharemarket will remain volatile.
Based on current RBA predictions, the cash rate is expected to reach a peak of around 2.5%, with inflation expected to reach around 7% by the end of year and not fall until early in 2023.
The market is forward looking and has priced this information in already. The risk lies in whether inflation continues to increase unabated or if the RBA makes a policy error by hiking rates too high despite inflation pressures having abated. This leads us to our next point.
Market capitulation & extreme fear
One sign that the bottom is near would be market capitulation – the point at which extreme fear enters the market and investors give up on trying to recapture lost gains from falling stock prices. At this point markets tend bottom out and subsequently recover once there is no longer fear.
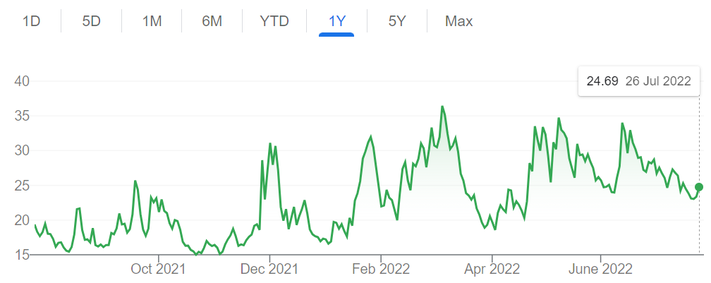
This can be seen by a spike in the VIX or “fear index”, which measures the expected volatility of the US stock market over the coming thirty days. When the market capitulates there will be a corresponding spike in the VIX.
Source: Google Finance
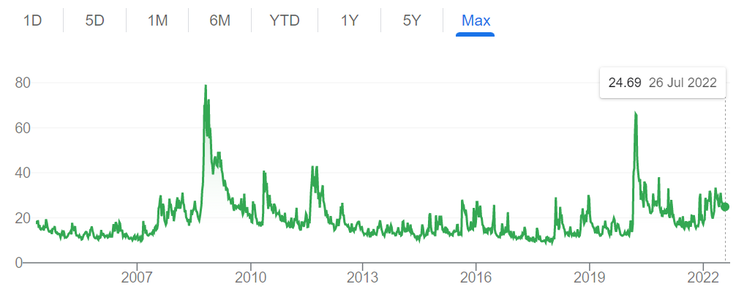
Currently, the VIX is elevated but there has been no significant spike. Below you can see what significant spikes look like, those two peaks being 24 October 2008 and 27 March 2020.
Source: Google Finance
We are yet to see panic selling in the US or in the Australian market, where a ‘buy the dip’ mentality seemingly persists instead. So, while market volatility may remain for some time still, it’s not pointing to another massive market crash.
Decline in company earnings
The current reporting season will be important to watch to get an idea of how companies are coping in this inflationary and rising rate environment.
Earnings expectations remain high but do seem to be pulling back, possibly to do with a recent pullback in commodity prices. That said, cost pressures, labour shortages, rising interest rates and supply chain constraints also remain threats.
It’s also the start of the US reporting period, yet most companies won’t report until next week. Despite cost pressures and supply chain issues there are early signs that companies are performing better than expected, although earning growth is below longer term averages.
Keeping a close eye on company results will tell whether they are managing in this more challenging environment or if it is carrying over to hit the bottom line, which would suggest further share price declines are in store.
But rather than trying to pick the bottom, it may be better to recognise that the market could still see some volatility in the months ahead. While share prices are starting to look attractive, a strategy of not picking the bottom but rather of using weakness to average into an investment over a number of months may be the way to go.
As we have previously said: Keep it simple. Keep it disciplined. Keep it rational.
A quick Google search for investing news provides 20+ sensationalist headlines. Interest rate changes, inflation, market cycles and quarterly updates provide media and marketers with an abundance of topics to craft clickbait with the intent of attracting eyeballs to their product. So, how do we approach this?
So much of the focus in investing media and discussion centres on what can be done in the short term: finding the next big winner, the newest trend, the latest current event impacting today’s stock prices. Little of the minutiae presented will actually help you invest better – the overload of fast information with a short shelf-life can so easily leave our minds scattered.
In the effort to become a better investor, it is natural and intuitive to search for more information, what more to do or what more can be added. It may be surprising to many, but the best predictors of financial success over a lifetime are often consistent simple behaviours (i.e. your long-term habits), rather than stratospheric stock picks. The problem is that many people know the fundamentals of what to do, and yet still don’t succeed.
In fact, financial success is one of the few, if not only, fields where a nonchalant everyday person can outperform a high-flying professional simply by out-behaving them. You’ve heard the story before: an 80-something year old janitor leaves behind a multi-million dollar fortune nobody knew about while a Wall St “pro” has to sell his yacht and declare bankruptcy.
The fortune was created by a consistent, simple investing approach underpinned by a few straightforward character traits that allowed compounding to work its magic over a long period of time. The outcome of harnessing the power of compounding for a long time is profound, even with average returns.
As most readers would find a “what to do” list redundant, let’s try a different approach based on one of my favourite Charlie Munger-isms:
“Invert, always invert: Turn a situation or problem upside down. Look at it backward.”
Instead of looking for how to succeed, make a list of how to fail instead. Charlie Munger is widely recognised as an incredibly intelligent polymath and he freely admits his studies of historical figures is to help reduce what he calls standard stupidities. Munger finds success through avoiding errors and subtracting distractions that could interfere with his mental clarity.
Thousands of years before Munger, the Taoist philosopher Lao-Tsu wrote that the path to wisdom involves “subtracting” all unnecessary activities:
“To attain knowledge, add things every day. To attain wisdom, subtract things every day”.
Here is a quick list of seven financial behaviours to avoid. Doing so should greatly improve your prospects for success over the long run:
Spending more than you earn, overextending and taking on too much debt
Not investing at all
Constantly checking the market and your portfolio
Following headlines, advice from media and tips from friends
Constantly turning over your investments
Concentration into too few investments or di-worse-sification into too many
Letting your emotions rule
At the heart of every difficult challenge lies three tough choices:
What to pursue versus what to ignore;
What to leave in versus what to leave out; and
What to do versus what not to do.
Most people make the mistake of adding too much complexity to their investing, preoccupying themselves with the superficial and irrelevant. Focussing on the second half of each choice — what to ignore, what to leave out, what not to do — helps confront the things that could go wrong with your investments so you can lessen the chances of them happening to you.
Many of the greatest investors recognise the need to craft an environment that enables deep concentration and amplifies high performance habits. From Warren Buffett to Chuck Akre to Nick Sleep, each one has championed subtraction in order to deeply focus on what matters most to their investing practice. Buffett purposely lives and works in sleepy Omaha, away from the chaos of Wall Street. His office door remains closed and blinds shut so he can peacefully sort through annual reports without distraction. Akre, who’s firm Akre Capital Management beat the market for three decades, is based in a town with one traffic light and views of mountains. Sleep prefers a deep armchair to a desk and stores his Bloomberg Terminal (the pinnacle of fast information, stock prices and alerts) on a low table in a corner of a room separate to his office, making it uncomfortable to be there for long.
As the best investors show, it is not addition but subtraction that is key to sustained excellence.