Global equity markets began the year with a wave of optimism. The MSCI World Index added 7.1% during the month, while the S&P/500 added 6.3%. Inflation appears to be abating, allowing central banks to taper interest rate hikes soon. China’s emergence from a three-year global hiatus is positive for global growth, particularly with Europe and the United States potentially heading into some level of downturn.
Today, we will be sharing three companies from the TAMIM Global High Conviction Fund. All three are profitable, trading at compelling valuations and are focused on returning profits to shareholders. As always, keep in mind the companies form part of a broader portfolio and are not recommendations.
1. eBay Inc (NASDAQ.EBAY)
Global e-commerce platform eBay connects sellers of new and used goods with buyers. Like most retailers, eBay benefitted from the pandemic as shoppers were forced online and households built up excess savings. The share price retreated significantly in 2022 as this unwound. However, the underlying business has proven far more resilient. Revenue is expected to fall marginally, while eBay has improved its take rate and bought back shares.
eBay’s growth strategy centres on “enthusiastic buyers”. This cohort of customers shops frequently, has high order value, and spends 30 days a year on the site. The website has become a destination for high-quality second-hand goods, including refurbished electronics, trading cards, sneakers and motor vehicle parts. eBay has also enhanced its platform through authenticity guarantees and certifications of purchase. Other positive moves include digital wallets and a focus on advertising revenue.
eBay’s share price gained 19 per cent over January. Still, the company is priced for demand to fall significantly, trading on a price-to-earnings multiple of 12 based on non-GAAP earnings. The business also trades on a dividend yield of 1.8 per cent, with a 20 per cent payout ratio implying plenty of headroom to increase this over time.
2. General Dynamics Corporation (NYSE.GD))
General Dynamics is a global aerospace and defence company based in the United States. The business offers a range of products and services for marine systems, land combat vehicles, weapon systems and munitions, technology and business aviation.
During the month, General Dynamics reported fourth-quarter and full-year earnings. Earnings in 2022 were USD $3.4 billion, up 4.1% from the prior year, on a healthy operating margin of 10.7%. What impressed us was the cash performance of the business. Cash from operations represented 135% of earnings, indicating that accounting profits turn into real cash for shareholders. This allowed the business to reduce debt by USD $1 billion, invest USD $1.1 billion in capital expenditure, and return USD $2.6 billion to investors via dividends and share repurchases.
Management noted a strong order book, with a backlog of USD $91.1 billion. This is the largest in company history and represents more than two years of revenue. At the midpoint of guidance, it expects earnings per share to increase by 3.6% in 2023.
We expect demand for General Dynamics products to be robust going forward, with nations prioritising defence capabilities in light of Russia’s invasion of Ukraine. NATO’s intention for 2% of GDP to represent the floor of defence spending, with some countries pushing for higher, is a clear example of this. The recent AUKUS deal between Australia, the United Kingdom and the United States is another positive tailwind. Trading on a price-to-earnings multiple of 19 and a dividend yield of 2.2%, we believe this is an attractive valuation for a company with strong cash and shareholder returns.
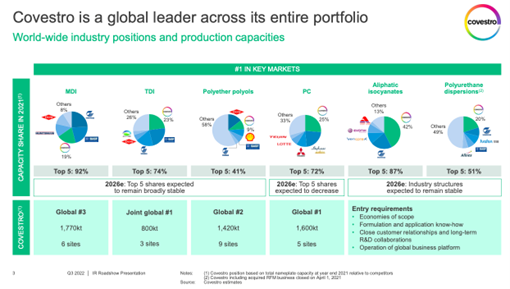
3. Covestro AG (ETR.1COV)
Covestro is a German producer of polyurethane and polycarbonate-based raw materials. More simply, Covestro produces precursors for plastics, foams, adhesives, coatings and films to support end markets, including automobiles, furniture, constriction, electronics, cosmetics and healthcare. Shares in Covestro were sold off last year as the business faced the prospect of high energy prices, limited supplies of inputs, economic and political instability, and ongoing inflation. In January, the company provided a preliminary update on its full-year results. It missed analysts’ expectations regarding accounting earnings, but we were pleased with revenue and free cash flow results, which are more representative of the underlying business.
Covestro commands leading market share positions in several material markets, including MDI, TDI, polyether polyols and polycarbonate. It achieves this by spending upwards of EUR 900 million on research and development each year. Barriers to entry are high, with new competition deterred by the significant upfront capital cost and required operational know-how.
Covestro is forward-facing, creating new products which are lighter, more durable and better for the environment than incumbent offerings. For example, it has developed new insulation materials to improve the shelf life of food. It’s also exposed to future industries such as electric cars, which require 2-5x more polycarbonates than conventional vehicles. The company is committed to becoming climate neutral by 2035 regarding its scope 1 and 2 emissions. With a share buyback program currently underway and an aim to double sales by 2025, we believe the future is bright for this essential materials company.
With the RBA lifting rates another 25 bps this week, we look to a business that has steadily benefitted from the current rate environment. Suncorp. A company that seems to be in the midst of a long-awaited turnaround.
Before we proceed further, let’s set the context. Insurance is a straightforward equation that can be summed up as follows: Profit = Earned Premium + Investment Income – Incurred Loss – Underwriting Expense. It is with this in mind that we assess how Suncorp has fared.
Earned Premium
The insurance industry in Australia is a somewhat competitive environment, it has also seen heavy consolidation over the last few years. When we last wrote on Suncorp in 2021, top-line growth was our biggest issue. With changes to senior management, including the promotion of the CFO to the top job, concern remained around the new strategy going forward. On this front, Suncorp has performed relatively well. GWP (Gross Written Premiums) are on a significant double-digit growth trajectory. Specifically, home insurance was up 12.1% and 11.7% in Motor, while NZ increased another 12.2%.
This shows us that the business is on firm footing and momentum-wise. At the same time, we do see this slowing down given base effects, primarily since much of the growth was driven by solid premium increases (i.e. a particularly trying time in relation to natural hazards), while Motor also reflects elevated underlying claims inflation and higher sums insured. On the latter point, assuming our base case is that inflation starts to come down, we should also see a flow-on impact on premiums.
Nevertheless, the overall result has shown that management’s strategy seems to be working.
So on the first part of our equation, Suncorp gets a pass. We now move on to the second part of the equation; investment income.
Investment Income
This is perhaps the most apparent tailwind that most might think of when it comes to rising rates and the impact on an insurance business. Despite the volatility in investment markets through the course of the year, the firm’s prudent allocation, especially in relation to ILB (Inflation Linked Bonds) and investment grade, has meant that:
1) It has provided an offset to claims of inflation
2) Increased the average yield on insurance funds to above 5%.
Assuming that we continue to see a hawkish tilt to central bank policy, the increase in yields should, in our view, continue to more than offset mark-to-market losses on risk-free bonds (i.e. treasuries) and breakevens.
The bank continued to prudently decrease exposure to equities while increasing exposure to infrastructure and property assets. It must be noted, however, that on the latter, the investor has to be a little more discerning (i.e. revaluations). Overall a stellar result and one that shows that the strategic allocation of the business is both prudent and well-suited to the current environment.
On the second part of the equation, we would rate exceptional. We now move to the third part, Incurred Loss.
Incurred Loss
Let’s go to the definition first. The definition of incurred loss is the total amount of benefits paid to policyholders during the current year plus changes to loss reserves from the previous year. Here it is perhaps appropriate to break this definition down into two components. The first is the benefits paid, which more often than not, has a lot more to do with external events outside of the firm’s control and the loss of reserves (which indicates the extent or certainty to which the firm is able to forecast future loss).
On the first point, the business continues to battle the weather gods. The La Nina weather cycle has disproportionately impacted the natural hazard costs exceeding the allowance by 99 Million (this being the third consecutive cycle). Furthermore, flooding in NZ in Jan should see this continue to take a heavy toll (we won’t know the full extent as of yet). Going forward, we see this aspect (i.e. increasingly unpredictable weather patterns) play a prominent role in the business. Whether you attribute this to man-made activity or historic climate cycles, weather patterns are changing and will play a more significant factor in the business outlook.
This brings us to the second part, the firm’s ability to adequately forecast and manage its risk profile (hence reserves). The firm’s skew to QLD and areas with greater exposure to the La Nina have a twofold impact. It must pay higher premiums for reinsurance and keep more catastrophe risk on the balance sheets (which history shows Australian insurers aren’t particularly good at). In this instance, we agree with Andrei Stadnik, the Morgan Stanley analyst’s view that the business needs to emphasise this risk more and not just by using its market leadership in hiking premiums.
In our view, this will be the most significant long-term headwind (i.e. geographic diversification) and their ability to manage catastrophe risk.
Suffice it to say, on the third part of the equation, we say – partial pass. For now, the business’s market power (i.e. the ability to pass on premium increases) seems to outweigh its longer-term risks.
Underwriting Expense
This brings us to the final part of the equation, and with an ex-CFO in charge, as expected, this is one area in which we should expect to see some good performance. Indeed, the guidance regarding ITR previously elaborated on was in no small part a result of operational efficiencies and overall expense reduction. The group has, in fact, confirmed the AUD 2.7 billion in cost savings are on track to be achieved and with a group cost-to-income ratio of 49.9%. Pleasingly the firm seems to have handled the inflationary pressures quite well.
On this front, we can give the business an excellent stellar mark.
Overall Outlook & Growth
Overall the business seems to be on track to continue to deliver for shareholders in the medium term. Investment Income should continue to grow, and even if monetary policy stabilises, we expect overall insurance yields to remain elevated with the benefit of recovery in mark-to-market losses. While we expect earned premium growth to stabilise along with inflation and cost-out initiatives, we expect this to be a reasonable long-term income play. Circa. 5% dividend yield with a high single-digit growth rate going forward.
That said, over the longer term, we continue to watch for signs of better risk management, especially regarding geographic diversification and catastrophe risk.
Disclaimer: Suncorp Group Limited is currently held in TAMIM portfolios.
For most investors, 2022 was a tough year. For CY2022, the Australian Small Ords was down -18.40%, the S&P500 was down -19.40%, and the Nasdaq was down -33.10%. Our Australian All Caps fund did not fare better as we, in particular, experienced tough stock-specific declines, particularly due to de-rating multiples in small caps. However, investing is a long game and the law of mean reversion will likely come to the forefront again in 2023.
For over 100 years markets have always risen to new highs after pulling back: the global march of progress means that, over time, investing in businesses is the best way to compound wealth despite short-term volatility and frequent downturns.
It is worth noting that both on a historical and fundamental basis, 2023 is shaping up to be a strong year for equity markets. Historically after such market downturns as last year, it is rare to see another consecutive year of large losses. In addition, if the US enters a recession this year as expected, markets tend to rally when recessions are announced as investors anticipate an earnings recovery. Finally, China reopening post its zero COVID policy, will be a strong tailwind for the Australian and global economy.
We know our investment process works. Our long-term results annualise as double-digit returns and we expect mean reversion to occur here too. We do not extrapolate one year of under or overperformance as to what we can do, but the average of many years. On that basis, we’re excited for the year to come.
Looking at our portfolio allocations, it’s important to stick to our principles and continue to invest in growing companies that have strong balance sheets to withstand a downturn and any cyclical businesses that may recover quickly in time.
We must remember that the strongest gains in markets tend to happen right after markets bottom, and since there’s no one there to ring the bell, timing the markets is impossible. This is why we remain invested and will outperform when markets recover.
We are now firmly of the view that the worst of this cycle is behind us and although markets may continue to be volatile in early 2023, we expect an overall strong performance during the year. As of writing, some of this optimism is already showing in the portfolio’s performance.
Here are three holdings we believe are set to rise in the coming twelve months.
Retail Food Group (ASX: RFG)
Retail Food Group is a food services and brand franchisor. This investment is a special situation where a new management team are in turnaround mode. Since 2017, Retail Food Group has been shrouded in controversy and out of favour. Explosive allegations were made regarding the company’s dealings with franchisees following an investigation conducted by The Sydney Morning Herald. At the time, it was alleged that Retail Food Group failed to provide adequate financial information for the stores being sold to franchisees for those that operated stores such as Michel’s Patisserie, Donut King, and Brumby’s.
Understandably, the market reacted very negatively to the situation and floored the Retail Food Group share price down a crippling 98% within two years. Skip to now and the Australian Competition and Consumer Commission (ACCC) has completed its investigation and the company is moving ahead with a new management team.
Retail Food Group is well-positioned to grow earnings from multiple internal growth initiatives, as well as being better placed to attract new franchisees and commercial partners, which was previously impacted by the shadow of the ACCC investigation.
The results are beginning to show with profits this year expected to grow up to 35% to $29 million in operating earnings (EBITDA). During the past month, the company delivered good news with an agreed settlement with ASIC for previous misconduct. The outcome of circa $10 million was favourably below market expectations. Going forward we see Retail Food Group beginning dividend payments and resuming its store network growth. Additionally, Retail Food Group currently trades at a multiple half that of its peers, positioning the stock to re-rate if management continues to restore growth and goodwill.
Mayfield Education (ASX: MFD)
After slower merger and acquisition (M&A) activity in 2022, stabilising market conditions this year will provide the right environment for these kinds of situations to kick off again. Additionally, with small cap valuations getting hammered in the past twelve months, some lucrative opportunities have risen for the right suitors.
Mayfield Education is a Victorian-based childcare provider with 28 centres. In 2021 the company acquired its competitor Genius Education for cash and script, making Genius its largest holder (35%). Then, during 2022 these acquired 14 Genius centres underperformed relative to the original Mayfield centres, the central reason for earnings to miss expectations and for any earnout payment to be cancelled.
Recently, Genius surprisingly made a takeover offer of Mayfield for $1.28 per share of the stock it doesn’t already own. The offer was quickly superseded by Busy Bees Early Learning bidding $1.35 per share. Busy Bees previously acquired Think Education (ASX: TNK) in 2021 in what ended up being a contested takeover battle.
The highest bid from Busy Bees only values Mayfield stock at approximately 11 x price-to-earnings (PE). The offer precedes what we expect to be an earnings recovery and doesn’t reflect the positive outlook for the company. We are sitting tight and waiting for the corporate activity to play out.
G8 Education (ASX: GEM)
Another holding within the sector is G8 Education, one of the largest childcare companies in Australia. The company released a positive trading update in December, with operating earnings (EBIT) of $71 million and net-profit-after-tax (NPAT) of $41 million. Year-on-year core occupancy improved to 77.3%. Management has also shown discipline with better cost control and managing labour shortages to achieve cost savings which mitigate inflationary pressures.
The balance sheet is also in a solid position with net debt at 1.2x operating earnings and, so far, $32 million has been spent on a share buyback initiative.
We see 2023 as a positive year for the childcare sector with both favourable government policies and improvement in occupancy levels as the COVID impact completely wears off. We also expect staff shortages to ease as the international visa backlog unwinds. Overall we see the sector re-rating on the back of improved earnings and dividends. With Mayfield on the verge of being acquired, we see G8 Education as an attractive alternative exposure to the sector.
Disclaimer: Retail Food Group (ASX: RFG), Mayfield Education (ASX: MFD), and G8 Education (ASX: GEM) are currently held in the TAMIM Fund: Australia All Cap portfolio.
We have been attracted to Japanese equities for some time due to their robust balance sheets and notable improvements in governance. More recently, Japanese companies have weathered the economic headwinds to outperform global peers significantly. This is despite the Japanese Yen falling relative to the US dollar and in our opinion, becoming ludicrously undervalued.
Many Japanese companies we consider to be “true technology companies”. They are in the business of selling technology by using applied scientific knowledge to solve real problems. These companies spend significant sums on research and development to build competitive advantages based on intellectual property and manufacturing leadership. This differs from the likes of big tech in the United States. For example, Google-owner Alphabet (NASDAQ.GOOGL) might be classified as a technology business, however realistically it is a cyclical advertising company. Investors should be mindful of industry classifications, as they can provide a false representation of a business’s underlying business model or sector.
1. NGK Insulators (TSE.5333)
Nippon Gaishi Kaisha (NGK) translates to Japan insulator company in English. As an aside, many companies in Japan begin with either Nippon or Nihon, which means Japan in Japanese. NGK’s core technical expertise is in ceramics, which is known for its durability, non-conductivity and heat resistance. Historically the business provided ceramic insulators that safely delivered electricity but has since moved into new markets such as automobiles and semiconductors. NGK is the market leader in ceramic substrates and filters, which detoxifies harmful exhaust emissions and particulate matter from motor vehicles.
NGK is over 100 years old, has weathered multiple economic cycles and continues to innovate. The business is now moving away from fossil-fuel vehicles and towards energy storage and digital applications. Recent new products include the first megawatt-class NaS (sodium-sulfur) battery and an ultra-compact lithium rechargeable battery used in small electronics called EnerCera.
The business has over 7,800 patents filed globally against its intellectual property. It also spends 5 per cent of its revenue on research and development annually, with 70 per cent dedicated to future-facing industries. It’s built customer relationships over decades and is embedded deeply within end products. Regarding valuation, NGK trades at a 17 per cent discount to its book value and on an earning multiple of 8.5.
2. Amada Co. (TSE.6113)
Amada is a large manufacturer of metal working machinery in addition to providing automation systems, software and services. The company sells equipment for sheet metal fabrication, precision welding, cutting, grinding and press automation. This machinery is then used to build a wide range of end-use products including elevators, smartphones, bridges and road signs.The company has developed fibre laser machines that cut more accurately and safely than incumbent carbon dioxide laser machines. It also uses around a third of the energy, and while more expensive upfront, the operating costs of fibre machines are significantly less. Sectors such as manufacturing, aerospace and automotive are expected to drive demand for metal fabrication over the medium term. Amada will also benefit from falling population demographics in countries such as China, where machines will be needed to replace manual labour.
The business has offices and operations around the globe, with 61 per cent of sales from international markets. Amada has a conservative balance sheet, with a third of its market capitalisation in net cash. Valuation-wise, the company is trading on an earnings multiple of 10.5 and at a 27 per cent discount to its book value.
3. Shin-Etsu Chemicals (TSE.4063)
Shin-Etsu is the fourth largest chemical manufacturer globally, providing products to various sectors including; construction, healthcare, semiconductors and pharmaceuticals. It is the world’s largest supplier of PVC, a durable and hard plastic used in window frames, piping and roofing. Shin-Etsu is also the number one provider of semiconductor wafers, a thin slice of material used in semiconductor fabrication.
The company has built decades of proprietary insights and relationships with customers. It also has a vast international network of manufacturing facilities and intellectual property. New innovations include silicon monoxide anode materials for high-capacity and high-power lithium batteries in anticipation of the shift to electric vehicles. It has also developed equipment that can transfer micro-LED chips quickly and is now a one-stop shop for original equipment manufacturers.
Shin-Etsu is highly profitable, with an operating margin of 32 per cent. Moreover, its return on invested capital is 27 per cent and hasn’t fallen below 15 per cent over the past five years. Shin-Etsu has a conservative balance sheet with nearly a quarter of its market capitalisation in cash. The company trades on a price-earnings ratio of 10 and analysts have continued to upgrade earnings estimates over the past year.
Today we will be sharing three companies that have one common trait which is that they are ‘old’ businesses, with the youngest incorporated 96 years ago. Age alone doesn’t indicate a sound investment, but it does demonstrate that the company has been able to weather multiple economic cycles and emerge on the other side. This will be especially important in 2023 as we enter a more uncertain environment for economies and subsequently companies.
1. BWX Technologies (NYSE: BWXT)
Founded in 1867, BWX manufactures and engineers nuclear components and fuels. The company’s main operations centre on marine nuclear solutions for the US government, however, it is expanding into commercial applications, including nuclear medicine and commercial nuclear power.
It recently won a contract with GE-Hitachi to engineer its BWRX-300 small modular reactor (SMR) pressure vessel. SMR technology is akin to a smaller nuclear power plant, suitable for remote locations or industry applications as it can be factory assembled and transported.Sentiment and demand for nuclear solutions are strong, particularly in light of the Russian-Ukraine war, highlighting the importance of energy security. This is in addition to governments legislating net-zero emissions targets, for which nuclear will play a crucial role as a reliable source of baseload power.
During the month, the company released its third-quarter results. Revenue increased by 5%, with 22% growth in commercial operations. Free cash flow also increased by 24% during the quarter. Management noted that labour availability is constraining growth. The business has responded by streamlining the recruitment process, improving employee referral programs and providing more site-level resources.
In 2023 the company expects stronger growth with an acceleration over the medium term. BWX trades on an earnings multiple of 20 and a dividend yield of 1.5%. Given the aforementioned demand profile, we expect it to grow in its valuation.
2. Schlumberger NV (NYSE: SLB)
Schlumberger was founded by Conrad and Marcel Schlumberger in 1926 in Paris − then a part of the German empire. The two brothers pioneered electrical coring, which uses electrical measurements to identify geological formations. Before this, oil exploration relied on samples or cuttings from boreholes which were highly unreliable and frequently missed oil zones.Today, Schlumberger is a global leader in technology and services for the oil and gas sectors. Its largest division by profit is well construction, followed by digital and integration, reservoir performance and production systems.
Against the backdrop of Europe’s energy crises and a decade of underinvestment in oil and gas, there is a strong demand to increase investment and rebalance markets, create supply redundancies, and rebuild spare capacity — for which Schlumberger is a direct beneficiary.
The company is also making forward-facing investments via its new energy division, which includes carbon, sequestration and geothermal technologies to reduce and safely store carbon emissions.
At its investor day this month, management expects annual revenue growth to be 15% out to 2025, with upside should supply remain limited. It also surprised the market by increasing its quarterly dividend payment by 43%.
We are attracted to Schlumberger’s long-term growth profile as well as its clear capital allocation framework, which focuses on shareholder returns. It trades on an earnings multiple of 16 when looking one year out, which underappreciates the growth outlook.
3. Hillenbrand Inc (NYSE: HI)
Incorporated in 1906, Hillenbrand is a US-based industrial company that provides advanced equipment used to manufacture a range of products, including packaging, consumer goods, food and chemicals. The business also owns a legacy funeral casket business called Batesville.
Hillenbrand reported fourth-quarter results during the month, with revenue increasing by 7% in constant currency and net income up by 9%. The company has been able to offset inflationary pressures by pushing through price increases, demonstrating a level of pricing power. It’s also improved processes to maintain margins.
Despite the uncertain economic outlook, management noted a record backlog of orders for equipment in both the moulding technology and advanced process divisions.
Hillenbrand has recently completed three acquisitions to bolster its recycling and food solutions portfolio. The business will host an investor day in December, where we expect to hear more information regarding its growth strategy.
Hillenbrand is not a particularly exciting company. However, it sells essential equipment to a diversified customer base across several geographies, making its earnings reliable and defensive. The business is also exploring strategic options to create shareholder value, including the sale of Batesville.
Trading on an earnings multiple of 11, the market has priced it as a no-growth company. This leaves potential upside should it continue to improve margins and integrate recent acquisitions.
Disclaimer: BWX Technologies (NYSE: BWXT), Schlumberger (NYSE: SLB) and Hillenbrand (NYSE: HI) are currently held in the TAMIM Fund: Global High Conviction portfolio.