By now most of the readership, we assume, has heard about the Archegos Capital fiasco. A situation that, last Friday, shook global equity markets. A series of events wiping out close to 50% of the market capitalisation of Discovery, more than 50% of Viacom, 20% off Baidu to name a few, not to mention the fact that it has led to an increased level of volatility in global markets. But, just in case you haven’t and you are an investor who has been scratching his/her head at what has been happening in terms of price action, read on.
A Little Context
Author: Sid Ruttala
Before we explore the current situation further, a little history into Archegos. Archegos Capital Management, is an outfit run by Bill Hwang, an interesting character who would in any other situation deserve a full article for himself in my opinion. Mr. Hwang made his mark in the finance world close to two decades ago as the protege of Julian Robertson, part of a club now referred to as the Tiger Cubs (i.e. the alumni of Tiger Management who went on to form their own hedge funds once the mother firm folded in 2001). This particular cub was originally inducted into Tiger in the 90s after he had managed to be particularly lucrative for the firm as a broker at Hyundai securities. Following the roll up of Tiger in 2001, Mr Hwang branched out on his own, investing for himself and starting his own outfit in Asia.
That particular outfit, rather creatively named Tiger Asia, was not only bankrolled by Robertson himself but became one of the largest investors in Asia, managing billions at its peak. However, having shown stellar returns through much of the decade, Mr Hwang decided to leave another kind mark on the industry, this time making him rather infamous. Underlying the stellar returns Mr Hwang had been showing, it seemed that there were certain irregularities. These particular irregularities included insider trading and market manipulation, which eventually resulted in a ban from trading on the Honk Kong exchange and penalties by the SEC to the tune of $40m USD.
So that should’ve been the end of it right? Wrong.
Twelve months after the collapse of Tiger Asia, Hwang launched a second firm, Archegos Capital Management in 2013. This time he had converted the firm into a family office, a setup that managed to rid him of the pesky headache of regulatory requirements (family offices are exempt from the SEC’s reporting requirements for investment firms). The firm grew by leaps and bounds, not only in size and scope but also risk appetite. The initial principal of $200m grew steadily over the years to about $10bn (as recently as last week).
This brings the second question, how did a family office grow big enough to make a global impact? The key here is that the fund had, it seems, been using previously unheard of levels of leverage, often borrowing close to seven times principal in order to amplify returns. A scenario that allowed it to grow by leaps and bounds over a close to decade-long bull market. The music was playing, so to speak, and everyone was dancing; institutions as well as prime brokers were bending over backwards to extend lines of credit for lucrative commissions. Aside from being a prime example of what excesses and low interest rate environments can create in terms of dislocations, this particular situation also brings to the forefront another example of the risk management practices (or lack thereof) at global institutions. After all, we have seen this play out before, though many have forgotten about it, in a little blip called the GFC and, for those of you that wish to go back further in history, LTCM (Long-Term Capital Management) that in many ways exacerbated the Asian Financial Crisis.
But who do we kid? There is no protection against human nature, after all. If the upside is lucrative enough, we are all prone to bite the bullet and play along. So much so it seems that most of the brokerage teams had been lobbying the risk departments to turn a blind-eye to Mr. Hwang’s rather chequered past. Hwang was, after all, seen as a “money-making genius” and maybe this time would be different. The fees would certainly make up for it and hopefully they wouldn’t be the last one standing in the room if it went wrong.
Unfortunately, it did go wrong when shares in some of Archegos’s biggest positions started to decline and warranted a margin call. By Friday of last week two of his biggest lenders, Goldman and Morgan Stanley, initiated the sale of some of his biggest positions, $20bn USD worth of it to be exact. On Friday alone, Goldman and Morgan Stanley managed to sell off $19bn USD at seemingly garage sale prices, wiping out close to $33bn USD in the market capitalisation for the companies involved and potentially more to come. Unfortunately in situations like this, there is a domino effect whereby the sale triggers broader sell-offs and panic starts to set in.
It seems that Archegos has exposure via more institutions, including Credit Suisse and Nomura to name a couple. That particular information led the market to sell off Credit Suisse, which lost close to 15%, and though the impact upon Nomura was more muted, it might still have the potential to wipe out the firms second half profits. Credit Suisse and Nomura have to unwind another $20bn USD, potentially more pain to come?
What does this mean for investors and what can we take away?
All these events are going to bring increasing levels of scrutiny by regulators and the extent of leverage within the broader markets. All things equal, we are at the very least likely to see a lowering off the risk-appetite and de-leveraging within the broader markets. As firms ask their clients to taper off some of their risk exposures.
As for the regulators, the only thing done so far has been to ensure that brokers aren’t coordinating the sale and breaching antitrust regulations, apparently we’ve at least moved on from the 80s. But, as the world continues to stay at lower rates for longer, the quest for returns will continue to drive risk appetite and leverage (for lack of a better option). And while we might see some turbulence as financial institutions at least pretend to tighten credit lending requirements, somehow we doubt this will be the end of it.
For the discerning investor with a longer time horizon, hold in there. After all, you could’ve bought Discovery 40% cheaper with no news flow and no changes to what the underlying metrics were pre-selloff. And add in our tendency to have the collective memories of goldfish, as soon as the markets and media find another hot topic, it will be business as usual. The fact that most of the financial institutions globally have been showing some of the best capital markets returns in years should tell you that, depending on how quickly the world moves on, the siren call will be too hard to resist. Market participants are creatures of habit after all, insisting like a chronic gambler that this will either be the last time or this time will be different. Clue: it never is. For yourself, at least understand what is driving moves like this and have a longer time horizon, these types of markets also present immense opportunities.
There is a novel idea in finance, the two main drivers of human behaviour in markets are fear and greed, understand them and learn to use them to your advantage.
Some of the best opportunities on the ASX in recent times have been microcaps. Companies where the business models are scalable, management have a track record of execution, and, more importantly, companies that are well funded. Altium and EML, as best-case examples, were sub-$50m microcaps just 7-8 years ago and are multibillion dollar businesses today.
Authors: Ron Shamgar
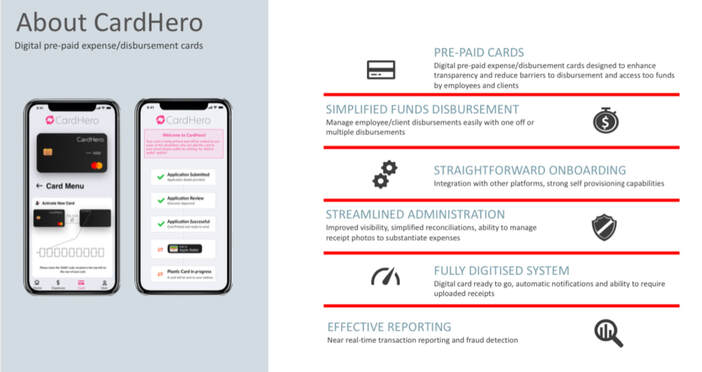
8common (8CO.ASX) is a software business in expense management, specialising in the government and not for profit sector. The software allows employees to claim work related expenses. It has 10% market share of the Australian market and an even larger share of the government sector. 8CO will be a beneficiary of the recommencement of travel and it has recently added over forty government departments to the platform. 8CO also recently launched a new card payments solution called CardHero, being utilised for segments of the $4.8bn National Disability Insurance Scheme (NDIS) program, as an integrated fund disbursement and spend management option. CardHero is designed to help prevent fraud by instantaneously accepting or rejecting transactions as they are made. CardHero is exciting for investors because the ARPU is 6x higher and the addressable market is significant. A broker recently initiated coverage on 8CO at a valuation of 50 cents.
Source: 8CO company filings
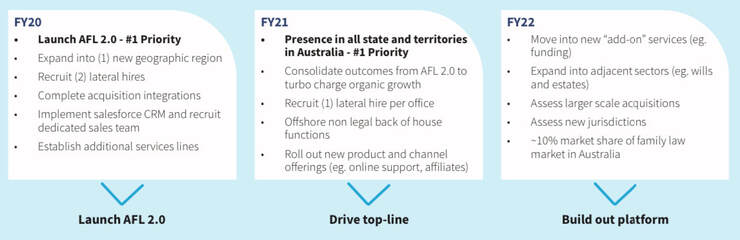
AF Legal (AFL.ASX) is a family law roll up story. In a defensive and highly fragmented industry, the company is aspiring to become the largest family law firm in Australia. AFL is growing laterally by both adding new recruits and through the acquisition of existing firms. The recent deal to acquire NSW based Watts Mcray adds scale with $6m revenues and we estimate $2m of EBIT post-synergies. We estimate that AFL is on track for EBIT of $5m in FY22. The company is very cash generative and capital light. On a decidedly somber note, there is little doubt that AFL has benefitted from the spike in divorce rates due to Covid hardships. On the lighter side, some investors regard AFL as a hedge against their own future potential divorce bill! If they can execute in line with our assumptions, we value AFL at $1.50.
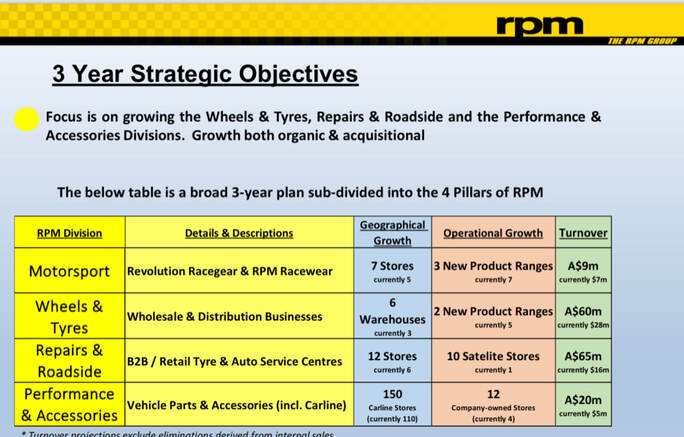
RPM Group (RPM.ASX) is an automotive group similar to ASX listed Bapcor. RPM business includes the selling of tyres, motorsport apparel and has mechanical repair shops. Similar to AFL, RPM is an acquisitive roll up story. Guidance this year is for revenue of $55m and EBITDA of $5m. The management has signaled three acquisitions currently in the pipeline that should take the group to $100m in revenue once completed. In the medium term, group aspirations are for $150m business and 10%+ EBITDA margin. RPM is a Covid beneficiary too. The domestic travel thematic, elevated due to national border closures, and the reduced public transport usage working in their favour. The founders of RPM have a track record of previously building a similar business and selling it for $35m (to Bapcor) in 2015. We believe their current ambitions are significantly greater than last time around. If RPM can achieve $100m revenue then we value the group at approximately 3x the current share price, putting it around the 90c mark.
Source: RPM company filings
Disclaimer: All three stocks are held in TAMIM portfolios.
We wrote about the need for a U-turn in macro policy thinking recently. It looks like we are getting one; or just as important for market psychology, other investors think we are getting one – a shift that is. Read on to learn what investors should consider in this context.
Author: Robert Swift
Don’t expect a ‘mea culpa’ from policy makers for 20+ years of ‘monetary policy for rich people’ but we are getting a shift in thinking and so off we go to the next experiment (or paradigm if you are in academia). This has implications for the kinds of stocks and sectors and countries in which you should invest. Incidentally, it’s not exactly the shift to a policy we expected, but it is probably better than repeating what has been done for the last 20 years, which always prompts the definition of madness.
We wanted and anticipated a shift from ZIRP to something a little more fiscal and supply side to encourage investment and jobs growth.
The fiscal stimulus we are getting ($4tn+ and counting) is pro cyclical not counter cyclical. This looks like a big increase in government spending and borrowing in conjunction with low short term interest rates, at a time when the economy is growing quite well. That’s quite a heady and unusual combination.
In the US economy ‘animal spirits’ seem to be stirring. Vaccinations are running ahead of other countries’ programmes (as Churchill said, the USA always invariably does the right thing but only after exhausting all other possibilities) and the tech embargo has produced a large planned increase in onshore SPE capital investment. Interestingly too, the Biden Administration has not (yet?) removed Trump’s ‘unnecessary and damaging’ tariffs on Chinese exports. We are thus in a ‘full on’ return to National Industrial Policy which will boost aggregate domestic demand and inflation expectations. [Build Back Better – Buy American]
Since ZIRP or Zero Interest Rate Policy hasn’t worked other than for those on Wall Street, or with lots of moolah to start with, we had expected a shift to fiscal policy and a normalisation of monetary policy which would potentially benefit Main Street – i.e. higher interest rates at the long end as the Fed began to reduce its interventions/QE, and letting bad financial decisions have their consequences rather than free put options and bail outs for Wall Street. This would be orthodoxy or certainly post 1980 Reagan orthodoxy from when large scale government intervention was deemed to be part of the problem, and private enterprise was less concerned about share buy backs and more concerned about sustainable growth through re-investment.
There really is no need for a large pro cyclical fiscal AND monetary stimulus other than if you think it’s time to throw out the old post 1980s playbook and try something new? Essentially the Reagan era orthodoxy looks to be out the window, and so off we go into what for many people will be the unknown. At this juncture let’s just say that quite a few global investors have careers that only encompass ZIRP….we are all about to be tested.
There really has never been any deflation as this chart from the Cleveland Fed shows. So, continued ZIRP with a big fiscal boost is inflationary.
US Inflation – What deflation?!?
Source: Bloomberg
Let’s have a quick summary of what we see in the $4+ trillion package:
Infrastructure but a huge clean energy expansion with credits for Electric Vehicle purchases
Incentives to return technology supply chains to USA soil
Unionisation of the workforce to drive up wages relative to profits (not necessarily a bad thing given where they are now relative to history)
Higher headline taxes (will the likes of AMZN actually pay them?) including a multi-national tax proposal which we view as essentially ‘soft form’ capital controls if it passes through globally.
So it’s a return to big government and centrally directed capital allocation or essentially the 1950s. We have christened this SPLURGE or Spending Public money Like URGiving it Everything. The USA is a first world country with 3rd world infrastructure, so we view this spending on the national capital stock as an essential part of the US’ rebuilding process, and do like infrastructure companies as investments, but this has to be paid for AND inflation expectations can’t be let loose or we’re not back to the 1950s but back to the 1970s.
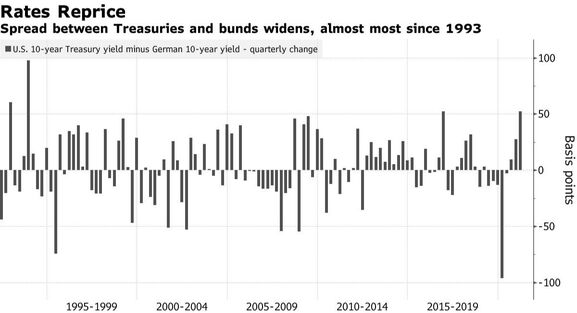
We see the USA as on a tightrope. One side is uncontrolled inflation as ZIRP + SPURGE are implemented but the productivity boost never happens, and the other side is bad or compromised legislation and no real fiscal boost but only more ZIRP which continues to fail Main Street. Rebuilding and recalibrating wages vs profits is essential for social cohesion so we like the fiscal plans – assuming SOME of it actually gets to where it should go. However, if inflation becomes even more visible than it is now and the Fed can’t ‘jawbone’ and persuade people to relax about the ‘temporary’ spike in inflation (eh? Ed), then treasury auctions become difficult. It was a poor treasury auction of 7-year notes that created the sell-off in Q1 and there are quite a few auctions coming up! If the long bond sells off too aggressively, we have the topic of yield curve suppression back again which is essentially capital controls.
Why?
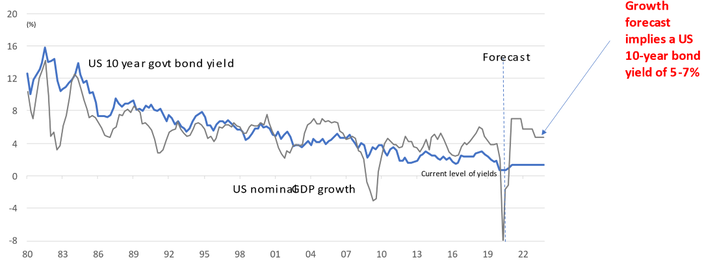
At 100% debt to GDP, a 10-year note at 3% costs 3% of GDP just to service the debt. So that possibly won’t be allowed to happen? (For those of who think years and years of ZIRP and QE was a good idea, USA debt to GDP was about 50% in 2008. In other words you haven’t got a lot for your money.) Chairman Powell has subtly so far NOT mentioned YCC but if that long bond rises to the same percentage as nominal GDP, as it typically does, then watch out.
US Inflation will be a ‘shock’ based on this disconnect
Source: Bloomberg, Delft estimates
If the $4tn+ investment doesn’t happen, then ZIRP on its own will continue to fail Main Street and we have louder grumblings and more left wing populism. In Albany, the New York State government recently passed tax increases which take NY taxes above those of California. There are rumblings about imposing a state exit tax as folks continue to move South and East to lower tax states. This cry for a re-set has just started.
So, how to pay for it?
The USA budget deficit this year could be anything from 10-17% of GDP and it is highly likely that foreigners will have to buy some bonds since the US domestic savings pool is not big enough. To that end the rise in longer US rates relative to foreign rates is very helpful and a master stroke by the Fed.
Source: Bloomberg
Corporate tax rates are going up too and fiscal drag will also be used to raise taxes on the individual. We have loved the rallying cry to pay more tax at the higher rates, by the CEOs whose last few years have been spent aggressively minimising their global tax burden! Chutzpah.
Nonetheless, deficits will increase and you won’t be repaid as a debt holder in 2021 dollars when you redeem your bonds in a few years. Inflation has been mandated.
Here is what we are considering as investors:
Cash is expensive. You will lose more by timing the markets in and out of cash, than by being diversified in risk assets
Long term bonds will probably come under more pressure but if they hit 3% then they are attractive
Corporate credit will do well as growth is run hot – we especially like Asian credit where the Chinese have begun to tighten, allow property loan defaults and generally restrained the potential consumer speculations they mistakenly allowed in the past. E.g. Ant Financial being regulated.
Infrastructure equities – there is a LOT of technology in building a nation’s capital stock and connecting renewable energy to the grid, for example, is not straightforward but a speciality of companies like Quanta (PWR.NYSE) which we have owned for a while. Not as cheap as it was but as cheap as Facebook and it performs a (more?) useful service, so good on the ESG dimension.
Clean energy companies like AES (AES.NYSE), NextEra Energy (NEE.ASX), TransAlta Renewables (RNW.TSE) and Johnson Controls (JCI.NYSE) which specialises in reducing ambient heat generated by the built environment.
Industrials such as Schneider (SU.EPA), Cummins (CMI.NYSE), ABB (ABBN.SWX), Emerson Electric (EMR.NYSE), Eaton (ETN.NYSE), Ebara (6361.TYO)
Materials companies – BHP (BHP.ASX), Rio Tinto (RIO.ASX), CRH (CRH.LON), Heidelberg Cement (HEI.ETR), Anhui Conch Cement (600585.SHA), China Lesso (2128.HKG)
True technology especially in the SPE space such as Advantest (6857.TYO), NXP Semiconductors (NXPI.NASDAQ), KLA (KLAC.NASDAQ)
Smaller Asia companies are particularly attractive relative to elsewhere – cheap, growing and with better governance. We have an Asia Small Companies strategy which has been running for over three years now
Every generation sees certain trends that go beyond the cyclical. Trends that encapsulate a fundamental change to the way things are done. When we say secular growth, we are referring to structural changes taking place in the economy; from e-commerce fundamentally changing the ways in which people shop to QE that has ushered in a decade long growth story in equities, in particular the higher growth names. In this piece we want to put forward a few such trends that are likely to fundamentally shift both the economic and investment landscape over the next ten to twenty years.
Author: Sid Rutalla
Before we proceed further, there are a few things to bear in mind. Secular growth does not mean irrespective of market environment. E-commerce and information technologies did undoubtedly change the way we do business, but that doesn’t necessarily mean buying Microsoft in the 2000 would have been a particularly great investment and remember that markets do create excesses, as pets.com did. Or for the history buffs, the tulip mania of 1637.
So, without further ado, what are the three secular growth stories that we think will fundamentally shift the way our planet (and investment markets) look over the coming decades?
Mobility & The Future of Transportation
For those of you that aren’t aware, this is one area that we feel is about to change and do so at a rapid rate. A technological revolution quite on par with Ford’s mass production during the infancy of automobile commercialisation. In our view, the changes taking place in Mobility can be schematised under four aspects 1) electrification; 2) autonomy; 3) connectivity and 4) shared mobility.
This is the beginning of an ecosystem, enabled and advanced as a matter of policy across most of the developed and developing worlds. While adoption might be at differing stages depending on context, there is a marked incentive for governments across the planet to adopt the technologies and commercialise quickly, especially on the electrification front. Ranging from the more aggressive targets set by regions like the EU, who as a matter of broader climate policy aim to move towards a ban of new combustion engine sales to the more aggressive outright ban of all combustion engines. The case is similar across densely populated South East Asia and the broader APAC region whose population density and energy dependence create an immense desire from governments to adopt more aggressive policies.
Take India as a prime example. The government and policy makers are not only considering a ban of new sales (as is the case in the UK) but rather an outright ban, how this will be implemented in practise is still somewhat of a question mark though. Nevertheless, that nation’s reliance on energy imports (its economic fortunes are arguably dependent upon the price of oil) make it imperative to transition towards more sustainable transportation methods. The case is similar across China, whose battle with pollution across the major cities is well documented. China has become the largest EV market in the world as of last year with government policy supporting and subsidizing the still nascent industry.
Porsche Mission E concept car, 2015
Mobility is also one area that happens to be central to Industry 4.0, an area that will see nations compete as a matter of both economic and national security. Thinking about the autonomy aspect, what do autonomous truck fleets mean for delivery and logistics going forward? Autonomous cars could mean an extra hour of productivity in the day for commuters. The potential benefits of autonomous vehicles are obvious but that’s not to say there aren’t roadblocks. The biggest concern we come across when talking to people about TAMIM’s Global Mobility strategy is the viability of autonomous vehicles, more specifically their general safety at this stage and the “Trolley Problem”. Simply put, what does the car do when forced to choose between protecting the passenger or protecting a pedestrian? The other side of this is the liability problem; who is liable in the event of a collision if no one in the cars were in control? Many people, somewhat understandably, see this as a major issue to the rollout of autonomous vehicles. But, guess what. Waymo, an Alphabet (GOOGL.NASDAQ, owned) subsidiary, operates a commercial self-driving taxi service in Phoenix, Arizona called “Waymo One”. Since the back end of last year it has operated without a safety driver. It’s already here. Waymo is developing its technology for the delivery and logistics side too and has partnerships with a number of vehicle manufacturers to integrate their technology. Here we are talking about the likes of Volvo, Nissan-Renault, Daimler AG, Fiat Chrysler, and Jaguar Land Rover. The name Waymo itself is derived from their mission to find “a new way forward in mobility.” Waymo is just one of many companies making strides in this area (sometimes being backed by the goliath that is Google/Alphabet helps); Drive.ai (an Apple subsidiary) is well underway, the Mercedes-Benz S-Class (W223) launched last year with software ready to be downloaded as soon as laws permit Level 3 ALKS (Automated Lane Keeping Systems) and Tesla maintains that all of its releases are built with the hardware for the highest level of safety (SAE’s Level 5 – essentially meaning a steering wheel is entirely optional). As a side note, the autonomy of a horse was once seen (by some) as a positive over early motor cars. A hundred-odd years later, give or take a decade, we are having the same conversations about fuel, costs, and safety while on the verge of the next leap in transport and mobility.
Winton, January 24, 1903
\
Shared mobility is arguably the furthest along of the four aspects we mentioned above. One just needs to look at ride sharing companies like Uber, Lyft, Ola etc. One just needs to extrapolate from where we are now to see the potential opportunities. Do these companies end up running their own autonomous fleets? In a similar fashion to Blockbuster vs streaming companies like Netflix, do these companies die because they are replaced by subscription services offered by automakers? By that we mean it is possible that, in future, you end up having a Daimler subscription and you order a car from their fleet when and if you need the Merc. If this is the case and car ownership plunges, then what happens to auto insurers? This is a nebulous area with plenty to play out and the opportunities for both long and short positions will be extremely interesting to monitor, precisely why our Global Mobility portfolio can take both long and short positions.
If all this is still not enough, below are a few figures that might help make up your mind:
2025, 2026, 2027 – The years in which, Norway, Belgium and Austria respectively are introducing bans on non-electric vehicles with differences across sectors. For example, the scope for Belgium only extends to new company cars.
2030 – The year in which the UK is proposing to ban outright the sale of fossil fuels based automobiles. India has gone further in targeting not only a ban of new vehicles but an outright ban.
2050 – The year at which the EU proposes to achieve a net-zero carbon target. With 2040 being the more aggressive base case in order to meet the targets set in the Paris Climate Agreement.
With the US set to rejoin the Paris agreement, we see a marked incentive for that particular market to phase out fossil fuels based automobiles sooner than later (though we wouldn’t count on an outright ban stateside, maybe a tax on non-EV vehicle sales?).
€5 billion – The amount of direct subsidies offered by Germany alone for auto-manufacturers to go renewable. We will continue to see more incentives within the bloc towards enabling and fast tracking the move towards EV, which remains a key pillar to achieve a net-zero carbon economy.
The largest automotive market in the world, China, is currently undertaking a research timetable for an outright ban.
€20 billion – The amount of penalties that automakers face going into 2021 if they don’t meet new stringent CO2 emission targets.
$2.5 trillion – The minimum value of the new ecosystem of businesses and services that are emerging within the segment by 2030.
$8 – 10 trillion – The overall opportunity set over the next 50 years.
62% – The percentage of automotives that are used as Robo-Taxis in China (think again about traditional automobile sales and private ownership).
$1.1 trillion – The most conservative projection for market revenues generated by mobility services in China
So how do you play this?
As an investor, the best way to describe what is at play here is that it is analogous to the smartphone market in its infancy. Hindsight is an interesting thing for the investor, we would all love to say that we could have predicted Apple’s future market share and success back in the early 2000s. However, in that particular year, the mobile phone market was dominated by Nokia and Blackberry. The key is to understand that in a dynamic industry, perhaps the best way to invest is not to necessarily pick the winner of the final product but to make bets across the entire ecosystem.
After all, Apple did create a trillion dollar ecosystem ranging from semiconductors to third party component manufacturers including the likes of FoxConn, otherwise known as the Taiwanese listed Hon Hai Precision Industry. In a similar manner, mobility and the vehicle market is not only predicated on EVs per se but the software that is key to autonomous driving, the chips that go into the end product, the platform that is required to build out an increasingly autonomous and self-governing transportation network. Some winners that exemplify what we have been investing into are companies such as NXP Semiconductors (NXPI.NASDAQ) and Corning Glass (GLW.NYSE) who also happen to manufacture the gorilla glass that goes into the majority of modern smartphones, including the iPhone. Take a look at what has happened with Lithium prices and the companies that extract it in recent years, electric vehicles need batteries. This also ties in with infrastructure in the form of energy and renewables but, that said, we are a little bearish on lithium as we think the boom is mostly priced in now. You have to think blue jeans to miners in this space, not just Tesla (not currently owned in our Global Mobility strategy).
Within autonomy and sharing, companies include both traditional ridesharing platforms and e-commerce companies such as Just Eat Takeaway are particularly interesting for us. When it comes to autonomy, you will also want to research companies that are involved in things like LiDAR (light detection and ranging), RADAR, IMUs and odometry technology. Across both autonomy and sharing, cyber security will be a critical element and is well worth looking into (in today’s digital world, this is going to apply to all three thematics we are discussing). None of these aspects of mobility operate in a vacuum and we will see increasing M&A activity within the space with some of the more niche players being bought out by larger players. Take MobileEye, for example, which was bought out by Intel (owned) in the largest acquisition in the space to date. Additional firms that look particularly attractive from a listed space include UK based Aptiv, Alphabet, Baidu (for geographic diversification) and GM (owned). Another allocation that looks particularly attractive as the field consolidates is VC, in particular companies with unique ideas that target specific niches and look attractive from a takeover perspective. Many of the companies pioneering these technologies never make it to listing as the Googles and Apples of the world voraciously snap them up. One nation that is at the forefront when it comes to this space is Israel where we have historically been invested and continue to.
In addition to the above, we see an increasing scope for added investment returns by diversifying across geographies given the politically sensitive nature of this particular thematic. In fact investors in companies such VUL.ASX (Vulcan) would’ve seen astronomical returns that are in no small part to do with geographic and EU oriented supply-chains. We will similarly see additional barriers created and re-localization of supply chains which, while pushing upward pressure on manufacturing costs, could also see supply chains and profits protected. The best position for the discerning investor in our view is to bet on both sides. Irrespective of who wins or the future, the medium term should see capital benefiting from economic rent-seeking by portfolio companies.
Regardless of if you are bearish on any one of the four aspects mentioned above, this is a space undergoing a transformational period. That is, if you don’t believe autonomous vehicles are viable, electrification of mobility is already underway and being legislated. This is a space everyone should consider for inclusion in a well rounded portfolio. The roll out of the next generation of automobiles will require an element of adjustment (roads, storage, charging etc) that ties in nicely with our next theme…
Infrastructure
Coming back to the topic of fiscal led growth, we arrive at our next thematic: infrastructure. What covid-19 has brought about (for better or worse) is fiscal deficits and questions of budgetary prudence taking a backseat. Across the planet, governments have continued to add more debt as a percentage of GDP than in the decade following the last crisis (GFC). This is a scenario that was a direct result of the extraordinary measures undertaken as a result of covid and we are not likely to see this reset perhaps as a result of path dependence. A significant aspect of spending going forward will be in critical components such as infrastructure. Indeed, this is one aspect that seems to have some much needed consensus across the aisle in the US and around the world.
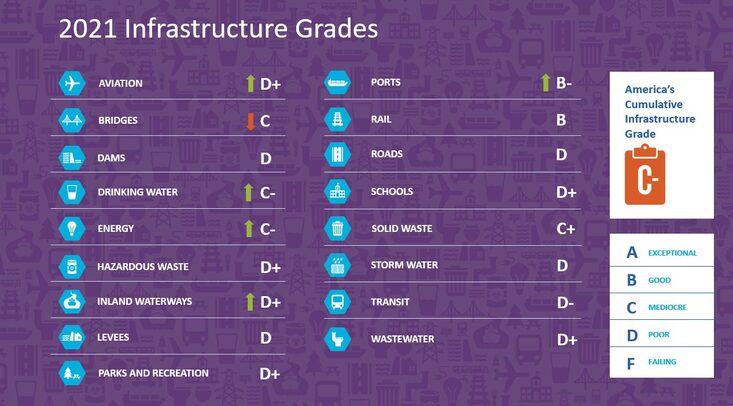
Take a look at the below graphic from the American Society of Civil Engineers who, amongst other things, grade the US’ infrastructure every four years. This graphic is a favourite of our own Robert Swift who sees it as a perfect illustration of the thesis underpinning his Infrastructure portfolio and elements of our Global High Conviction strategy.
Source: ASCE
Indeed, under current estimates, the infrastructure deficit over the next decade (if the current pre-covid trajectory was being kept) is set to grow to $15tn USD. That is, there is a differential of 15tn from what is required in order to maintain and keep up with population growth. One of the silver linings of covid, in a perverse manner, has been to make it easier for nations and policy makers to use this period as an excuse to expand budgets and tackle some of these challenges. The proportion of government expenditure (as a percentage of GDP) is likely to continue to grow with a substantial amount going towards direct stimulus.
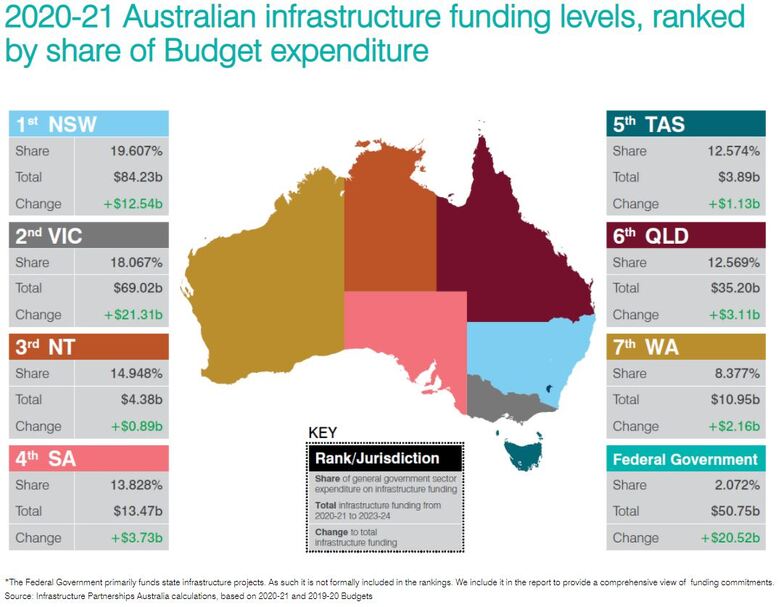
Looking locally, the below graphic from Infrastructure Partnerships Australia illustrates the opportunity nicely. Notice the sheer scale of the increases in spending; also worth noting is that the totals provided here are for spending from 2020-21 to 2023-24, not even the 10+ year timeframe we are looking at with these thematics. Take a look (see here) at the projects included in the Federal Government’s land transport infrastructure program ($110bn over the next ten years).
Source: IPA
Within this space, there will be certain nuances though. Whereas developed countries might see greater emphasis upon upgrading the telecommunications and ailing road infrastructure (both sorely needed in Australia), we will see increased emphasis placed upon rail and energy storage (there’s those batteries again) in developing markets across Asia and Africa. A key aspect of our own exposure comes from companies like Verizon (VZ.NYSE, telecommunications), China Water Affairs (0855.HKG) and China Lesso (02128.HKG, a PVC pipe manufacturer). The obvious play on this thematic is companies that will be getting the construction work but we feel this a bit of a trap, this places entirely too much reliance on winning contracts for our liking. Much the same with picking the ultimate finished product winners of the mobility segment, you’re far better placing diversified bets across the entire space, up and down the supply chain.
Similarly, we also make the call that infrastructure is likely to play a greater role in global geopolitics. We have already seen increasingly ambitious projects by China such as the One Belt and One Road (OBOR) plan. OBOR has a considerable amount of its reason for existence rooted firstly in managing the de-industrialisation process that is likely to take place as its China’s populace continues to age and move up the wage curve (i.e. older industries are likely to transition towards South East Asia in search of lower labor costs) and secondly to extend Chinese influence outwards in order to maintain its own economic and protein supply chains. Take the case of energy. As the largest importer of oil, China faces what has been termed the ‘Malacca Dilemma’ which essentially refers to the fact that over 80% of her energy imports pass through the Straits of Malacca and, should instability occur in the region by a state or non-state actor, it could effectively paralyse the Chinese economy. A key rationale behind ambitious projects such as CPEC (China-Pakistan Economic Corridor) is to safeguard China’s strategic interests for imports from EMEA (Europe, the Middle East and Africa). By the way, these strategic imperatives have a large part in explaining the increasingly aggressive stances taken in the South China Sea. For the investors, one must also remember that this creates immense opportunities to profit, including exposure via Chinese infrastructure companies such as China Merchant Port Holdings (0144.KKG), China Railway Group (0390.HKG & 601390.SHA) and the inputs that go into it. For the Australian investors (iron ore or copper anyone?) companies such as BHP and Rio, we feel, have continued potential in what could be a multi-decade commodities boom.
On the other side, we are likely to see a counteraction to this by Western competitors. The Trans-Pacific Partnership was supposed to be a counterpoint to China’s plans before the Trump Administration pulled the US out. A significant aspect of the TPP was to build out energy infrastructure. We are likely to see increased cooperation from the US, as they seek to re-engage, and from a freshly independent UK (i.e. they need to find alternative trade partners following Brexit). Renewables are also likely to play a greater role in energy infrastructure and a changing energy mix is likely to be a priority role under the Biden administration. Closer to home, and regardless of the current government’s attitude, we are starting to see the established player pivot to this reality. Just this month Andrew “Twiggy” Forrest, founder and chairman of iron ore miner Fortescue Metals Group (FMG.ASX), brought Fortescue’s net-zero emissions target to 2030, a reduction of ten years and twenty years ahead of other larger miners. Part of this project is exploring the use of green hydrogen instead of coal in producing steel. Fortescue plans to develop green electricity, hydrogen and ammonia projects through subsidiary Fortescue Future Industries, chaired in Australia by Malcolm Turnbull. Australia itself, which has (in)famously refused to commit to zero emissions targets, is investing $300 million into hydrogen.
Across Asia, we have also seen China and India take great pains to implement policies pushing green infrastructure. For TAMIM, we still remain underweight India due to issues around access and equity market valuations, companies like L&T (LT.NSE) nevertheless look particularly attractive for those who are interested. Similarly stateside look to companies, even utilities (another favourite of Robert Swift), that are actively moving towards a greener energy mix such as Nextera Energy (NEE.NYSE, owned). For greater geographic exposure, research Canadian listed Brookfield Infrastructure (BIP.UN.TSX & BIP.NYSE), though the company has been trading at a considerable premium. For more growth exposure, Enphase Energy (ENPH.NASDAQ), which designs and manufactures software-driven solar energy solutions, may be worth looking into.
Domestically, our strategy has been to avoid top end players such as Transurban or Telstra but rather to focus upon niches such as Uniti Wireless (UWL.ASX, owned) which we consider to be a more credible alternative to the government run NBN. Tangentially, you also want to think about other players in the digital/data/IT infrastructure space. Our own Ron Shamgar likes Spirit Technology Solutions (ST1.ASX, owned) as a modern IT services and telco provider mostly to SMEs and corporate/government clients. Interestingly, ST1 entered the cyber security space at the tail end of 2020 via a pair of acquisitions (remember, cyber security will be critical for most industries going forward). Empired (EPD.ASX, owned) is another IT services company Ron currently favours. For utilities, we prefer the likes of Origin (ORG.ASX, owned) over AGL (AGL.ASX) despite the relatively cheaper valuation when it comes to AGL, the legacy coal business being a headache from a valuation perspective as much of institutional flows are diverted to renewables (which has the added problem off adding upward pressure on the cost of capital).
Digital Banking & Payment
This is one theme that we are quite sure many people would have an immense amount of fatigue hearing about so we’ll keep it relatively brief. Nevertheless, it remains an area that will likely see continued growth. New payment methods, such as BNPL, have managed to generate phenomenal profits for Australian investors over the last half-decade. Luckily for us, Australia has been used as a guinea pig of sorts for these products before they are rolled out to the rest of the world. But where to next?
The world continues to move away from traditional cash and even the use of credit cards in payments transactions. New and creative solutions such as EML’s (EML.ASX, owned) VAN (Virtual Account Numbers) will continue to take market share from more traditional players. Along with niche providers, such as SMP (SMP.ASX, owned), that offer the more traditional terminals will offer significant growth potential to investors domestically. SMP recently caught a break with competitor Tyro’s (TYR.ASX) EFTPOS terminals experiencing major issues, also underscoring the importance of the infrastructure and technology underpinning these processes.
On a global level, we think BNPL remains very much in its infancy (remember Australia’s guinea pig status here). Sezzle (SZL.ASX, previously owned) remains our favourite when it comes to the US and Paypal is likely to make some headway given its recent entry into the market. Its ownership of p2p payments app Venmo and Honey Science give that particular business an edge in reaching to audiences that wouldn’t otherwise be reached. Square (SQ.NYSE), also a payment terminal provider, remains a service provider to federal stimulus payments (a decent business that we feel will likely continue to grow over the coming years, somehow we doubt this is the last set of stimulus measures we will see). Its cash app combines a digital wallet and enables p2p and b2b transactions.
The most obvious risk in this space is regulation. Regulation is usually lagging and done post hoc, the segment is entering this phase. This type of thing will dictate the future prospects of the segment but you can rest assured, there will be winners coming out of this and, with global expansion or takeovers, there could be plenty of profit yet to be made for investors. For even greater growth exposure, continue to watch the Chinese regulatory approach with regards to Alibaba (owned) (the stake in Ant Financial makes it a rather attractive prospect). Ant Financial, by the way, also has investments in Paytm, India’s second largest payments provider after PayPal. There will likely be certain markets that don’t even let things like BNPL take hold, here we are thinking the likes of India, but that is the draconian end of regulation.
It would be remiss of us not to at least mention the crypto space when talking about digital banking and payments undergoing change. That is only to say that there is definitely something happening there and it appears to be here to stay. Whether it is one of the established tokens or the technology/concepts underpinning them, there is a potentially transformational element sitting in amongst the noise somewhere. While big institutions are beginning to allocate to things like BTC, regulation is once again a big risk over the next few years. It remains a big question mark for us but definitely interesting to watch.
Conclusion
Ultimately, these three themes should see secular growth over the next ten to twenty years. Regardless of where we are at in the economic cycle, the changes happening in the mobility space will be going ahead. The beauty of this theme is that there are enough aspects under the mobility umbrella that it will see growth regardless of the issues currently facing any one of electrification, autonomy, connectivity and ride sharing. And that’s the pessimistic view. Optimistically, you only have to consider the tailwinds currently in place thanks to government legislation to see the upside. The infrastructure theme is primed because we are currently sitting in a perfect storm; a trifecta of “developing” nations still building out theirs, “developed” nations updating theirs and massive stimulus due to a global crisis accelerating everyone’s timeline. The digital banking and payments theme is probably the furthest along in terms of its development and as such we are currently looking closely at imminent changes to regulations, it is a space that has massive potential opportunities when it comes to global expansion and takeovers but much will be dependent on that.
Interestingly, you may also have noticed a few common considerations across all of these themes. First, the risk of regulation and policy. This will happen. The next generation of cars will be regulated and legislated, infrastructure policy around the world will vary with the geopolitical situation and the payments space is always being regulated to catch up with the latest innovation, BNPL is up next. On the positive side, there will be certain plays one can make that sit across all of these and cyber security comes to mind. No one wants their electric and/or autonomous car hacked and in someone else’s control, infrastructure includes massive amounts of telecommunication and data and cyber security has always been at the fore when it comes to banking and payments.
Ron Shamgar takes stock after yet another busy reporting season, looks at his portfolio and gives us three brief highlights from the recent results.
Author Ron Shamgar
Reporting season wrapped up on Friday and for us it was mostly a positive set of results. It was worth noting that a feature was companies significantly cutting their overheads and finding more efficient ways to do business in light of covid restrictions. As a result, first half profitability and cash flows were strong and this translated to higher dividend payments which will flow to investors in the next few weeks. Currency was another feature where importers, like retailers, are benefiting from higher gross margins whereas offshore earners are seeing some headwinds.
For our portfolio, there were three highlights in particular from these results:
EML Payments (EML.ASX) results were in line with analyst expectations and probably disappointed the short sellers betting against the company. Cash flows were incredibly strong and they have $136m to deploy on acquisitions. EML showed investors the diversity and resilience in the business and that it is no longer reliant on gift card sales in shopping malls. The biggest surprise was the pipeline of new business, growing to over 400 programs.
Management quantified win rates of 40%, which is $8bn of new deals every year and should be replicable for the next few years. That is a huge runway of growth on the current $20bn of debit volume they will process this year. Finally, EML is in line to win government stimulus disbursements programs. If announced to the market, this could take the share price closer to our valuation of $6.50 this year.
Resimac (RMC.ASX) is a leading mortgage originator in Australia, delivering an excellent result that the market, in our view, misunderstood. They are currently investing heavily in their digital capabilities and are fully expensing the spend this year. This is why profit after tax wasn’t at the top end of guidance and probably why some investors were disappointed.
For perspective, net profit after tax grew 90% to $51m and full year guidance is $105m net profit after tax. What investors are missing is that guidance doesn’t include any covid provision write back. Something which their competitor, Liberty Financial Group, already wrote back in their half year results. We believe there is an upgrade coming later this half and our valuation is $3.50
Earlypay (EPY.ASX) is an invoice financing and equipment funding business that has reported their first result as a true fintech. Unlike others in the sector, EPY is actually making real profits and paying dividends to investors. In December, 56% of new business came from their online portal Skipper, which they acquired last year. Already, in January and February, more than 76% of new business is coming from this online channel. Online on-boarding takes two days, compared to the previous system taking two weeks.
We believe that when government stimulus begins to taper off in March, many businesses will require further working capital and think that Earlypay will continue to benefit and continue to grow this year as they pick up some of the slack. We are currently forecasting FY22 net profit after tax of $14m and we value the stock at 70 cents. There is always a possibility that Scottish Pacific or Consolidated Operations Group (COG.ASX) or another player in the finance industry will make a takeover bid for Earlypay.
Disclaimer: EML, RMC and EPY are all currently held in TAMIM portfolios.