In order to achieve full autonomy in driverless cars we will need to see much more then just advanced tech in-vehicle, we will also need a significant step up in infrastructure in the cities and spaces around the vehicles. Over the next two weeks we will be talking about two stocks that are well positioned to benefit from the rollout of 5G and the need for connectivity in infrastructure to support the emerging autonomous driving sector.
Author: Adam Wolf
With rising inflation expectations and the Fed outlining their plan to hike rates before the end of 2023, markets have begun to favour value oriented stocks and brick and mortar businesses as opposed to the high growth infotech companies. As expectations of interest rate increases get priced in, it’s the companies at the high growth end, those trading at high PE multiples, that will suffer the most as their cash flows are further into the future. They are worth a lot less now with an increased discount rate as opposed to the brick-and-mortar businesses who have predictable and sustainable cash flows in the much nearer future. Another theme we have seen in the markets is the transition from covid winners to covid losers, a lot of the stocks that benefited during the pandemic lock-downs are now starting to suffer as economies open up. TAMIM’s Global Mobility fund is a long short strategy and benefits from this by seeking out pandemic losers such as delivery services and home fitness/gym equipment providers and selling them short. In turn it can take long positions in those stocks which will benefit from expectations of increasing interest rates.
Crown Castle (CCI.NYSE)
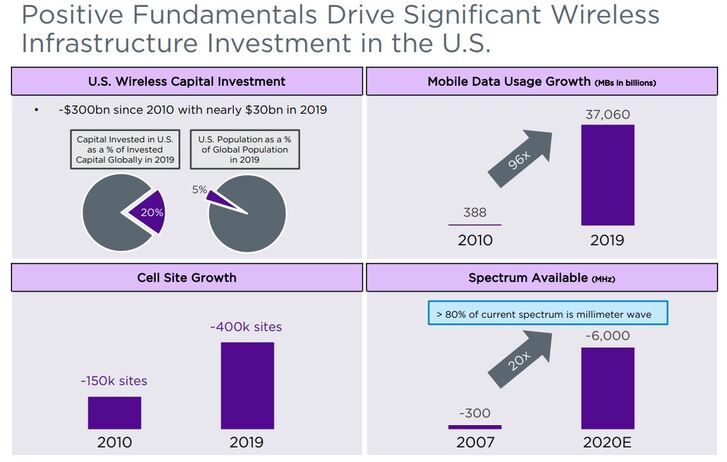
Crown Castle is a leading operator of wireless communication towers in the US and is the nation’s largest provider of towers, small cells and fibre. Crown Castle owns, operates and leases more than 40k towers and has 80k miles of fibre supporting 80k small cells across key markets in the US. In 2014 they transformed into a REIT structure which reduced their corporate tax and increased their distributions to shareholders as per requirements. Crown Castle is similar to other shared infrastructure businesses in the sense that they develope and operate highly capital intensive assets that are utilised over long periods of time and shared among multiple customers. By sharing these assets between multiple tenants customers are able to lower their costs. Crown Castle’s customers include the big four wireless carriers – AT&T, Verizon, T-mobile and Sprint – who account for the majority of their rental revenue .
Source: Crown Castle Company Overview, April 2021
Q1 2021 Key Figures
Market Cap
Q1 Rev
Div yield
Q1 EBITDA
Q1 EBITDA Margin
Net Debt
Crown Castle
$84bn
$1.48bn
2.74%
900m
60.8%
$19bn
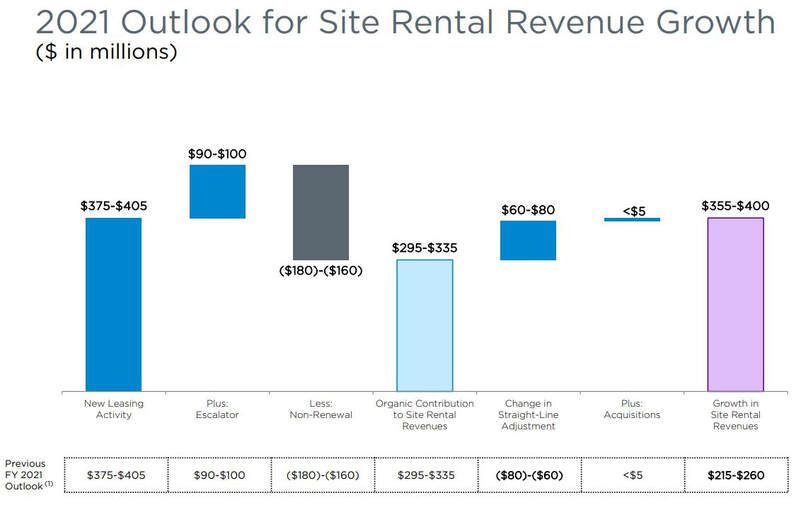
Source: Crown Castle First Quarter 2021 Earnings presentation, April 2021
5G Rollout
The rollout of the new generation of a mobile network requires significant investment in cell infrastructure and will need a denser web of transmitters as the demands of the new network are much higher. In simple terms, the biggest difference between 4G and 5G is the speed. 5G networks will be up to 100x faster than 4G. Whilst 5G doesn’t offer the same coverage capabilities, it offers far more channels for transmitting data which delivers higher bandwidth and lower latency. Each generational upgrade demands more data which is ultimately enabled by cell towers and small cells. Crown Castle’s customers are all looking to roll out 5G at scale and are investing heavily to improve and densify their networks. This is starting to drive demand in activity and leasing of Crown Castle assets. The shift from 3G to 4G was fairly stock standard as they were similar networks but the shift from 4G to 5G will be very different and a lot more complicated. It will require a lot more towers and small cells to provide this network. The biggest issue is that there currently isn’t enough infrastructure in place to do so.
Source: Ericsson Mobility Report, June 2021
How will Crown Castle perform in a high inflation environment?
When looking for companies that will outperform in inflationary periods it is important to look for companies that have considerable pricing power and a favourable debt structure. Without pricing power, companies’ margins will suffer as their cost base increases. This is likely to happen to companies that are operating in crowded markets with no competitive advantage. Another factor to look out for is the company’s debt structure, whether it’s fixed or variable. This is important as the company’s cost of capital will rise and, if their debt is on a variable rate, their interest expenses will jump. With the rollout of 5G networks there simply won’t be enough towers to distribute 5G nationwide which not only provides Crown Castle an opportunity to develop more infrastructure but also provides them with significant pricing power in terms of the rates they charge their customers for leasing those towers. Crown Castle effectively operates in an oligopoly with few competitors and high barriers to entry. Management have been actively mitigating the risk of inflation and have embedded escalators in the majority of their contracted revenue. Crown Castle have an inflation-friendly debt structure with 91% being fixed. This will protect them from rising rates as well as benefit them if high inflation occurs as they will be paying their creditors back with money that is worth less, meaning their debt will get inflated away.
Growth Strategy
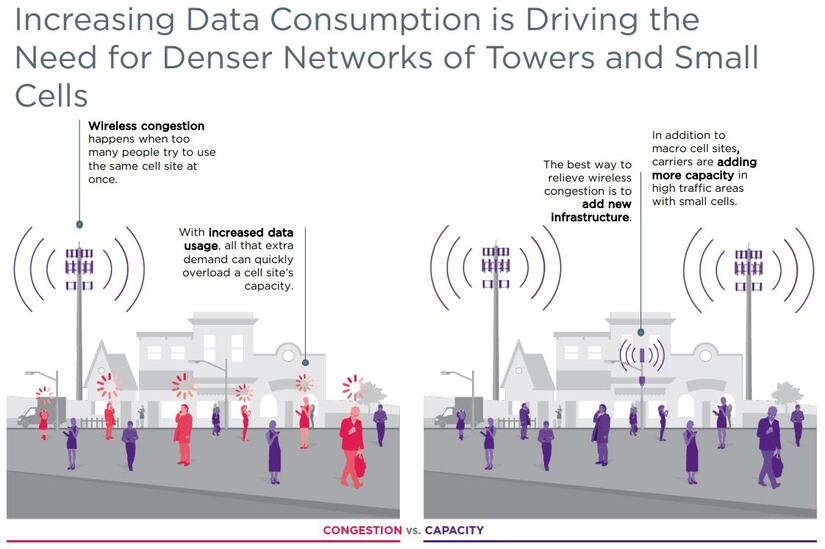
Crown Castle is at the forefront of a significant opportunity to capitalise on the rollout of 5G networks across the US. CCI’s plan to capture this market is through the development of small cells. Small cells boost coverage in a specific area and are attached to existing infrastructure such as traffic lights or street lamps through fibre optic cables. They also relieve congestion to networks, essential given the increased data usage we have seen in the US.
Source: Crown Castle Company Overview, April 2021
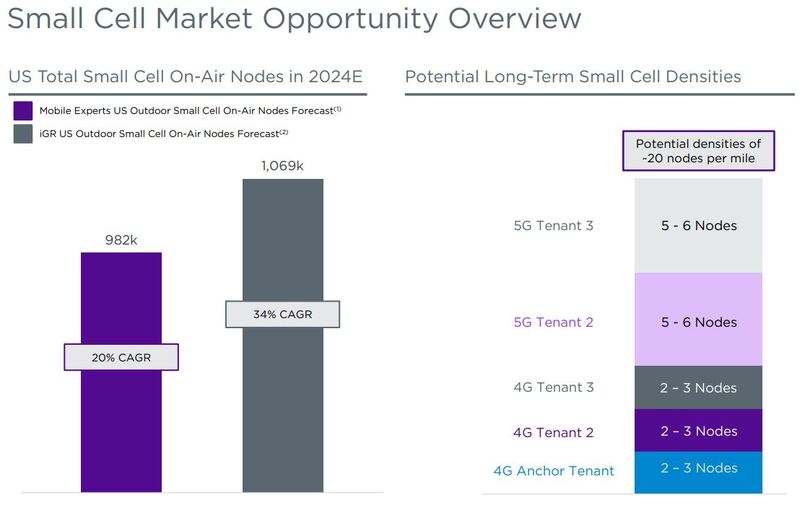
With wireless data consumption increasing exponentially there is a need for denser networks of small cells that will enable wireless carriers to deploy additional coverage and capacity on their networks; this will see small cells become a much bigger part of the network. CCI are currently deploying around 10,000 small cells a year and have invested significantly in fibre as a dual offering to customers; management can see this number increasing with demand. CCI is the only company to offer towers alongside fibre and small cells, making them best positioned to benefit from this opportunity as they can leverage their existing client base of wireless carriers.
Source: Crown Castle Company Overview, April 2021
In November 2020 Crown Castle announced a long term agreement with DISH Network Corporation which will see DISH’s network deployed across 20,000 of Crown Castle’s towers. The revenue from this deal will start to come in from the second half of this year.
Thesis
Infrastructure companies like Crown Castle are considered by some as bond proxies, providing a steady yield supported by their real assets (towers, fibre and small cells). However, Crown Castle is offering a unique opportunity to investors, a bond proxy with equities-like upside. Crown Castle are aiming to grow their dividend by 7-8% annually and, given their opportunity to benefit from the incoming rollout of 5G, this is more than achievable. Crown Castle’s revenue is largely recurring and most of that revenue is from the top carriers in the US. Crown Castle’s contracts are typically between 5-15 years and currently have $27bn in contracted customer receivables. Given that their tenants include AT&T, Verizon, T-mobile and Sprint it makes for a resilient company with sustainable cash flow from creditworthy customers. This also allows Crown Castle to access cheap credit. They have $255m in cash and $4.4bn in undrawn debt facility on their balance sheet, giving them plenty of liquidity to execute their strategy of implementing more small cells and fibre assets to roll out 5G. Given the dynamics of the cell tower industry and the limited infrastructure available, Crown Castle is also well positioned in an inflationary environment as they have sufficient pricing power and a favourable debt structure. Crown Castle will also be a winner of the ongoing emergence of autonomous vehicles with the increased need for 5G and connectivity to ensure driverless cars operate efficiently. We will delve deeper into this next week with our discussion on, Ericsson (ERIC-B.STO).
Disclaimer: Crown Castle is held as a long position in TAMIM’s Global Mobility portfolio. The TAMIM Global Mobility strategy seeks to to capitalise on the ongoing $7 trillion autonomous and electric vehicle revolution.
EML Payments provided an unexpected update in May. This announcement was regarding the Central Bank of Ireland (CBI) and their regulatory concerns around EML’s Prepaid Financial Services (PFS) subsidiary; concerns centred on potential anti-money laundering and counter terrorism breaches. Investors took the worst case scenario approach and wiped almost 50% from the EML’s valuation. We took a different approach. We spoke to management, industry insiders, other Irish regulated fintechs and examined the historic actions of the CBI when dealing with similar breaches.
We came to the conclusion that, rather than EML being in the wrong, this was a broad crackdown by the CBI and other European regulators, enforcing tighter regulations to prevent other financial services collapses and frauds like the Wirecard fiasco last year. We believe that the CBI and EML management will end up working collaboratively to improve any compliance concerns around the PFS programs.
We see the chance of a fine greater than $2-3m as very unlikely while the possibility of losing PFS’ money license is almost non-existent. We do believe that EML will have an additional compliance cost to bare and, in the worst case, they will have to relocate some programs the CBI is uncomfortable with to another regulator elsewhere in Europe.
Overall, this was an unexpected development that not many could have foreseen. We took the opportunity to double up our position around the $3.00 mark. We expect the stock to regain most of its lost value (it was trading at $5.00+ prior) once the matter is resolved over the coming weeks. On the flip side, we believe all additional costs borne by EML will reduce the earn out component of the PFS acquisition which is currently sitting at $110m. Our views and valuations have not materially changed on EML nor our views on its long-term prospects.
Smartpay (SMP.ASX)
Smartpay provides merchant terminals to small businesses in Australia and NZ. The company has a March year-end and, as such, they reported their FY21 results. Revenue was up 20% to $33.8m while EBITDA was slightly up, coming in at $7.6m. More importantly, run rate EBITDA to the end of March was $9.8m. The key growth pillar for SMP is the Australian acquiring business, as opposed to to the NZ terminals business for example, which is growing fast. Revenues for this segment of the business were up 80% to $17m and run rate revenue at the end of March sitting at $27m+ as it adds 4-5k new terminals annually.
We estimate that the company will add a further $20m+ of revenue during FY22, with about half of that dropping to the bottom line. We see EBITDA coming in at around $18m this year, which places the stock on an 11x EV/EBITDA multiple. We think 18x is a more appropriate multiple considering their growth rates, comparable peer valuations and the huge runway of growth next few years. Unfortunately, management doesn’t focus too much on investor relations. This means that the stock is very much under the radar, but hopefully not for long. We value SMP at $1.30.
Money3 (MNY.ASX)
Money3 provided a profit upgrade due to continued strong growth in loan originations in 2H. NPAT is now expected to come in at $38m, up from the $36m it was previously. MNY is benefitting from a buoyant domestic economy and consumer demand for both used and new vehicles. We don’t see this thematic changing much in the near term as international borders broadly remain closed, meaning consumer demand for domestic holiday and travel will remain. Management remains confident in its FY24 $1bn loan book target, an achievement we estimate will yield $80m NPAT.
Spirit Technology Solutions (ST1.ASX)
Spirit Technology provided a four month trading update to the end of April. Overall the update was positive; highlighting the foundation that management has built through acquisitions over the last eighteen months. These include a national brand which encompasses telco and internet solutions, cyber security, and IT services to over 10,500 businesses. In addition, the company now has 150 sales staff who are also supplemented by 350 national resellers.
The focus now is on completing the integration of all their recent acquisitions alongside proving to investors the organic growth potential in the business and their ability to win larger corporate and government deals. We estimate that ST1 is on a run rate for $150m of revenues and about $20m of EBITDA. Management is currently busy divesting ST1’s residential internet customer base and their wireless infrastructure network. We believe both asset sales will move the company into a positive net cash position which will enable larger acquisitions or merger opportunities to be explored. Our valuation is 50 cents.
RPM Group (RPM.ASX)
The RPM Group provided a Q3 trading update and Q4 forecast. For the quarter, revenues were up 59% to $14.5m while EBITDA was up 87% to $1.28m. The balance sheet has a net cash position of $4.5m. The company is focused on further acquisitions in a number of divisions; Wheels and Tyres, Mechanical Repair and Roadside. More importantly, the Q4 forecasts of $15.2m revenue and $1.5m EBITDA are on track. We believe the group is now annualising $60m in revenue and $6m of EBITDA. We expect further acquisitions to take the company to in excess of $100m revenues next year. Based on the achieving of this target, we would value RPM at $1.00.
Ive Group (IGL.ASX)
IVE provided a trading update alongside FY21 guidance of $100m underlying EBITDA and net debt of just under 1x EBITDA. The company highlighted that it continues to win and renew major customer contracts. That being said, a number of the Group’s revenue segments – travel, catalogues, exhibitions and events – continue to be at reduced levels from last year.
We expect that the company can continue to pay fully franked dividends of 14-16 cents of per annum on EPS of 20-22 cents p.a. Prior to Covid, IGL shares traded in the $2.00-$2.40 range and, on current business conditions, we believe the shares should trade at $1.80-$2.00. We bought the stock at 70 cents and, going forward, we are happy to receive our double digit return via dividends.
Earlypay (EPY.ASX)
Earlypay provided a trading update with record transaction volume of $199m in March, up 34% on the same time last year. Management reconfirmed full year guidance of $21m+ EBITDA, NPATA of $8.5m+, and a final dividend of 1.3cps+ fully-franked (2.3cps total for FY21). In addition, there have been improvements to all three warehouse facilities. This provides cost savings, greater flexibility and increased headroom which will support continued growth of EPY’s loan book.
Based on company guidance we see 2H momentum and the 2H NPATA estimate of $5m translating to a material increase in earnings for FY22; NPATA of $14m. EPY is a beneficiary of a buoyant domestic economy and demand for finance solutions from small businesses as government stimulus is no longer available. EPY’s recent capability to onboard clients online is driving growth in a larger market opportunity now more than ever alongside an ability to scale quicker with invoice financed volumes now at a run rate of $2.2bn. Our valuation of EPY is 75 cents.
Disclaimer: All stocks discussed above are owned in TAMIM portfolios.
Ron Shamgar is the portfolio manager for both the Australia All Cap and Small Cap Income unit classes of the TAMIM Fund. Both strategies utilise a combination of growth and value investing principles to achieve their objectives. Ron has been actively investing in Australia for over fifteen years.
Doing this exercise last year, we had mentioned the vulnerability of TCL to the Covid economy. While lockdowns and policy responses have made an impact, what has been pleasing was the recovery across most of the firm’s markets with perhaps the exception of Melbourne. Sydney, Montreal and Washington have seen some recovery. Importantly though, the numbers across major markets, with the exception of NSW, are still below pre-Covid (i.e. 2019) levels. Management guidance has indicated that traffic and volume is returning. This is despite changes to flexible working arrangements and the increased use of online retail (both long-term headwinds to the business). One interesting trend that we saw was that 59% of GWA (Greater Washington Area) commuters were likely to use their cars on a daily basis, a higher number by 5% from pre-pandemic levels. Combine this with record high vehicle sales and there might be more to this story than meets the eye. That is to say, are users less likely to use public transport as a result of the pandemic?
Numbers-wise, EBITDA for 1H21 continued to decline to $840m with margins also continuing to see a decline, from 75.7% to 69.0%. Revenue came in at $1.21bn, compared to $1.445bn in the same half last year. On top of this, substantial changes to the AUD have hit the bottom line quite hard with net financing costs increasing by $313m overall. However, the company has been busy with cleaning up the balance sheet and taking advantage of the low interest rate environment while it’s available (as is evident by the refinancing of WestConnex, still yet to see the reduction in net interest costs going forward). It is also good to see the potential to take on additional projects, including the expansion into Maryland. With the Biden Administration’s focus on upgrading the ailing US infrastructure system, the company is well placed to take advantage, this is likely where the next spurt of growth is to come from).
Despite TCL being, in my view, a great reflation trade especially with the recent refinancing’s taking place (where inflation would effectively act as a transfer of returns mechanism from debt holders to equity holders), the situation remains rather messy. We are not likely to see a return to profitability until mid-next year at the earliest. Would’ve liked to see more focus on the new projects in the pipeline as opposed to traffic and volume metrics which we believe the market has already priced in. That said, we are likely to see increased numbers through next year and over the next five years with dividends (assuming pre-covid payout ratios) likely to double as vaccinations are rolled out across North America and Australia. The company, while well capitalised, will also likely require further equity injections as it bids for new projects and finishes off the existing pipeline particularly in North America and especially Maryland, though some of it will be funded by further debt and prudent sale of at least half of the existing US assets.
Red Flags & Risks: Government policy across major markets, including vaccine uptake and rollout, remains the biggest risk in the near term for the company. Heavy and large trucking haulage still remains pleasantly surprising though and this should continue to grow as economies release some of the pent-up demand. Longer term, the increased use of flexible-work arrangements and de-urbanisation across the more developed markets (something which touched on last time) remains a headwind.
My Expectations: The business will focus on expanding its North American footprint going forward, the Biden Administration’s focus on infrastructure does create some tailwinds alongside increased spending in Australia. Not a buy yet as we believe the company will have to do a cap raise in the medium term in order to progress some of their more ambitious projects. This would be the time to get in.
Dividend Yield: 2.6%, assuming a share price of $14 AUD.
I personally remain of the view that the payout ratio will be consistent, the nominal dividend will remain around 40c p/s for now and should head back above 50c by 2022. Over the long-run I am quite bullish given the tailwinds and assuming leadership are prudent in their balance sheet management.
Goodman Group (GMG.ASX)
Goodman continues to interest me with its result. WIP (Work-in-Progress), which surprised me last time I undertook this exercise, came through at $8.4bn AUD for 1H21 (compared to $6.5bn last year). The more recent quarterly gave it an increase to $9.6bn (as of March). Again, a sign of future earnings growth. However, rather less pleasing was that, although development starts were significantly above long-run average levels, my expectation is that completions are substantially below (a bold move but does add some risk). Profitability-wise, the average yield of development WIP is expected to be around 6.8%, a slight but significant increase from the 6.6% previously reported.
Numbers-wise, operating profit was up 16% to $614.9m, gearing reduced to 4.5% from 7.5% and importantly a WALE of 14 years (a stellar outcome). Net debt continued to decline to $800m; a strong balance sheet with $2.3bn in available liquidity. Occupancy rates across owned property remained about 97%. Overall, Goodman has surprised on the upside, I was expecting earnings to stay muted. Granted I did not foresee a bullish property market that saw the business make revaluation gains of close to $1.3bn and the payout ratio back to pre-covid levels quicker than expected.
The company has demonstrated a great degree of resilience through Covid with over 140 transactions globally. There is no doubt that they were pushed along by a resurgent real estate market not only in Australia but across all of the markets in which they operate.
Red Flags & Risks: My biggest risk when we last visited GMG was the likely impact of Covid, this (somewhat surprisingly) appears to have been misplaced. Revaluations have been a tailwind for the business but herein lies the biggest risk going forward. That is, even though we have seen the business benefit from the segments it plays in, a change in monetary policy could be the biggest risk for the long-term investor.
My Expectations: Personally, I remain optimistic about Goodman. Management has delivered according to expectations and their portfolio looks fantastic, including the logistics business.
Dividend Yield: 1.5%, assuming a share price of $19.79 AUD.
We expect this to stay consistent through much of next year with further growth on a nominal basis likely to be in 2022. This may be unattractive for many but I would say look at it like a bond proxy (i.e. a substitute for investment-grade bonds with nominal upside even without inflation). In that context, it remains a buy for me.
Sid Ruttala continues his journey through the ASX 20. This week his notes visit and review Brambles (BXB.ASX) and Amcor (AMC.ASX). A must read for the Australian investor.
Author: Sid Ruttala
The earlier parts of Talking Top Twenty, can be found here:
Brambles continued to surprise on the upside with stellar numbers. Sales revenue for 1H21 was up 6% with underlying profit growth also up 5%. Even more pleasing was the fact that much of the growth came from cost minimisation, efficiencies and price realisation (as opposed to volume growth). The automotive segment continued to lag given Covid headwinds but this was more than compensated for within the broader retail segment as retailers increased inventory levels to keep up with elevated consumption (i.e. stay-at-home). The pandemic also handed the company a catalyst (temporary or otherwise) for CHEP, their global pooling franchise – a segment facilitating the reuse of a pool of pallets and containers.
CHEP America’s continued to deliver an increase of 8%, driven primarily by increased demand by existing customers and increased price realisation (both positives in my view, indicating strong revenue stickiness). This has largely offset the decline in the container business in both Latin and North America, standing at negative -6%. Although the increases in the pallet business is likely to be somewhat transitory, the declines in the Integrated Containers Business (IBC’s) is likely to be lifted as economies come out of lockdowns and industrial production comes back to pre-pandemic levels. This all goes to showcase the advantages of a diversified revenue stream.
Again, kudos to management for increasing efficiencies across the business and maintaining the payout ratio at 53-55% (including share buy-backs) for the foreseeable future. A blessing for the dividend starved investor. Assuming the share buybacks and payout stays consistent, the forecast Net Debt/EBITDA stands at an enviable 2.1-2.3x based on company guidance going into the new financial year. A well capitalised business. The numbers also tell the story of strong relationships with existing customers and a disciplined strategy that saw it divest of the IFCO plastics business and the CHEP recycled business. This is a management proposition.
Red Flags & Risks The big risk remains external shocks, especially with regards to the Eurozone business. The automotive numbers should, in all likelihood, come back to pre-pandemic levels and should see it compensate for some of the transitory tailwinds as a result of Covid (i.e. within the retail and consumer staples business). Nevertheless, it may pay for investors to keep a key eye on new automotive registrations and car sales within the larger Eurozone market.Another risk pertains to Brexit and, although an FTA (Free Trade Agreement) is in place, management has indicated that there is uncertainty around transport costs and border checks. To date, this has acted as a tailwind for top-line growth given the requirements for UK retailers to increase inventory. That being said, the business will require some additional investments, in the heat treating of pallets for example.
Expectations Personally, I continue to remain optimistic about the company. It may not be the sexiest of propositions but management has continued to deliver for shareholders and it remains a good risk-return proposition.
Dividend Yield
A dividend yield of 2.5%, assuming a share price of $11.31 AUD.
Amcor Plc (AMC.ASX)
This could be another reflation trade as the numbers for Amcor are likely to grow, especially within the healthcare segment, as elective surgery volumes increase back to pre-pandemic levels. With flexibles packaging remaining its biggest segment, this is where the next key catalyst is likely to come from. Nevertheless, looking at the numbers so far, sales growth came in at 0.2% with flexibles likely to come in at 0.9%. This remains a play on the bottom line rather than top line growth.
The Bemis acquisition continues to please. This is somewhat surprising in my opinion given my cynicism about serial acquirers (Amcor has made 25 acquisitions since 2010). In this instance however, the synergies seem to be showing up in the numbers. Management has indicated that it remains on track to deliver $70m USD in synergies for fiscal year ‘21 and on track to hit $180m USD by fiscal year ‘22. Scale continues to deliver for Amcor.
Drilling down further, the cost of sales (COS) and operating expenses continued to flatline, COS coming in at 79% while operating expenses came in at 10.1% (excluding R&D). This indicates that Amcor continues to face unfavourable raw material costs. The company is still trying to refocus its product mix and rigids remain a problem despite representing a declining proportion of overall revenue.
Given the level of acquisitions it is perhaps unsurprising that the company’s net debt/EBIDTA is standing at 2.9x following the Bemis acquisition. The company has received some catalysts given the low interest rate environment but we would like to see greater attention paid to 1) refinancing existing facilities; and 2) extending the duration so as to lock in the rates, especially in the likelihood of increased inflationary pressures.
Red Flags & Risks AMC is an unusually complicated company for the everyday investor to assess properly. Operations now span 43 countries with a 20% exposure to emerging markets. This makes both currency risk and geopolitical uncertainty key to evaluating the overall risks to the business. This was evident recently in their operations in Argentina where inflationary pressure and political uncertainty has made it extremely difficult to de-risk this part of the business.Expectations A complex business that will continue to behave as a defensive rather than a growth play. I still do not see any catalysts that may rerate the underlying security but, as I’ve mentioned previously, the price-action is a traders nirvana as it sticks to the $14-16 AUD mark. A strong AUD can be disproportionate in its impact upon the business but could again see opportunities arise for individual traders. You would want to know what you’re doing if you were going down this route though.
Dividend Yield Assuming a share price of $15.50 AUD, then the current yield stands at about 4.5%. On a nominal basis, our expectations are that this will go up at a high single-digit rate over the coming decade or so.
As always, do your own research before making any investment decisions.
Sid Ruttala is an investment specialist within the TAMIM business. He has been actively investing on the ASX for over a decade and has a passion for reading and all things economics, stock markets and history.
Sid Ruttala continues his journey through the ASX20. This week his notes visit and review Newcrest Mining (NCM.ASX) and Woodside Petroleum (WPL.ASX). A must read for the Australian investor.
Author: Sid Ruttala
If you have missed them, the earlier parts to Talking Top Twenty, can be found here:
Before proceeding to the numbers for Newcrest. Let me start with the disclaimer that I personally remain bullish on the yellow metal despite recent messiness in the price action. This is due to 1) inflation expectations; 2) real yields (which are arguably already negative in the US) and 3) long-term bearishness on USD (given fiscal incentives and increased debt issuance) to which it has an inverse correlation. That said, my ‘prediction’ of $3000 USD does seem some way away. It is not unfathomable however for the shiny metal to cross the $2000 USD rubicon with short-term catalysts, including the Basel III requirements that changes the treatment of gold on the balance sheets of dealer banks (transforming it into a risk-free asset so long as physical bullion is held) and making it increasingly expensive/difficult to short the market.
With all that said, we come back to NCM. Solid results so far from Newcrest with management continuing to show balance sheet discipline as well as committing to a payout ratio of 30-60% free cash flow with a minimum set at 15c per/share. Numbers-wise, AISC (all in sustaining cost) margins came in at $842/oz, up 48%, but slightly below the $862/oz it was the last time we undertook this exercise (though this can primarily be attributed to spot prices). Production for 3Q FY21 came in at 512koz, slightly below the previous quarter but primarily due to maintenance at Cadia and Lihir which was in line with my expectations. Underlying profit came in at $553m with EPS of 67.7 cps (121% higher). FCF (Free Cash Flow) came in at $439m.
From a deleveraging perspective, net debt was reduced to $330m despite the acquisition of Red Chris. To give a little context around this, debt stood at approximately $3.7bn in 2014. Looking more in-depth, production across Cadia surprised on the upside while Lihir continued to disappoint somewhat and Red Chris, with a decline of 19% in production, is still very much a work in progress (largely driven by weather events). Management has indicated that the company continues to take advantage of a buoyant copper price however, with current revenues being 29% copper and expected to be lifted to 39% by 2030.
NCM also delivered its Initial Resource Estimate for Red Chris during the quarter, with 13 MoZ of gold and 3.7Mt of copper for open pit. We expect the coming project feasibility study (PFS) by the end of September and this is likely to be a key catalyst for the underlying share price during the year. NCM, in my view, remains undervalued in comparison to its peers with the market discounting the copper mix (i.e. in comparison to ASX100 gold producers) with approximately 0.7-0.8x NAV using a spot price of 1900USD/oz.
Red Flags & Risks: I remain of the view that NCM offers a better risk-return proposition among gold majors given the reserve life of 21 years, a number significantly higher (by about 50%) than their nearest competitors in Barrick (ABX.TSE) and Newmont (NEM.NYSE). Previous concerns included cost management and operational leverage but management has been showing decent momentum in its discipline. The biggest risk going forward is macro rather than company specific. That is, the short-term volatility in both Gold and Copper markets. Jurisdictional risks are also rising, especially in terms of the exploration projects in Chile (where the tax regime is likely to change substantively), Covid-19 also put a cap on exploration, especially in Ecuador.
My Expectations: We remain optimistic about the price of gold given the global monetary and fiscal policy environment. The key catalysts are likely to come from Havieron and newsflow around the box cut excavation in Red Chris. If the current pipeline is executed correctly, production could double across both projects in the coming decade. For me, it was not a buy at the time of my previous notes but, given the current valuation, it is now a proposition worth considering.
Dividend Yield: Assuming a share price of $27.60 AUD, then the current yield stands at about 1.45%.
Woodside Petroleum (WPL.ASX)
Again, a disclaimer before proceeding further into the results. My macro view around the energy markets, and Brent in particular, is bullish. Saying that, when I previously made my predictions on the market I was expecting a recovery to $80 USD/barrel by the end of the year, even I was not expecting the recovery to be this quick. Brent futures at the time of writing are currently tracking at $71.83 USD/barrel. Granted, it has been helped in part by recent cyber-attacks across key pipelines in the US. The fact that the price action has been bullish despite Covid-related headwinds in India, the 3rd largest consumer, is a clear indication that there is significant upside before the year is out as India comes back online. India, by the way, accounts for close to 6% of global consumption because of her reliance on diesel. What surprised me however was the production stateside, which has continued unabated in the Permian Basin. We now expect supply bottlenecks to come through later than expected (i.e. due to a lack of investor appetite for financing any further higher-cost production or new exploration).
That brings us to WPL, a company that remains at the forefront of the Federal Government’s ambitions when it comes to LNG production and domestic gas supply. Numbers wise, production came in at 23.7 mmboe (millions of barrels of oil equivalent), a 5% decline but in line with expectations nevertheless. What was disappointing however was the realised sales price with nearly half the delta coming from sales volume timing (that is the hedge book). The company has in my opinion been rather too conservative in its approach. Nevertheless, revenues were up 22% QoQ to $1.2bn USD. What has been pleasing is the LNG side. Though the company has indicated a blow-out in capex, relating to the North West Shelf JV, and low-pitched legacy contracts (pertaining to the same), they have been taking advantage of higher prices across the Asian markets. Importantly, the Pluto T2 and the works across the KGP interconnecter seem to be progressing as they should, with a final investment decision to come shortly in the 2H21.
Woodside also updated Sangomar capex which was increased to $4.6bn USD (an increase of $40m), reflecting increased costs in the current operating environment. My view was that the original guidance was on the optimistic side, especially for a company known for its conservatism. Nevertheless, this is where the next set of growth for this company is likely to come from and we still remain of the conviction that management showed some substance in its acquisition from FAR and its pushing out of Lukoil. WPL maintains a strong balance sheet with Net Debt remaining at $2.5bn, likely to decrease substantially in the event of a sell-down of Pluto over the coming 24-months (WPL’s exit of the Kitimat LNG project in Canada is also likely to add another $40-50m USD profit to the balance sheet, though they have indicated that this will be excluded that in the dividend calculation. Prudent but disappointing for the short-term investor).
Red Flags & Risks: The company remains well-capitalised. Their goal of net-zero emissions by 2050 should also see it become more palatable for the ESG focussed investor and institutional flows. The bigger risk however remains short-term volatility in the price of oil and OPEC. Broadly speaking, the vaccination uptake across the bigger consumers, such as India, will be key to the future of the spot market and WPL as a result. It is a reflation trade.
My Expectations: In my previous notes I had mentioned that I would look to accumulate at anything below $20 per share, this is now anything below $25 per share. Long-term price target, assuming an oil price of $80 USD/barrel, is $45.
Dividend Yield: The yield is a solid 5.7%, assuming a share price of $24 AUD.
On a nominal basis, this is likely to stay consistent for the next 12-24 months and there is potential for significant upside thereafter.
Disclaimer: WPL is currently held in some TAMIM individually managed account (IMA) portfolios.