As is customary, every quarter our partners on the TAMIM Global Equity Growth Individually Managed Account – Calamos Investments – publish their economic outlook.
Introduction
Entering the second half of the year, market participants find themselves facing many familiar unknowns: whether the U.S. and global economies can maintain their muted pace of growth, the potential ramifications of a strong dollar, and the extent to which monetary policy can influence the markets. The political landscape remains a source of apprehension, as investors seek to understand the implications of Brexit and more broadly, global populist sentiment. Yet investor appetite for risk assets has been on the upswing. In this environment, we believe:
Despite signs of deceleration, near-term global economic expansion should continue. The pace is likely to be slow overall and uneven among countries.
Even as U.S. equities have rallied to new highs, downside risk management remains important given the political crosscurrents and macro environment.
Across asset classes, securities with higher quality attributes remain most attractive overall. Growth is likely to outperform, with select opportunities in cyclicals.
The global and U.S. economies are not facing imminent recession, but fiscal policy decisions will be crucial in defining the way forward. It will be hard to break out of a tepid-growth environment without policies and regulations that encourage entrepreneurship and responsible risk taking.
After years of aggressive monetary policy, central banks have limited room to maneuver effectively.
US Equities
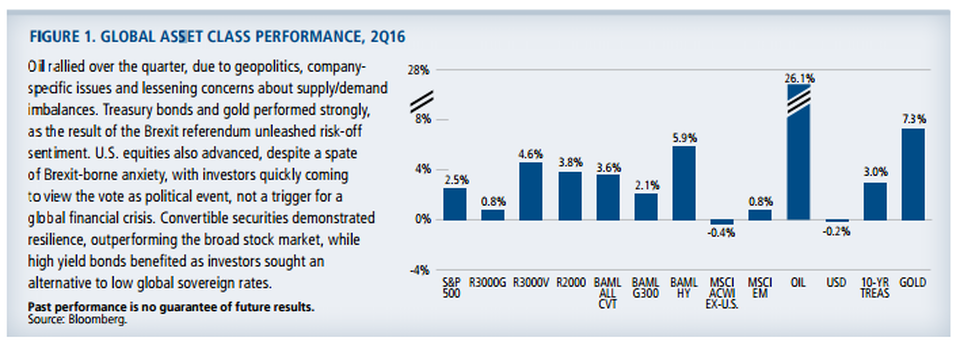
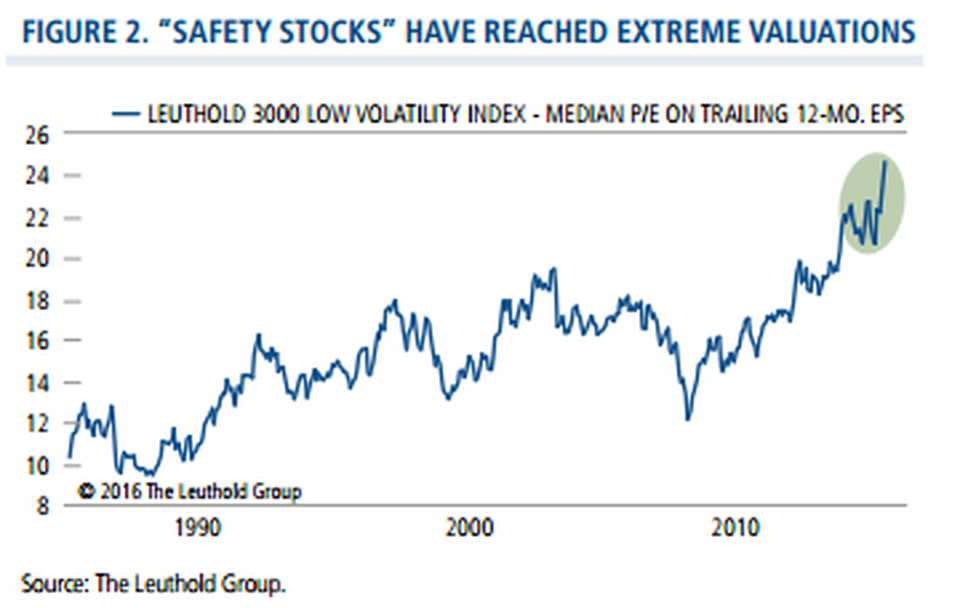
Employment and manufacturing data, as well as signs of wage growth, support our view that the U.S. economy can continue expanding at a pace consistent with recent years, albeit at a lower rate historically seen at this point of the business cycle. The direct impact of Brexit is likely to be contained and provided the dollar doesn’t spike, the U.S. economy should be able to maintain its course. We share in the view that the Federal Reserve is likely to forestall any interest rate increases for the foreseeable future, given the potential economic impact of Brexit and other related political uncertainties. The stock market is likely to remain highly sensitive to economic releases and announcements, as participants seek to make sense both of the data itself as well as how it is likely to influence Fed policy. As the next earnings announcement season commences, guidance is likely to be cautious, especially for currency-sensitive companies. We are devoting particular focus to trends in capex spending, where the impact of euro zone uncertainties is yet to be determined. Investors’ preference for cyclical stocks has faded in the wake of Brexit, with dividend-oriented stocks leading the rebound as investors seek income. However, we are concerned that many of these “safety stocks” are trading at stretched valuations (Figure 2), without offering the long-term growth characteristics we seek. Looking forward, we believe the combination of choppy global growth and lackluster yields worldwide will lead investors to increasingly differentiate between growth versus value. Conditions should support a sustained period of outperformance for U.S. growth stocks with quality attributes, albeit with opportunities for select cyclicals.
Global and International Equities
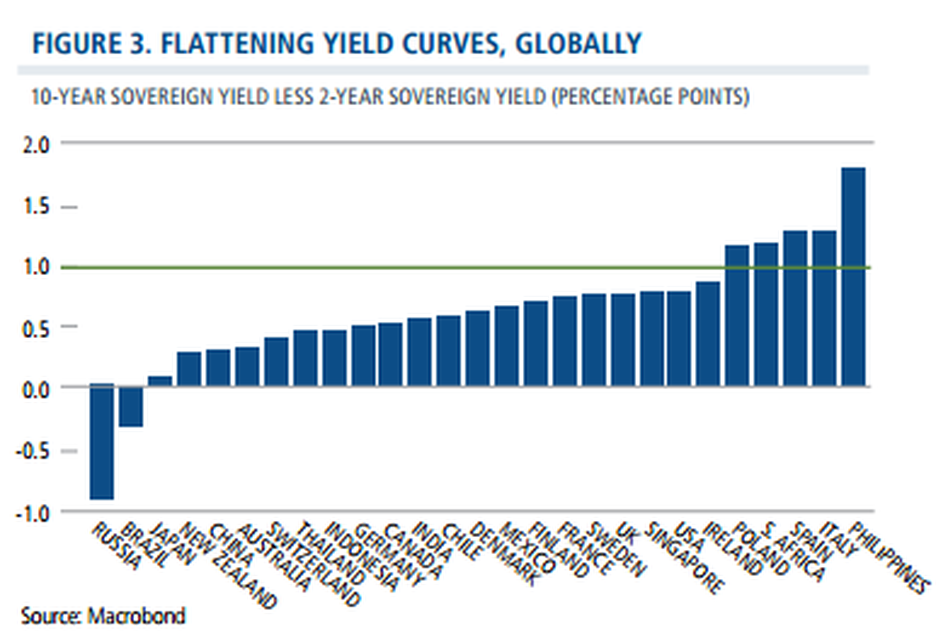
As we noted, we are not calling for a global recession, but do believe that risk management will be especially important in this environment. Although central banks remain committed to monetary policy as required, the efficacy of their actions has become increasingly uncertain. Global yield curves have become much more flat, if not inverted (Figure 3) and absolute yields continue to come down with negative yields for Japan and German 10-year sovereigns.
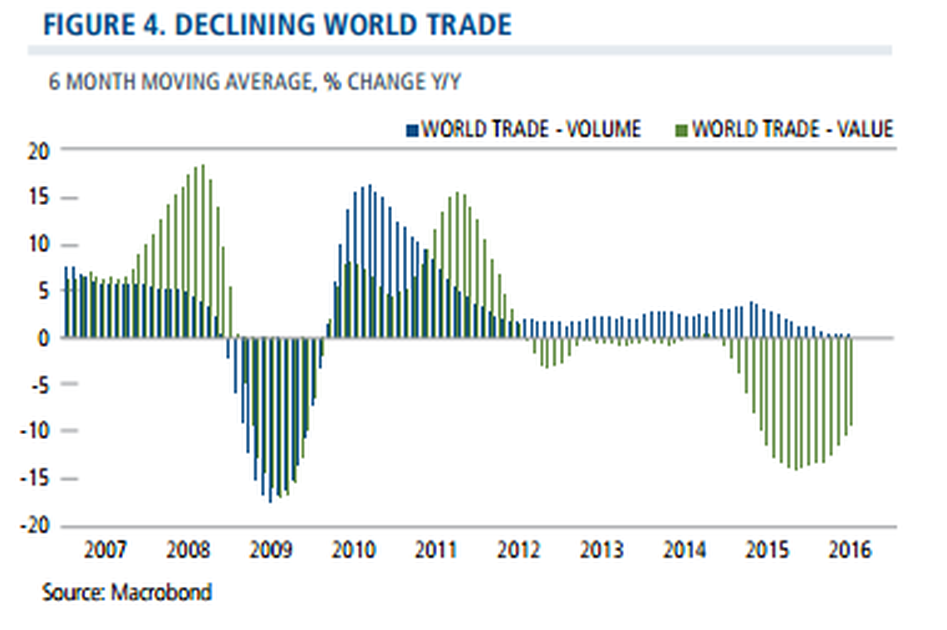
Meanwhile, muted world trade points to lower global growth (Figure 4). While Brexit is not shaping up to be the catalyst for a global financial crisis, we remain vigilant to a potential snowball effect of populist sentiment. These include already-scheduled elections and referendums, as well as calls for exit referendums in a number of other euro zone members.
However, the results of Spain’s postBrexit election suggest that populist momentum may be less than markets originally anticipated following the Brexit result, while the growing near-term economic concerns facing the UK may serve as a further deterrent. Additionally, we may see increased openness to compromises among euro zone members that give periphery countries more latitude. While we are concerned that conversations about the Italian banks haven’t gone particularly well, we are optimistic that an acceptable solution can still be reached. Our strategy in Europe has lately focused on companies with higher quality attributes, such as strong balance sheets and good returns on invested capital. While we have pared exposure to the UK and euro zone more broadly, we continue to identify opportunities in both, including technology, consumer and health care companies with well-recognized global brands and geographically diversified revenue streams. We’re more cautious on UK and euro zone companies that are more dependent on cyclical tailwinds to drive earnings growth, and those that would be more vulnerable to declining business and consumer confidence. We are maintaining exposure to European financials, but are generally underweight in banks, instead preferring beneficiaries of a low interest rate environment, such as real estate names.
In regard to Japan, economic surprises have been on the downtrend over recent months, and a strong yen is a headwind for an export-oriented economy. However, the potential for further monetary policy could help support export industries and beneficiaries of reflation, and we are more likely to see the fiscal policy we believe is essential for sustainable growth. Since the mid-February low, we have become marginally more bullish on emerging markets. Economies with lower-quality fundamentals have continued to perform well, but we remain concerned about the downside associated countries such as Russia and Brazil. We are maintaining our emphasis on countries that are less tied to commodity prices and those which are moving toward higher levels of economic freedoms. Prospects look relatively good in Indonesia and India, both of which have cut interest rates. We are also watching the Philippines with great interest, as new leadership looks set to continue with economic reforms. In regard to China, we continue to believe the government has the tools and levers it needs to prevent a hard landing in the near term. Our focus in China remains on technology and consumption, areas that we believe can benefit from the country’s transition to a more balanced consumer-driven economy.
Alternative Strategies
Volatility during the first half of the year affirmed the potential benefits of strategies that utilize complex volatility trades. For example, options-based strategies provided us with opportunities to capitalize on the conditions that the markets gave us. Given our view of continued volatility, we believe the return profiles of select alternative approaches (such as market neutral and covered call) may be compelling substitutes for traditional fixed income investments, where risk/return profiles give pause. Even though yields are low globally, interest rate risk exists in all environments, which we believe supports the case for strategies structured to avoid duration risk. Elsewhere in the alternative spectrum, long/short approaches may further overall diversification, without the associated risks of the most duration sensitive bonds.
Conclusion
We’ve seen U.S. markets reach new highs over recent days and believe there are continued opportunities for risk assets, globally. Even so, investors should remain selective and prepared for volatility. As we have observed in the past, periods of ebullience can give way to brisker sell-offs when sentiment falters. Whether markets are rising or falling, we encourage investors to let discipline, not emotion, guide decisions. By collaborating and drawing on our range of specialties, we believe our teams are well positioned to identify opportunities and manage the risks in the global economy.
This week Robert Swift, the Head of Global Equity Strategies of the TAMIM Global Equity High Conviction Individually Managed Account (IMA), discusses three key investment thematics that investors need to be aware of heading into this years US election.
This week we feature the third in a 3 series set of articles highlighting the advantages of incorporating Small Company shares in your portfolio. The fund underlying the TAMIM Australian Equity Small Cap Individually Managed Account (IMA) has returned over 32.7% in the 12 months to 30 June 2016. If you would like to discuss this IMA with one of our directors please contact us at ima@tamim.com.au. This opportunity is strictly limited to $100m to protect the portfolio’s investment style and philosophy.
Our 14 Steps to Value Investing
Value investing requires discipline and an ability to see through the noise so as to buy when others are fearful. With a good degree of self-awareness and an open mind we strongly believe it remains a superior investment strategy, and one which can lead to substantial outperformance. This article addresses key value investing terminology and strategies as an introduction to this lucrative investment approach.
Introduction:
The Intelligent Investor by Benjamin Graham remains the value investors’ key reference work 67 years after it was first published in 1949. Warren Buffett has long been a devotee of the principles in this book. The majority of value investing terminology we use today came from this book, such as:
“Investment operation” – “An investment operation is one which, upon thorough analysis, promises safety of principle and an adequate return”.
“Mr Market”: Investors should think of the market as a person, Mr Market, who is usually reasonable and offers you a price for your securities close to your view of fair value, but sometimes Mr Market becomes emotional and volatile, and becomes overly optimistic or pessimistic.
“Margin of safety” – A key tenet of value investing is the idea of factoring in a margin of safety to take into account the fact you may be wrong in your assessment of fair value. e.g. If you think a stock is worth $10, with a margin of safety you may be prepared to pay up to $7 for it. As Mr Graham explains, ”The margin of safety is the difference between the percentage rate of the earnings on the stock at the price you pay for it and the rate of interest on bonds, and that is to absorb unsatisfactory developments”.
OUR APPROACH TO VALUE INVESTING:
At TAMIM Asset Management we are passionate about value investing and believe a disciplined value investing strategy will significantly outperform the market over the long term. We search for companies where the conservatively estimated intrinsic value exceeds the share price by a sufficiently large margin that it affords a margin of safety which maximises the chance of long term outperformance. Our value investing approach is based upon fourteen investment beliefs:
1. Knowledge and expertise are more important than diversification. We believe it is more important to know a small number of companies intimately than to know very little about a lot of companies. Risk increase the more diversified you become. As a result, the TAMIM Australian Equity Small Cap IMA holds only 15 high conviction positions we know extremely well.2. The key valuation measure is cash flow, after allowance for the required capital expenditure to keep the business going over the long term. The intrinsic value will vary over time as cash-flow certainty and the discount rate change.
3. We reject the idea that risk is the standard deviation of historic returns, and believe that risk is the probabilistic assessment of something bad happening (i.e. the distribution has a single tail and is forward looking).
4. The share market can wildly mis-price companies relative to their intrinsic value but over time we believe shares prices will move towards fair value. In the short term, the share market is effectively a popularity contest, but over the long term share prices will reflect economic fundamentals. As a result we are only focused on the long term.
5. We think of ourselves are part owners of businesses. This helps us understand each business better and allows us to take the long term view required.
6. “Mr Market” should be your friend. Bi-polar “Mr Market” provides prices every day – sometimes high and sometimes low. We believe investors should exploit his moods – buy when he is down and sell when he is high. The TAMIM Australian Equity Small Cap IMA has a long term investment horizon which allows us to opportunistically profit from these mood swings.
”Have the courage of your knowledge and experience. If you have formed a conclusion from the facts and if you know your judgement is sound, act on it- even though others may hesitate or differ. You are neither right nor wrong because the crowd disagrees with you. You are right because your data and reasoning are right. Similarly, in the world of securities, courage becomes the supreme virtue after adequate knowledge and a tested judgment are at hand.” – Benjamin Graham
7. We will only invest when we have a sufficient margin of safety. This means there should be a large gap between the intrinsic value and the current share price to allow for any inaccuracies in the assessment of the intrinsic value.
8. We believe management should be invested in their businesses to ensure their interests are aligned with shareholders, and that they treat other shareholders as partners.
9. Investment opinions should be based upon a considered appraisal of a business/investment case against all known facts with the expectation that on average a superior return can be achieved. This contrasts with speculation which is short term and more akin to gambling.
“By speculating instead of investing you lower your own odds of building wealth and raise someone else’s” – Jason Zweig
10. Value investing can be applied to both low and high growth businesses; the key is to invest when the intrinsic value is well above the current share price.
11. The distinction between price, book value and intrinsic value: price is the current share price; the book value is the value of the assets minus liabilities as reported in the accounts; and the intrinsic value is the true underlying worth of the business.
12. Macroeconomic factors are very hard to forecast accurately and, given the long term nature of value investing, frequently of only limited relevance.
“The buyer of bargain issues places particular emphasis on the ability of the investment to withstand adverse developments.” – Benjamin Graham
13. Non income producing assets have no value in the value investing framework.
14. Often family companies perform well because decisions are generally made with a longer time horizon and higher level of engagement in mind.
VALUE INVESTING EXAMPLES:
Buying stocks with a strong asset backing. e.g. We bought into EZA Corp (ASX:EZA) when it was trading at a 25% discount to its net cash value. This may seem surprising but is illustrative of the inefficiencies of the smaller company universe. The stock has since been suspended from the ASX whilst management decide on an acquisition. When the stock re-lists, if a sensible acquisition is announced, we believe the stock will move to a premium to its net cash value which implies significant share appreciation from the acquisition price.
Keeping the portfolio less than fully invested (20% cash on average) in order to keep our powder dry for a market calamity, or to cover any outflows. This has served us well thus far as it allows us to profit whilst others are fearful. We expect to out-perform in falling markets as a result.
Focusing on stocks with a long history of trading so we can effectively analyse and value the businesses. We do not invest in start-ups, we only invest in well established businesses. For example, one of the fund’s top 5 positions is Fiducian (ASX: FID), a leading fund management and financial planning group. The company listed in 2000 (and was established in 1996) which provides a significant amount of data to analyse and thus value the business. As a result we have high conviction that this is an excellent long term investment.
Focusing on low PE stocks – The majority of the fund’s holding are trading on a single digit PE based upon FY16 earnings which represents a significant discount to the market average. e.g. Dental supplier, SDI (ASX: SDI), is currently trading at 8x ’16 earnings, which appears deeply under-valued for a quality international business with solid growth prospects. Investing in such low p/e stocks is a typical deep value investment strategy.
Take a long term investment horizon at the time of investment – Over the past year the fund has only sold 2 of its positions. We do what we say we do in terms of taking a long term view at the time of investment.
We do not set out to replicate the market in any way; we are aiming for significant positive absolute returns – We are completely benchmark unaware as we are looking for the most compelling smaller company opportunities across all sectors. This is how the fund out-performed the All Ords by 53% in the year to March 2016. We remain confident regarding future returns.
Conclusion:
We view true value investing as one of the most potent sources of investment out-performance available. While it is a remarkably simple investment style, it requires immense discipline, patience and dedication. We believe our investors are well placed to benefit.
This week James Williamson of the highly successful TAMIM Australian Equity Value Portfolio discusses one of his top stock picks, Royal Wolf Holdings Limited. RWH is the market leader in the sale and leasing of portable storage containers, portable building containers and freight containers to customers across 19 industries in Australia and New Zealand.
This weeks stock pick is from our TAMIM Australian Equity Value (TAEV) portfolio. The underlying fund, which is headed by James Williamson, has achieved a return after fees for investors of 13.9% over the last year, compared to a return of the ASX 300 of just 0.65%.
Stock Picking – Royal Wolf Holdings (RWH.AX)
Royal Wolf Holdings Limited is the market leader in the sale and leasing of portable storage containers, portable building containers and freight containers to customers across 19 industries in Australia and New Zealand, including councils and government departments, the farming and agricultural community, the building and construction industry, clubs and sporting associations, and the general public. Next time you walk past a container at a sporting ground, pop-up market, or the construction site at Barangaroo, keep an eye out, because you might just see a blue Royal Wolf container.
HISTORY
The history of RWH is intertwined with industry veteran Ron Valenta, the brains behind the Group’s 50.0001% shareholder, US listed General Finance Corporation (NASDAQ: GFN). Ron has served as President and Chief Executive Officer of GFN since its inception in 2005. Prior to this he was President and Chief Executive Officer of the Mobile Storage Group for 15 years, a US based portable storage company he founded. He grew the business from four containers to become the second largest domestic storage container business in the U.S. Ron also capitalised a UK business which, in 18 months, became the largest domestic storage container business in the UK. In the early 2000s, Mobile Storage Group was sold to Mobile Mini (NASDAQ:MINI), now the world’s leading provider of portable storage solutions. Royal Wolf was established in 1995 to re-sell retired marine service shipping containers as an Australian subsidiary of Triton Holdings, which at the time was one of the world’s largest lessors of marine cargo containers.In the mid-2000s, after numerous acquisitions and a management buyout, the company was reaching the limits of expansion with available funding; the interest of Ron Valenta’s GFN came at an opportune time. After 12 months of getting SEC approval, GFN acquired Royal Wolf in 2007. Ron was so eager to establish a platform in Australia from which he could consolidate the fragmented industry, similar to what he had achieved in the US and UK, that he paid 13x forward EBITDA for his stake. The company then went on an acquisition-fuelled growth spree funded from bank borrowing at a time of relaxed lending standards. As a side note, GFN had also acquired a US company called Pac Van a few months before the Global Financial Crisis (GFC), which is in the modular building industry in the Southern states of the US. The GFC hit, and this exposure caused the mother company share price to fall from over $9 to $1. Royal Wolf was still growing at this point, but the now micro-cap GFN had limited ability to raise capital. With an ugly balance sheet that included mezzanine debt and subordinated notes in US currency, Royal Wolf came to GFN with 2 alternatives: they could either pay down debt with cash flow and stop growing, or raise capital. GFN, with an 86% stake in Royal Wolf (14% owned by PE firm Bison Capital, which sold out at the IPO), decided to dilute its shareholding to 50.0001% in order to strengthen RWH’s balance sheet and accelerate growth initiatives. This brings us to the Group listing on the ASX in 2011.
RWH was floated in 2011 with a listing price of $1.83 and a lease fleet of 28,973, along with a growth story (as is normally the case with initial public offerings). For a time, the company travelled along nicely, investing significant amounts of capital to grow its lease fleet. Earnings and the share price continued to post impressive gains until the share price peaked over $3.75 in September 2013. Although RWH has a fragmented client base and diversified exposure in a number of industry sectors (more on this later), the business expansion included inroads in the resource sector with sophisticated accommodation camps made from containers. In late 2014, RWH’s earnings started to be impacted by declining demand in the resource sector and soft trading conditions in Western Australia and Queensland.
The situation was accentuated in late 2015, when it was announced that Titan Energy Services, one of RWH’s larger customers representing around 3% of sales, appointed administrators. This year RWH will generate EBITDA of ~$36m with a lease fleet over 41,000 units. In 2012 the company reported a similar level of profitability with a share price 100% higher than current levels (shares in issue have remained unchanged over this period). Furthermore, the company is carrying approximately $26m worth of idle assets (accommodation units) on the balance sheet which we expect to be sold or leased out over the short to medium term.
THE BUSINESS MODEL EXPLAINED
Royal Wolf makes most of its money by buying shipping containers from China and then leasing them for a few dollars a day as portable storage, freight and portable building units (often after some in-house design modifications).
The useful life of a standard shipping container used in portable storage can be in excess of 20 years and in many cases an old container can still be sold for up to ~70% of its original cost after this time. Furthermore, the average payback period for a leased container is typically 2.5 years. The Royal Wolf container leasing model is a challenge for
accountants as they usually make best efforts, with their policies, to smooth earnings even if in some cases it leads to a gross mismatch to the company’s underlying real cash flows from one year to the next. What really takes place is that the business model is very cash hungry for a growing lease fleet and then extremely cash generative once the growth trajectory of the lease fleet flattens; the actual maintenance capex on a standard portable storage container is negligible, and involves applying some paint and scrapping off rust every 3-5 years.To add to the confusion for some investors, every year Royal Wolf sells containers sourced from various places including second hand containers from shipping companies and from their own lease fleet, via their distribution network in Australia and New Zealand. Although selling containers generates much less profit for the Group than the leasing division, it has the added benefit of giving the company the ability to flex the size of the lease fleet each year depending on underlying demand, keeping lease utilisation rates close to optimum levels. Although it may seem counterintuitive at first, in a weak operating environment net capex for the business can be negligible, or even a positive number, as management may decide to cease buying new containers for the fleet but still sell older containers from their fleet into the market. RWH have sold at least 13,000 – 15,000 containers per year since 2002.
It is also worthwhile adding that RWH is currently operating with a young lease fleet and therefore substantial investments to maintain the current lease fleet size will not be necessary for several years. Additionally, although RWH’s debt grew during their acquisition phase after listing, it is now on a downward trajectory, being paid down by free cash flow, and any inflow from the disposal of the idle assets will go towards debt reduction.
It is also worth noting that RWH is considerably less leveraged than its international peers, which are able to borrow more given the ‘annuity like’ earnings stream from the container leasing business and the saleable asset base. Hopefully I have already given you pause for reflection when reviewing RWH’s Financial Statements. In addition to the unique nature of the business model and its cash flows, currently the disparity between free cash flow (excluding expansionary capex) and net profit after tax is further widened because included in the company’s ~$208m container hire fleet is the aforementioned $26m of idle assets earning no revenue but still contributing roughly $3m to the Group’s ~$16m annual depreciation charge. The idle assets are portable buildings and attract higher depreciation rates. With a market capitalisation of only ~$100m, a sale of these assets may add considerable upside to RWH shareholders. While our valuation is based on the strength of RWH’s normalised free cash flow generation, we view a potential sale of their idle assets as a free option.
CUSTOMERS RWH are the only firm with nationwide infrastructure in Australia and New Zealand. Currently, the company has 28 Customer Service Centre’s across two countries (20 in Australia, 8 in NZ), and the nearest competitor has 6 only in Australia, meaning RWH can move containers between locations much more freely to meet demand. RWH currently
has a sales and lease fleet of over 41,000 containers, and has grown this number from 17,000 in 2007 – at the time of the IPO, RWH’s fleet size of 29,000 was three times that of their nearest competitor. The largest scale network in the industry allows RWH to undercut other players in terms of price, and their 21,000+ customers, with only a
handful constituting ~ 3% of revenue, means their services are diversified across many industries (see breakdown below). Apart from the obvious uses in storage and freight, RWH containers are used in a variety of interesting ways, including pop-up shops/cafes, accommodation units, refrigeration and cold storage rooms, as well as blast resistant buildings and training facilities for the defence force.
THE INVESTMENT CASE
When the following stars align it is normally a good sign regarding a long term investment:
1) Low price in relation to net tangible asset value. RWH’s price to NTA is an attractive 1.1x. Normally asset rich companies have to deal with plant and equipment which may be a little out of date and no longer competitive but which cannot be economically replaced. The bulk of RWH’s assets are containers where there is a ready, active market for them, and this gives RWH the ability to adjust its capital employed depending on market conditions. Furthermore, RWH is a good business capable of generating a normalised cash (free cash flow) ROE well in excess of 10%.
2) Low price in relation to earnings. At the current price the stock is trading on a trough earnings EV/EBITDA multiple of ~6x (208/37 – FY16 Wentworth Williamson estimates) and equity to FCF multiple of ~9x (108/12.5- FY16 WW estimates). However, if we strip out the expansion capex (RWH growing in the building & construction sector from a low base with tiny market share) the equity to FCF drops to less than 6x (108/20 – WW estimates).
3) Significant ownership by an insider. RWH is 50.0001% controlled by US listed GFN and is the largest contributor to GFN profits. GFN is under the leadership of industry veteran Ron Valenta, who is also a significant shareholder in GFN.
4) An underperforming share price. The RWH share price has been one of the worst performers on the ASX, declining 51% and 61% over one year and three years respectively (as at 8th July 2016).
5) Small market capitalisation. With a market capitalisation of only ~$100m, low free float and low liquidity, RWH is not actively covered by the sell side and at present, largely ignored by most investors. Most people have never even heard of Royal Wolf, despite the company dominating market share in a number of categories in the portable storage leasing market in Australia.
The small cap team take a look at correlation when it comes to microcap investing and why stock movements in the micro cap universe are explained by stock specific factors rather than market movements.
We are often asked why micro cap funds tend to trade at such low correlations to the broader market. With market correlations as low as 0.1 (or less), some micro cap funds could be questioned regarding potential correlation data errors. However, the correlation data does not lie. In our experience, market inefficiencies are widespread in the micro cap universe reflecting low analyst research coverage, which in turn reflects the low commissions on offer for trading in these relatively illiquid stocks. Correlations this low mean the vast majority of stock movements in the micro cap universe are explained by stock specific factors rather than market movements. This is great news from a micro cap investors’ perspective. It means you can do the research on smaller companies knowing that if your investment case is correct, the stock price is likely to move dramatically in your favour as new information is digested and new investors are attracted to the stock. As long as you have an information advantage, the risk- reward equation is decidedly in your favour.
Introduction
The quest for high returns with minimal correlation to the broader equity market leads many investors to ask us why micro cap funds tend to trade at very low correlations to the broader market. Equity investors are often heavily weighted towards the larger listed companies where market correlations are generally on the high side, with most long only, large cap funds having market correlations of between 0.5 and 1.0. When these same investors see market correlations of under 0.1 for select Australian micro cap funds, they often wonder if the data is correct. It is.
What does correlation data mean?
Many industry professionals tend to look at the R squared of the relationship between two sets of data – in this case the performance of an investment fund and the performance of the All Ords. The R squared number gives you the explanatory power of the relationship between the two variables. For example, a large cap fund with a correlation (R squared) of 0.9 with the All Ords means that the fund generally tracks the broader market up and down – 90% of that fund’s historical performance can be explained by movements in the All Ords. Equally, a micro cap fund with a correlation (R squared) of 0.1 with the All Ords means that the fund performs independently of what the broader market is doing – only 10% of that fund’s historical performance can be explained by All Ords movements. The reason so many investors focus on correlation data is to gain an understanding of their exposure to equity market movements, a key piece of information, particularly in volatile or falling markets. In our experience, fund investors’ generally like to see good performance combined with low market correlation.
Low Analyst Coverage
Micro cap investing is a very different game from investing in large cap companies. In our experience, market inefficiencies are widespread in the micro cap universe reflecting very low analyst coverage, which in turn reflects the low commissions on offer for trading in these relatively illiquid stocks:
As a result, we often meet with the management teams of fascinating, high quality micro cap companies which the market is currently largely ignoring. In many cases there are no analysts at all following these stocks. In our minds this spells opportunity. This brings us to the correlation data. As the table below shows, the correlation of (global) micro caps with the broader (relevant country) equity markets is far lower for micro caps than it is for small caps or mid caps. The relationship between market cap and market efficiency is clear. And interestingly, the data show there has been an increase in the correlation of micro caps with the broader market over the past 20 years, albeit from a very low base. Small and mid cap correlations have been more stable throughout this period.
Stock Specific Factors
Correlations this low mean the vast majority of stock movements in the micro cap universe can be explained by stock specific factors rather than market movements. This is great news from a micro cap investors’ perspective. It means you can do the research on smaller companies knowing that if your investment case is correct, the stock price is likely to move dramatically in your favour as new information is digested and new investors are attracted to the stock.
A recent example of this information advantage at play was seen in Intecq Limited (ASX:ITQ), a micro cap gaming systems supplier which recently reported a half yearly result well ahead of market expectations. The stock has since rallied by some 60%. When so few people are watching, stock price movements following positive news-flow in illiquid, under-followed companies can be significant. The picture is very different in the world of larger company investing where there may be 10-20 or more analysts following a company. With this level of scrutiny all the information released by the company will have been analysed intensively by many intelligent and qualified analysts. The chances of this many analysts missing something of real importance is far lower, and thus the market is far more likely to be efficient at pricing in all the relevant information. This leaves larger companies more exposed to market movements as the primary driver of stock performance.
We expect micro cap correlations to remain well below those of larger companies looking forward. The Fund underlying the TAMIM Australian Equity Small Cap IMA has a correlation with the All Ords since launch of only 0.02 (2% of performance to date can be explained by All Ords movements). We expect it to remain on the low side since we focus on investing in cheap, undiscovered stocks. Over the long term it seems prudent to assume that more investors will become interested in micro cap investing given the superior risk-reward dynamic on offer at present. However, it will be many decades before the considerable information advantage available to micro cap investors is significantly eroded. In the meantime, we will continue to enjoy the opportunities on offer.