This week Guy Carson provides his take on the active vs. passive management debate. Should it even be a debate?
A Broken Index: Why investors should seek true active management in Australia
Guy Carson
Recently Warren Buffett made headlines across the globe by reminding everyone of a bet he made nine years ago. That bet was that any set of five hedge funds could not beat the S&P 500 on a ten year basis. At the nine year mark, Buffett is comfortably ahead. Consequently this kick-started a debate across the globe around the efficacy of active versus passive management which has been raging ever since.
In Australia, we believe this debate needs to delve further. The construction of the Australian benchmarks means index investors are taking concentrated bets and worse than that, so called active managers are running portfolios by massaging around these bets. This is due to an index that is top heavy and concentrated in a number of sectors. To illustrate this point we can compare the largest holdings in the S&P 500 to the ASX 200. The top 10 companies in the Australian index have a combined weight of 43%, whilst in the US its 19%. When we look at the top 20 companies in Australia they represent 56% of the index versus 28% in the US.
In buying the Australian index you therefore take a concentrated exposure in twenty companies with a long tail. The greater problem comes when you start to delve into the composition of those twenty companies and you find:
The four largest companies (the banks) representing 25% of the index essentially do the same thing. Whilst the big four banks do have subtle differences, a majority of their profits come from residential mortgages. In addition, all four are currently being hit by increased capital requirements and additional levies.
A supermarket duopoly that has been disrupted in recent years by low cost entrants.
A former national Telecommunications company that has seen most of its competitive advantages disappear in recent years.
And a high exposure to highly cyclical commodities markets.
When we compare the Australian index in totality to the US index we can see these concentration problems arise. The two largest sectors in the Australian market (financials and resources) represent over 50% of the weighting whilst in the US it is 37%. Buying a passive index fund in Australia means you are betting over half your capital on the Australian housing market and commodity prices, most notably Iron Ore, LNG, Gold and Coal. In the US, the two largest sectors are Information Technology and Healthcare, the two fastest growing sectors globally in recent years.
This all brings us to active management and here lies a major issue for Australian investors currently using managed funds. A lot of the tools used in portfolio management have the benchmark (in this case the ASX 200) as a starting point. Active fund managers will manage to a targeted tracking error. In layman’s terms, tracking error is a statistical measure of how far you differ from your underlying index. Due to this constraint, active funds will usually have limits to how far they can differ from the index by sector.
To illustrate this point we had a look at the most recent quarterly report from a well-regarded Australian Equities manager with a growth focus. The top three holdings within the fund were Westpac, CBA and NAB with a combined weight of 22%. Given the growth focus of the manager it is surprising that their top three holdings reported Cash Earnings per share growth of 1%, 0% and 2% respectively at their most recent results. In addition with payout ratios above 70% and a regulator enforcing stricter capital limits, these banks have little capability to grow any time soon. Now, this fund manager would most likely tell you they are “underweight” the big four relative to the market weight, as it seems fairly clear that they are unlikely buying these shares for their earnings growth.
The most likely reasons they own the shares is twofold:
Their above mentioned tracking error budgets and portfolio restrictions means their process will force them to buy the banks.
Career risk, if an analyst or a fund manager took a significantly negative position against a sector of such great concentration and was to get it wrong then they would most likely be looking for a new job.
As a result, active funds in Australia tend to have the same concentration risk as the underlying benchmark. An investor seeking to invest will end up with similar problems if they were to go through a passive fund or an active one. If the banking sector falters, investors in either camp will suffer. To see how this would play out over time, one only needs to look at Japan. If you were to go back to 1993, the banking sector was almost 20% of the Nikkei; it is now sub 10%. The Nikkei over that time on a price basis has gone up by only 12% (or 0.5% annualised) and the banks have been a key drag.
Obviously, Australia is different than Japan with one of the key distinctions being immigration but the example does highlight the risk associated with concentrated indexes. Whilst Japan has been largely considered an investment disaster due to an index that has barely moved over the last 25 years, the structure of the index has changed considerably during that time. The banking sector has detracted whilst other sectors have grown, most notably sectors such as technology and global consumer focused companies.
In Australia, it isn’t hard to envisage a similar scenario in the future. Ultimately in ten years’ time it is unlikely that the banks will have the weight they currently do. The pressures of record household debt and increased regulation will likely weigh on their performance. On the other side, Information Technology currently makes up 1.8% of the index and we’d be worried for the Australian economy if this wasn’t significantly higher over time.
Quite often we get asked our opinion on where the Australian market is heading and we give our honest answer, we don’t know. What we do say with some confidence is regardless of index performance we believe the sector mix will change over time. As a result we believe truly active management that ignores the index is the only way forward for Australian investors.
We made the mistake of investing in the Murray River Organics (ASX:MRG) IPO at $1.30. The stock has fallen by 73% to $0.35 in the company’s turbulent 6 month listed history, and we sold out at $0.65, 50% below the IPO price. Rather than sweeping this under the carpet we see this as an opportunity to learn some valuable lessons. In this article we share around some humble pie.
Why we invested in MRG in the IPO
a) Industry tailwinds
The trend of growing demand for natural and organic foods has been well entrenched for many years, and we believe provides strong tailwinds for over the long term:
Source: PAC Partners
b) Compelling relative valuation
MRG’s prospectus forecasts suggested the company was listing at an EV/EBITDA of 11x versus the global average for listed organic and differential food stocks of 13.2x, and the multiples would drop off materially in the coming years as MRG’s vines mature:
Source: PAC Partners, Jan 2017
Source: Morgans, Jan 2017
c) Scarcity factor In addition to the industry tailwinds MRG appeared well positioned to take advantage of the current global under-supply of organic raisins:
Source: PAC Partners, Jan 2017
What happened next…
1) IPO concluded successfully in December 2016 based on the FY17 prospectus forecast: $15.9m EBITDA, $6.6m NPAT:
Source: MRG prospectus
2) MRG’s H1 result – on track & re-affirmed prospectus forecasts.
3) First profit warning May 4th: new FY17 forecast $12.5-13.5m EBITDA, $4.2-4.9m NPAT:
“The FY17 pro-forma revenue is expected to be down by $10 million, with approximately half of this reduction being attributed to the previously communicated 5-6 week delay in harvest season caused by an unusually cool and wet spring, coupled with more recent wet weather. The other half of the reduction is attributable to slower than anticipated uptake in sales following delays to the refurbishment of the Company’s Sunraysia processing facility, during which dried vine fruit could not be processed, as well as a lower contribution from Cluster sales following the previously communicated write-down of some Cluster inventory.”
4) Second profit warning May 22nd: new FY17 forecast $6.5-7.5m EBITDA, $0.1-0.8m EBITDA:
“The reduction in sellable dried vine fruit from the 2016-2017 crop, due to the recent and previously announced cold and wet weather experienced in the Sunraysia region, has resulted in the Company revising its estimated FY17 pro forma EBITDA to be in the range of $6.5-7.5 million and pro forma FY17 NPAT in the range of $0.1-0.8 million.”
What we got wrong
a) Management
This is the most humbling mistake for us to own up to since we are so focused upon identifying management teams who are honest, competent, shareholder friendly and motivated. The great thing about investing is that everyone is faced with mistakes upon occasion, and thus has a choice how they deal with them – we can all chose to either learn a lesson or not to.The background to our experience with MRG’s management dates to the pre-IPO presentations when we saw them present. We thought the CEO came across as competent, honest and knowledge-able, and were of the opinion he would be a great leader for the business looking forward. We then met him again at a conference a few weeks after the IPO and were again impressed for the same reasons. We were reassured that everything was on track and the company’s prospectus forecasts would be achieved. This meeting was the week before the company announced its first major profit warning. Yes, you read that right. Management were presenting to investors the day before the profit warning with the message that everything was on track.
This is why this job can be so humbling. We clearly misjudged management on all levels. We don’t want to dwell on the negatives about MRG’s management in this article but it is clear they didn’t tick any of the boxes we were aiming to tick.
b) Our assessment of weather risk
Weather risk will always be a key consideration when investing in an agricultural exposed company like MRG. We did indeed consider this risk in depth before investing. At the time we took comfort from management and broker reassurances that the prospectus forecasts already factored in short term risks including weather. This was a big mistake on our part as poor weather ended up being a primary contributor to MRG’s subsequent profit warnings which made it painfully clear that weather risk had not in fact been factored into the company’s prospectus forecasts.
c) Our assessment of the company specific risks
Beyond the challenging weather conditions, the company mentioned the refurbishment delays at the company’s Sunraysia processing facility as being a major problem since dried vine fruit could not be processed as a result. In addition, there was as a lower contribution from Cluster sales following the previously communicated write-down of some Cluster inventory.
Both of these issues have had a significant impact on the company’s sales and earnings in MRG’s brief listed life, and we clearly under-estimated both of these risks. We both issues relate to our judgement of management as there was an underlying assumption that management were on top of these logistical issues ahead of listing. MRG certainly has revealed an unusually long list of problems to the market in its 6 months on the ASX.
d) Investing in the IPO rather than awaiting some listed trading history
Arguably most of our mistakes in this example would have been avoided if we had avoided buying MRG in the IPO and had awaited some listed trading history, preferably at least a few years. By watching the stock as a listed entity for a period we would have had a far clearer picture of the company’s key risks.
e) Under-estimating the implications of the company’s unusually short escrow period
This was an unusual one. MRG had a very short escrow period for pre-IPO shareholders which meant there was a massive increase in the supply of stock hitting the market at exactly the wrong time, into bad news. In hindsight we should have asked ourselves why the management team and brokers would support such a short escrow period. We are not suggesting that management were aware of all of impending problems when they wrote the prospectus but it does look as if there was pressure from some pre-IPO shareholders to create an exit point as soon as possible. This is the opposite of what we are normally aiming for; a long term and committed shareholder base.
Lessons learnt:
Only invest in IPOs where we have a history of following and understanding the business and management – Our MRG investment experience has reinforced in our minds the benefits of investing in companies with a long term trading history which reveals the ins and outs of how a business works and evolves.
Avoid agriculture exposed companies unless we are certain weather risk is mitigated – The reality is it is almost impossible for agricultural companies to mitigate against weather risk and when poor weather hits it will generally impact upon earnings far more than any financial model will predict.
Make sure all your research is independent – do not rely on broker research – When we invest in a company it is our responsibility to get it right and we cannot rely on external research in any shape or form. MRG’s lead brokers got the company’s financial forecasts very wrong just a few months before the end of FY17 but we should not have factored their analysis in as much as we did.
Be careful of IPOs with short escrow periods – This is the first time we have encountered such a short escrow period and it has highlighted to us that this is a warning sign which should not be ignored.
Your first loss if your best loss – selling on the first profit warning was absolutely the right strategy despite feeling “wrong” at the time – We sold our entire MRG stake at between 63c and 65c after the first profit warning. This was a remarkably hard and humble step to take but in hindsight it was the right step.
Conclusion:
Learning from your mistakes is one of the greatest opportunities all investors face. As a result, we wear our scars proudly and look to learn as much as possible from our mistakes. Investing in the MRG IPO was arguably our biggest mistake in the underlying portfolio’s 2 years and 2 month trading history. We won’t be making the same mistake again.
This week we take a look at the peer-to-peer lending space. In a time when term deposit rates are negligible, is it time to look at alternatives for your income? How can you achieve the income you want while minimising the inevitable increase in risk associated with consumer loans?
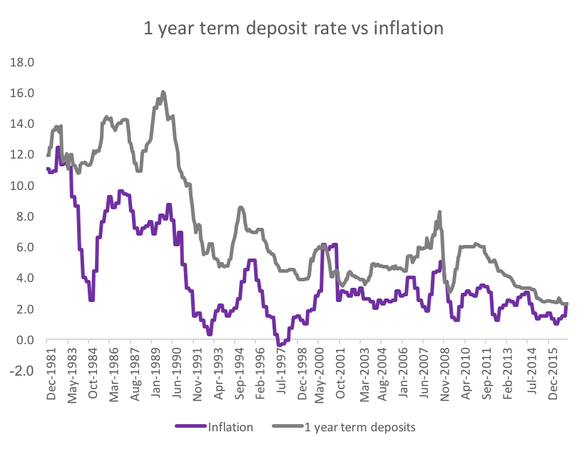
The 80’s were memorable for a number of reasons. Fluorescent clothing, Olivia Newton John, the Americas Cup win and an average interest rate on one-year term deposits of 13%. There was no Government guarantee of deposits and CBA had not even listed (that happened in 1991 at $5.40 per share).
Since then rates have been volatile but on a steady downward trend for the last 35 years. Likewise, inflation has come down significantly from highs of over 12% in 1982.
Source: RBA
What conclusions can we draw from this chart? Obviously, term deposit rates are at a record low. But this is only part of the story. To determine the real value of a term deposit we need to look at the real return. That is, the term deposit rate less the rate of inflation. If that gap is small our real return is small. If inflation is greater than the term deposit rate as it was in 1998, 2001 and 2008 investors are actually losing money by putting it in the bank.
The chart below shows the real rate rates of return on term deposits since December 1981.
Source: RBA
It is clear that the real return on bank deposits has been decreasing over time. Some of this can be explained by the lower risk – attributable to the Government bank guarantee. But really, this shows that term deposits are just not a good deal. Real returns of less than 1% should not excite anyone.
But fortunately, there has never been more choice for Australian’s looking for a better fixed income return. With a moderate increase in risk investors can earn significantly greater returns. The banks have been doing this for years it is high time that retail investors get a chance to invest in similar assets. The chart below shows the rates that banks have charging on various types of loans since 1981.
Source: RBA
A few things stand out. Mortgages and small business loan rates have been coming down since April 1995 and we all know why. Disruptors such as Aussie Home Loans and RAMS forced the banks to start pricing fairly.
But, personal loans are basically at the same place as they were 20 years ago. This is during a period when default rates have been low and the economy has been strong.
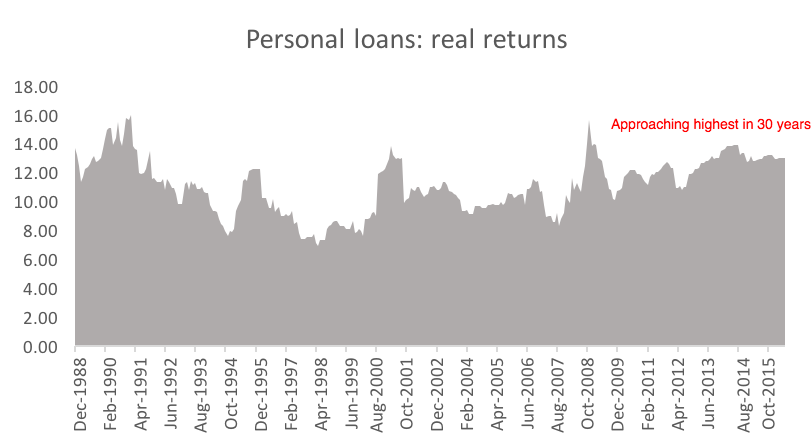
But the story is more interesting when we look at real returns to the banks on personal loans.
Source: RBA
Real rates have actually gone up over the last 20 years. This is in the context of a generally stronger economic conditions and low default rates.
So let’s draw all this together. Term deposits are at historically low returns. More importantly, real returns on term deposits have come down consistently for the last 20 years, in some cases hardly keeping pace with inflation.
In contrast, the real return on personal loans has been increasing giving the banks exceptional returns for the risk.
Peer-to-peer lending
Until recently, access to the personal loan asset class was limited to banks and credit unions. Peer-to-peer lending gives retail investors the opportunity, for the first time to access this asset class.
In the USA and the UK, peer-to-peer lending has become very mainstream with over $20 billion dollars lent in 2016.
In a nutshell, peer-to-peer lenders match people looking to borrow money with people who have money to lend. Most peer-to-peer lenders have chosen to focus consumer credit and small business loans. Small loans like this allow greater diversification and lenders benefit from substantial data available to the peer-to-peer platforms which allow them to make informed credit decisions.
Leading peer-to-peer lenders, like RateSetter and Society One, target the top tiers of creditworthy borrowers. They compete against the banks (not payday lenders) for borrowers. Rates offered to borrowers are often lower than what that borrower would pay to a bank as peer-to-peer platforms operate more efferently than banks and pass on costs savings to borrowers and lenders.
There are two peer-to-peer models that have developed, one from the USA and the other from the UK.
What are the risks and returns?
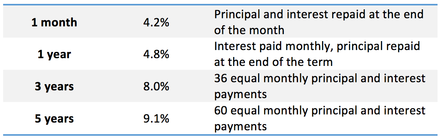
Peer-to-peer lenders are not banks, so they do not benefit from the Government deposit guarantee. However, many investors have found that by choosing a platform that allows some sharing of the risk between investors (eg. a shared provision fund) or ensuring a diversified portfolio of loans they can earn healthy returns with an acceptable level of risk. For example, RateSetter’s current market rates after fees are:
Source: RateSetter website, 20 June 2017
The best peer-to-peer platforms provide lots of information to allow investors to assess the risks. Data like historical default rates, size of provision fund, number of borrowers and key borrower characteristics. Some platforms, like RateSetter, allow investors to download their entire loan book so that investor can conduct their own analysis on the loans and track record of the peer-to-peer platform.
This week the small cap team takes a look at their investment in Konekt (KKT.ASX), a workplace health solution provider.
Who is Konekt?
Konekt provides workplace health solutions. Its service lines cover the employee lifecycle from injury prevention to redeployment, helping organisations prevent injury and minimise the impact of workplace injury costs by assisting injured employees return to work. KKT comprises over 400 permanent employees of which over 350 are qualified allied health professionals, operating from 44 offices in all capital cities and across major Australian regional centres. KKT is an Australian market leader (~11-12% market share) in a very fragmented market. The company currently has a market capitalisation of $44 million.
Case study – Injury prevention:
Boral is Australia’s largest building and construction materials supplier, with operations in all Australian states and territories. Injuries caused by manual handling are a major burden to society, and particularly in the construction sector.
Following a review of internal incidents and injuries, Boral Timber identified the need to improve manual handling behaviour within their workplace to reduce the frequency and severity of lost time injuries. Boral had been a long term customer of KKT, and began working with KKT to develop a positive manual handling culture within Boral Timber.
Konekt and Boral developed a targeted program to address safety culture, and foster safe manual handling procedures. The program become a key part of the culture at Boral and assisted with increasing employee awareness and cementing the core principles of safe working practices.
Over a 12 month period following the program implementation, Boral Timber reported a reduction of more than 80% in manual handling injury claims. Employee understanding and recall of manual handling principles post-program increased 20%, while there was a significant increase in the level of employee accountability in relation to safe manual handling practices.
Why we like Konekt:
KKT, under the leadership of CEO Damian Banks, has delivered consistently strong revenue and earnings growth in recent years in a sector which has exhibited relatively low growth. As a national business with a meaningful fixed cost base, this revenue growth has resulted in a strong increase in operating margins (FY14: EBITDA margin of 5%; FY17 forecast EBITDA margin of ~11%).
Growth has come organically from new and existing customers, complemented by some sensible acquisitions to expand national coverage and broaden the range of services offered (eg: last year KKT acquired a leading psychological health services firm, that offers services in mental health and wellbeing training, resilience training, psychosocial risk assessment and mental health advisory services).
These acquisitions have been funded by KKT’s strong cash flows, which have also funded the re-payment of all corporate debt and enabled a modest dividend to be paid in FY16.
KKT has a reasonably broad customer base split between corporate organisations, insurance companies and government departments.
The numbers:
Despite some challenging recent market conditions (eg: KKT had previously done a significant amount of work in the mining services, which began to reduce from 2013 as the mining sector contracted), KKT has delivered consistently strong revenue and earnings numbers.
Source: Company filings
For FY17, Konekt has recently confirmed its guidance of revenue in the range of $51.0 – $53.5 million and EBITDA margin in the range of 10.5% to 11.5% of revenue. This would suggest earnings per share of just over 5 cents which places KKT on a price/earnings multiple of c. 11 to 12 times.
We do not think that is demanding pricing for a market leading national business, with a strong track record of growth and with potential to take further market share in a fragmented market and/or expand its range of service offerings to become a diversified corporate health provider.
Recent developments:
We recently noted that KKT had advised the market that its largest customer, Medibank Health Solutions (MHS) had decided to change certain requirements relating to the rehabilitation services provided under the MHS Contract. Through this MHS contract, KKT provides rehabilitation services to the Department of Defense, and KKT oversees and provides sensitive services to approximately 3,000 (and increasing) defense personnel across a number of (often remote) geographic locations. During May 2017, KKT announced that it had executed a new contract with MHS for the provision of rehabilitation services until October 2018. The major change in this contract is that rehabilitation services will now be directly supplied on- base (inside defense property) rather than working out of a KKT office as was previously done.
On a separate note, each year KKT releases the Konekt Market Report in which KKT analyses rehabilitation services data from over 156,000 cases over the last 8 years. This comprehensive review includes referral patterns and return-to-work outcomes across jurisdictions, organisation size and industry sectors. The 2017 edition was released in May. Key findings from this latest research included:
The typical injured person at work was male, aged around 42 years and came from an average socioeconomic background.
The most common injury type was musculoskeletal in origin while about 12% of the group had an identified mental health injury as their referral reason.
Most (96% in FY16) people successfully return to work after injury, and the proportion of people returning to their pre-injury work hours continues to improve (currently 89%). KKT are achieving these outcomes at a lower cost and in a shorter timeframe than ever before.
KKT noted that they, and their customers, should feel immensely proud that they are making a positive difference to Australian society every day.
We like KKT as it is a well-managed business with a market leading position, a strong balance sheet, is on an undemanding multiple and is making a genuinely positive contribution to the lives of many thousands of people across Australia each year.
This article by Guy Carson was originally published in the Weekend Wealth section of The Australian under the title “Time to plan for recession as household debt crimps spending”
Back in 2007, a US economist called Edward E. Leemer published a paper entitled “Housing IS the business cycle”. In this paper he studied the causes of every US recession since World War 2, of which there had been 10. What he discovered was that 8 out of the 10 were preceded by substantial problems in housing and consumer durables.” The only two US recessions that are exceptions to the above were the end of the Korean War in 1953, caused by a decline in defence spending, and the 2001 “Tech Wreck”. As the paper was written in 2007, we can now improve the success ratio to 9 out of the last 11 recessions following the 2008 recession, something that Leemer warned about.
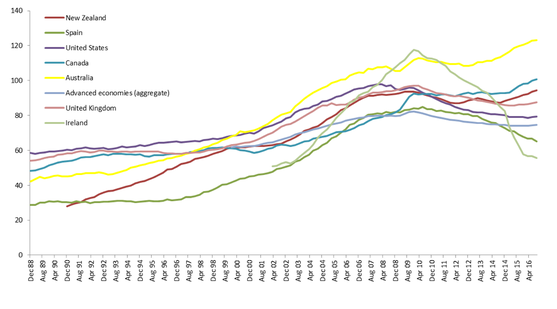
When one reads this paper and looks at the current economic environment in Australia, it is hard not to get nervous. Recently, the retail sector has seen a significant selloff and whilst many observers point the finger squarely at Amazon, we believe there might be more at play. As a case in point, the recent downgrades from the two largest car retailers in Australia (AP Eagers and Automotive Holdings Group) tell an interesting story. As far as I’m aware Amazon does not sell cars and yet sales on a national level are falling. What is causing this? Well, Australia has the second most indebted consumer in the world behind only Switzerland with respect to Household debt to GDP (chart below). The rise in household debt in this country has pushed the level above what was seen in places like Ireland and Spain prior to the Global Financial Crisis. Recent out of cycle interest rate hikes from the banks combined with record low wage growth has put significant pressure on this highly leveraged position.
Source: Bank of International Settlements
High debt levels mean the consumer is highly sensitive to small changes like we have recently seen. As a consequence we have seen a fall in car sales on a national basis led by falls in Western Australia and Queensland. AP Eagers indicated that sales were impacted by a 5.9% fall in Queensland whilst Automotive Holdings stated that a 3% fall on the east coast had “reduced the capacity of east coast earnings to provide cover for WA”.
In addition to falling car sales we had construction data out for the first quarter of 2017 and we had the first signs of the residential construction boom slowing. The fall in residential construction for the quarter was 4.7% and was the largest such fall in over 15 years. The fall was driven by a 14% fall in Queensland and whilst this was potentially cyclone impacted, the increasingly oversupplied Brisbane apartment market appears to be having an impact. This fall in residential construction combined with sharply falling car sales ticks both of Leemer’s boxes and suggests Queensland may well be joining Western Australia in a recession.
Whilst problems are evident in Queensland and WA, it is probably too early to have the same concerns for NSW and Victoria but the overall economic outlook is slowing. So with that in mind how should one position portfolios? Well, for starters are a long list of companies and sectors to avoid. The three stand out to us as most vulnerable are:
Anything consumer orientated. With record high household debt and record low wage growth, retail activity will remain subdued at best. Companies in this category include the likes of JB HIFI, Harvey Norman, Nick Scali and the above named car retailers.
Anything finance related. High household debt makes consumers more vulnerable to both a slowing economy and interest rate changes. Whilst we do not expect the RBA to raise rates we note that increasing regulation and offshore funding markets could lead to further out of cycle hikes. Companies that are vulnerable here include Credit Corp, Pioneer Credit, Money 3, Flexigroup as well as the banks.
Companies tied to residential construction. Ultimately residential construction will fall; it has fallen in WA and is starting to fall in Queensland. Companies exposed here include Adelaide Brighton, Mirvac, Leadlease and Finbar.
The question becomes where to hide. If we do have a recession, very few stocks will do well. In order to avoid cyclical weakness it is important to look for industries that are going through structural change. The three most obvious examples to us are:
The technology sector. Technology is enabling companies and individuals to become more productive, to do more with less. Australia is home to a number of software companies that are world leading in particular niches. Examples of this include Altium, Gentrack, Hansen Technologies and Integrated Research. As these companies are global players they will benefit as well from a falling Australian dollar.
Healthcare. Ageing populations globally leads to natural demand growth and thankfully Australia is home to a number of world leading companies such as CSL, ResMed, Ramsey and Cochlear. Again, these companies would all benefit from a falling Australian dollar.
Truly counter cyclical companies. An example of which would be shareholder litigation companies such as IMF Bentham. In times of stress, fraud and misleading statements tend to be exposed.
The current consumer strike is sounding warning bells to us. The economies in Western Australia and Queensland appear to be in or heading for recession, it’s only NSW and Victoria (or more accurately Sydney and Melbourne) that are holding the economy up. Whilst we have no perfect insight in the future, we believe that now is the time to be selective with your investments.
DISCLAIMER: Guy’s portfolio currently includes the following stocks mentioned above: Altium (ALU.ASX), Gentrack (GTK.ASX), Hansen Technologies (HSN.ASX), Integrated Research (IRI.ASX), CSL (CSL.ASX), ResMed (RMD.ASX), IMF Bentham (IMF.ASX).