This week Robert Swift digs into the recently announced Royal Commission.
Today the Australian government announced there would be a Royal Commission established to investigate the banking industry. This was done on receipt, by Treasury, of a letter from ‘the big 4’ requesting such, in order to ‘restore faith in the financial system’.
There will be many comments available on this imminently so ours will be short. We will also mostly ignore the apparent ‘wordsmithing’ whereby the request from the big 4 was to “restore faith in the financial system” rather than investigate the big 4 specifically. That is, “the system is good, we just need folks to be educated” rather than “maybe the system isn’t so healthy; please help us fix it”
Banks have been unpopular in Australia (and elsewhere) for justifiable and unjustifiable reasons. It is not clear that Australian banks have been less well behaved than banks in other countries. It seems that banks are unpopular when they transgress with retail clients or the smaller end of town? Wells Fargo in the USA for example has had problems with mis-selling and over zealous account openings, and it has become the banking pariah, rather than the large investment banks which facilitated a number of ‘grand schemes’ which dwarf the WFC account opening scandal. Greece’s entry into the Euro for example, was facilitated by a sleight of hand on a gargantuan scale by a global investment bank. This has cost far more than any account opening or financial planning ineptitude for retail customers done by CBA or WFC!
Since they have only been as badly behaved with equivalent cultural ‘problems’ as banks elsewhere why then is there a Royal Commission and what damage will be done?
It is a political gesture for a marginal government to appear to listen to the people. It is another ‘populist’ gesture much as the UK referendum was or even the Trump victory. Folks are pretty unhappy and rightfully so.
To get the banks to request the inquiry reduces the impact of the accusation of a ’U turn’ by the government and is a clever manoeuvre.
However a Royal Commission is NOT the best avenue to deal with the banking system and the problems of culture and poor behaviour at the big 4. Ironically a Royal Commission remit SHOULD be established and focus instead on the idea of breaking the oligopoly of the big 4. Somewhere along the line the Australian mantra of “4 pillars” became only 4 rather than at least 4. The problem of concentrated power lies in the decisions of the Rudd government to let Westpac take over St George, and for CBA to then buy Bank West. Four with a few small competitors became four with two of the more viable competitors subsumed. To have an industry which is price competitive needs competition and of that there is now too little. It is also clear that bank owned platforms with bank owned asset managers and tied planner networks is hardly the stuff of competition and low fees for the retail consumer. It is not all the fault of the Rudd government but they sure were nudged into acquiescing to what the big banks wanted.
A Royal Commission is designed to work when there is one major systemic issue and for which bilateral policy change can be agreed.
Inadequate banking competition and the overly powerful banks control of super fund administration in Australia, would be a valid target for a Royal Commission but it appears that this is not the requested objective.
Consequently we guess that this Commission will just be a sniping exercise where tabloid headlines of ‘scandalous policy and unsavoury behaviour’ will be the norm.
Here are our considerations if the toxic cultural norms, inadequate skills and bad incentives are to be improved:-
The best way to deal with poor behaviour is for the owners of the business, the shareholders, to get engaged before the event. ESG or Environmental, Social, and Governance, issues are all investment considerations, and yet we find that rarely are boards engaged by activist investors to effect change before something happens – at least not yet. Were the warning signs not there at CBA for some time as the Storm Financial scandal broke? Hindsight is a great thing but if ESG is an approach you highlight as part of your process then maybe there should have been more change required after Storm? I think the regulator might have been a little slow here too? People respond to incentives and staff are the same. Consequently shareholders should investigate management incentives and understand better the behaviours they produce. We understand it is difficult. We know some powerful UK based shareholder friends, who owned a decent slug of the Royal Bank of Scotland, and they were constantly telling the Chairman that Fred Goodwin was not a CEO who was building a sustainable and solid business. They got nowhere even though they were right. Engagement can be a thankless task but at least they tried before he blew up the bank and cost shareholders and tax payers a lot of money.
It is all about culture. Make the staff targets revenue based and you will get very different behaviour from imposing a target that is client retention based – for example. This Australian banking ‘problem’ is about behaviour, business culture and the true qualifications of executives to run retail and wealth management businesses. Business culture and the true level of management experience and skill should not be a Royal Commission remit.
Shareholders find it hard to vote with their feet if the company is too powerful and too large in their benchmark. Not owning CBA when it comprises over 10% of your benchmark assigned by the pension consultant is a tough and risky call to make for any fund manager. “Small is beautiful” in that the shareholders can afford to disinvest from a company they believe has a toxic culture and / or is a bad business. We think that government should use the Royal Commission to investigate breaking up the banks; and that more funds here should invest internationally using a global equity index which acknowledges the plentiful supply of well run banks offshore. This would make Australian banks less influential.
In an age of Fintech it is not clear that reducing the size and scope of the banks would raise the cost of borrowing in the economy – a claim you can be sure the banks will make if it ever is threatened! In short it may be a good thing to reduce the grip of the banks, but their written request was to “restore faith in the financial system”, not investigate and change the system!
This will be embarrassing for and potentially emasculate, the financial regulators. Or they could come back “badder and bolder” and heap a whole load more regulation and pointless oversight onto listed companies. We don’t know but as ever more regulations don’t appear to change behaviours. Someone somewhere is always breaking the law. If you make more laws, more laws will be broken. It’s not about the number of laws but the principles and ethics in which the business is immersed; and then how you respond IF you do break a law. Again we don’t see how a Royal Commission can help with ameliorating poor behaviour.
Our response in conclusion? Prepare for a year of revelations and rumours and heightened volatility in Australian banks. Look elsewhere, especially internationally, for diversification.
There has been much commentary surrounding the ASX breaking through the 6,000 barrier. This week Guy Carson weighs in and looks at whether the run can continue or not.
A lot has been made over the last month about the ASX 200 breaking through the 6,000 barrier. In doing this it reached the highest level since the Global Financial Crisis. A number of commentators have pointed to the psychological impact of breaking this round number and have suggested it could herald a sustained rally. We, however, are not so sure and in order to understand why we think it’s important to look at the structure of the Australian equity market and what its potential drivers are.
Over the last 10 years the S&P 500 has given investors a return of 106.3% or 7.51% annualised whilst over the same period the ASX 200 has delivered just 37% or 3.2% annualised. One of the key reasons for the Australian market lagging is the evolution of the US market over time. To illustrate this point the chart below looks at how the top five companies in the world and how they have changed over the last decade.
The most notable aspect is how the composition of the top five has evolved over time away from Energy (Exxon, Total, PetroChina) and Banking (Citi, ICBC) to Technology. The technology sector globally has been the key driver of the recent rally and the major source of earnings growth. One can point to current valuations and suggest that the Technology sector has run too hard and too fast. We would certainly agree that the likes of Facebook, Amazon and Netflix do trade at very high multiples, but with a lack of growth in other sectors, investors remain attracted to them.
Australia has missed out on this latest boom as the Technology sector currently represents just 1.8% of the ASX 200 and has a limited impact on the direction of the market. In fact, amazingly when you do a similar comparison of the Australian market you see that the companies at the top have barely changed over time. Amongst the top five companies in Australia, only one has changed since twenty years ago with ANZ replacing News Corp. This leaves us with four banks and a miner in the top five and highlights the concentration risk in the Australian economy to just two sectors (housing and mining). It is therefore these two sectors that will dictate to a large extent the direction of the ASX.
In order to understand where we are going it is often quite helpful to look where we have been. As the mining construction boom came to an end back in 2012, the RBA started to cut interest rates and this in turn led to a residential construction boom (something we wrote about here). The key driver was low interest rates encouraging consumers to take on debt; as a result Australian consumers took on more leverage at a time when consumers in most of the developed world were going the other way.
This was a significant tailwind for the banks. Higher demand for credit allowed them to continue to grow their asset books (as discussed in this article here) and this has led to profit growth. The question now is whether this growth continues and to that end we have started to see consumers begin to get squeezed by a combination of factors. These factors are the previously mentioned high debt levels combined with continuing low wage growth, a raise in interest rates through APRA intervention (on interest only and investor mortgages) and a 17% jump in electricity costs. As a result retail sales have fallen over the last three months and the property market has started to slow. The easiest way to measure demand in the property market is the auction clearance rates. These have started to fall with Sydney having recorded rates of below 60% for the last four weeks suggesting consumers are less willing (or less able) to take on more debt.
The impact for the banks will be constrained asset growth and if the situation worsens, rising impairments. The major banks have responded to this outlook by a further round of cost cutting with NAB in particular announcing that nearly 1 in 5 people will be made redundant. The outlook for the banks in our opinion remains one of low growth at best and therefore we don’t expect a meaningful rerate of the share prices to drive the market.
That brings us to resources which has been one of the key drivers of the recent rally. Commodity prices have rallied from December 2015 lows as China fell back on the infrastructure and property lever to boost their economy. Whilst prices have rallied they remain below their 2011 highs. Global growth has picked in recent times but China remains the overwhelming centre of demand, consuming between 50-60% of most raw major raw materials. As a result the ever expanding debt levels of the Chinese corporate sector remains the key risk.
One area within commodities that has seen significant speculation in recent times has been electric vehicles and battery use in general. With a shift globally occurring, the expectation is the demand for commodities associated with battery production will boost prices. Whilst we can see the increase in demand that is occurring we would point any investors interested in the sector towards a recent Massachusetts Institute of Technology study. This study looked at the five commodities most likely impacted by increased battery production, which are lithium, cobalt, manganese, nickel, and carbon in the form of graphite. The study found that the increase in demand from planned battery manufacturing will not lead to significant supply problems. There are however political risks, in particular for cobalt where a substantial part of the supply comes from the Democratic Republic of the Congo. Whilst speculation can always push prices higher, this study suggests the fundamentals may not necessarily line up. Of course the other major threat is the evolution of the battery technology that may remove some demand.
Ultimately, commodity prices are nearly impossible to predict and whilst there could continue in the short term, the rally over the last 18 months potentially limits how much further they can go.
So with both of the major sectors unlikely to provide significant earnings growth, our expectation is that the ASX 200 has limited upside. That is not to say that the recent rally is over, share prices can fluctuate and it would not be surprising to see the market 10% higher (or lower) in six months’ time. However without sustained earnings growth, any upside will be capped. This is the key difference between the Australian and the US market, the US market has evolved and earnings have been driven by innovation whilst the Australian market continues to be dominated by old industries.
That is not to say we don’t have innovation within Australia. There are a number of smaller companies that have done and are doing exciting things. Our portfolio has benefitted from owning companies such as Altium, Hansen Technologies and Gentrack. These are global technologies operating in niche sectors with structural tailwinds providing earnings support.
This week we bring to you a piece by friend of TAMIM Sam Ferraro of independent financial education firm Evidente.
This article was originally penned on October 16, 2017.
In a recent research paper, former Chair of the Federal Reserve, Mr Ben Bernanke, proposes price level targeting as an alternative framework for monetary policy. Since 2012, the Federal Reserve has had an explicit inflation target of 2% pa, with inflation commonly measured in terms of the chain price index of personal consumption expenditures (PCE), excluding food and energy. The chart below, re-created from Mr Bernanke’s paper, shows that this measure has consistently undershot 2% since the financial crisis.
Source: Evidente
At present, the Federal Reserve’s inflation target has no memory. Despite the negative deviations from the target over the past decade, the Federal Reserve’s mandate does not allow it to consider past shortfalls into account when formulating its outlook for monetary policy. As long as it believes that core inflation will return to the 2% target over the medium term, the central can justify the the current stance of monetary policy. In fact, this represents the rationale for the lift in the federal funds rate over the past year, with the US Federal Reserve expecting factors holding down inflation to be temporary, notably lower import and energy prices.
Under Mr Bernanke’s proposal of price level targeting, when the federal funds rate is at the zero lower bound, the central bank would be accountable for past inflation misses relative to the 2% target. It would no longer have the discretion to neglect past deviations and would need to make up for past misses. To illustrate, Mr Bernanke depicts the path of core PCE price level since the December quarter 2008 – when the federal funds rate hit the zero lower bound – against a counterfactual price level that grows at the 2% target (see chart). At present, the actual price level stands at 13.8% higher than 4Q2008, below the the 2% target trend which has grown by 19%. The cumulative miss amounts to over 400 basis points. Under the proposed new framework, the Federal Reserve would vow to maintain the federal funds rate at zero until the price level makes up for the past cumulative shortfall.
For argument’s sake, suppose that the federal funds rate was still anchored to zero. The central bank would then promise to hold its policy rate at this level until the core PCE price level rises by no less than 400 basis points relative to the target price level (bearing in mind that the target continues to grow around 0.5% per quarter).
Source: Evidente
Evidente has extended the methodology and created core price level gap measures for other countries and regions to offer guidance on what a flexible price targeting regime would mean for their respective central banks. The key assumption used for consistency is a common 2% inflation target even though some of these central banks have slightly different targets. Of the small sample, only Australia and the United Kingdom have positive deviations; their core price levels have grown faster than their target since 4Q2008. (see chart). But Europe and Japan have shortfalls that are significantly larger than the United States, suggesting that any moves to tighten policy in those countries would be premature based on a price level targeting framework.
Source: Evidente
Mr Bernanke acknowledges one of the pitfalls associated with this flexible price level targeting regime; how does the central bank treat deviations from the target price level associated with supply side shocks? For example, a coordinated cutback in global oil production by OPEC and other oil produces could lead to a lift in the general price level above the target level. Strict adherence to price level targeting would see the central bank tighten policy to compensate for past positive deviations, which would further depress activity. A flexible framework of the type that Mr Bernanke advocates, would given the central bank discretion to look through such supply side shocks, but its credibility would hinge on its ability to communicate this effectively to market participants.
A debate on a price level targeting regime represents a welcome development in the direction of what market monetarists advocate; a framework that targets the level and/or growth of an aggregate income measure, notably nominal GDP. Nominal GDP has a number of desirable properties relative to overall prices. First, nominal GDP is a better measure of economic well-being because households earn nominal wages and business earn nominal profits. Second, it is not subject to the same mis-measurement issues as overall prices or inflation. Third, demand shocks – which central banks ought to focus on – are better reflected in changes to nominal GDP than prices. Fourth, households mistakenly believe that low inflation is desirable because they focus on what they buy and not what they sell, notably their labour (a point highlighted by market monetarist, Scott Sumner).
Against this backdrop, Evidente has developed an alternative policy measure that focuses on deviations from a target level of nominal GDP. To that end, I have estimated a target trend for the United States based on the period 1993 to 2008, and extrapolated this trend out to 2017. At present, the shortfall amounts to 20%; the economy’s counterfactual nominal GDP would be 20% higher if it had grown since 2008 at the same trend rate posted from 1993 to 2008 (see chart). The shortfall has continued to grow and at present, is at its highest level. This framework would suggest that the Federal Reserve should have waited longer before embarking on its tightening process.
Source: Evidente
Evidente has extended the methodology to other countries and regions, which shows that the nominal GDP shortfall amounts to 15% or larger for Australia, United States, United Kingdom, Europe and China. Interestingly, there is no shortfall for Japan (see chart).
Source: Evidente
Many would view the conduct of monetary policy globally to be in a state of flux. Many central banks have implemented macro-prudential policies to promote financial stability at a time when policy rates remain close to record lows. On this front, the RBA has been a pioneer, formally adopting financial stability as one of the key objectives of monetary policy.
Mr Bernanke’s paper represents the start of what is a likely to be a drawn out debate about monetary policy and what it ought to target. Whatever the new central bank standard looks like in the future, one that incorporates level targeting and makes up for past deviations from target would amount to a significant enhancement on the current inflation targeting standard, particularly if policy rates remain close to the zero lower bound for an extended period.
Finally, the price level gap outlined by Mr Bernanke and the nominal GDP level gap reported here contain potentially valuable incremental information about the stance of monetary policy above and beyond real or inflation adjusted policy rates. Evidente is currently working on developing a framework that utilises this information to improve measures of expected returns at the market level. In due course, these measures are likely to become an indispensable part of the toolkit just not for central bankers, but also for asset allocators.
Evidente is an independent financial consulting firm managed by Sam Ferraro that delivers innovative financial advice to wholesale investors, including active long only funds, hedge funds, pension funds, and sovereign wealth funds, in Australia and globally. Drawing on academic research in asset pricing, behavioural finance and portfolio construction, Evidente provides wholesale investors with commercial solutions to stock selection and asset allocation decisions across equities and other asset classes.
Sam writes as a freelance journalist for The Age, Sydney Morning Herald and Australian Financial Review, was a member of the advisory board of API Capital, teaches business finance and international finance courses to undergraduates at RMIT, and most importantly Sam is a well respected source of information and friend of TAMIM.
This week Robert Swift takes a look at one of his favourite subjects of the last twelve months, – the land of the rising sun – and delves into a market of misunderstood problems and opportunities.
We have argued for a while that Japan has not ‘suffered from’ deflation at all, but has actually benefitted from deflation in goods and services prices which has made the economy much more competitive. We have also argued that this widespread mistaken idea that the ‘problematic’ Japanese deflation needs to be avoided elsewhere, has caused terrible policy errors by central banks worldwide. In response to what they falsely believe is the root cause of Japan’ low nominal GDP, these central bankers now try to obtain inflation, and positive inflation expectations. It is hubris for them to believe that they could precisely land, or settle, on the right number for, and the right kind of, inflation. They can’t and never could.
We now have the nasty problem of deliberately inflated asset values with which to contend as a result of this terrible and prolonged policy mistake of ultra low interest rates. In a mistaken belief in the need to get goods and services inflation, we have been delivered an asset bubble in certain assets.Deflation, which makes export prices more competitive, is no different from currency depreciation, which likewise makes export prices more competitive. No one thinks competitive depreciation is to be avoided at all costs?! Sometimes it can be useful. Just so with price deflation as long as it is not manifested in the collapse of asset bubbles but confined to goods and services. Deflation in goods prices makes companies invest to keep production costs down and to create new products. It is this private investment that creates wealth and real jobs, not government spending.
Actually the primary reason for low Japanese nominal GDP growth is the demographic aging of the working population. It really has nothing to do with deflation. Adjust for this demography and you have a very productive workforce and an increasingly wealthy economy. Japan has outperformed almost everywhere else on a per capita inflation adjusted basis. This is evident but widely overlooked by many investors. GDP can be as misleading as revealing.
So why has the stock market languished, until recently at least? As investors who focus upon stock specific risk, we think the market is very attractive. The spread of valuations and business prospects in Japan is very wide and will reward good stock selection. We also note that some Japanese companies are beginning to treat shareholders with more respect; are increasing dividends; and reducing wasteful expenditure on unnecessary plant and equipment. This will be good for shareholders. Not all Japanese companies will reward shareholders with change, but those that do will far outperform those that don’t.
We also agree that there have been, and still are, some poor policies adopted both by the government (which don’t look like changing) and by companies, some of which do look like they are in the midst of change. It is the growing evidence of corporate change that we think will drive the market higher. We think the stock market is in the process of being rerated and that we are on a multi-year period of Japanese outperformance. For those that actually have the experience of watching a Japanese equity bull market, this will be an opportunity.
Stay long or overweight.
Here are the reasons why; the evidence that corporate Japan finally ‘gets it’; and some stocks to ponder.
Japanese companies have been incentivised to overinvest and to skimp on dividends. This is changing. Higher dividends will improve corporate capital allocation, raise return on equity, and make Japanese equities more attractive.
Generous depreciation allowances encourage Japanese companies to invest too heavily. Appropriate for a time when Japan had a need to refurbish plant and equipment and prepare for an export drive, these overly generous depreciation allowances are no longer needed. Given their shareholders’ aging demography, Japanese companies should be investing less, and distributing more cashflow as dividends. They are – or some are.
In aggregate it takes about twice as much capital investment in Japan to generate a unit of growth as it does in the USA. One probably underinvests and the other overinvests, but Japan is a conspicuous outlier compared to all the other countries too. This relationship is known as the Incremental Capital Output Ration or ICOR. At the company level it means that there is a lot of ‘crapex’ or wasteful expenditure, driven by the desire to reduce the visibility of corporate profits and thus reduce taxes. It means you you can probably eat off the factory floor when you visit the company as an analyst, since it is so frequently refurbished to an incredible standard, but the flip side is that Japanese shareholding retirees are starved of dividends which they could use to spend and pay their (healthcare) bills.
Check out this chart for different ICOR for the G5 from Andrew Smithers. He is the first to have shown the worldwide misplaced obsession with nominal GDP in Japan with the root cause not as deflation, but as demography.
Japanese companies should be distributing more cash as dividends and reinvesting less. There are signs they are – finally.
They have a long way to go. Check out these two charts from Credit Lyonnais.
Source: Credit Lyonnais
Japanese companies are asset and cash rich. Japanese overall debt is high but owned by the Japanese themselves.
Japan is still a Net Creditor nation and generating current account surpluses. It will matter more what the Japanese think of your bond market before it matters what you think of theirs! Do not be too alarmed by comments about Japanese gross debt figures. It is the net debt figure that matters. In this regard Japan is ok. To be sure, there are some poor and wasteful policies, but fundamentally much of the corporate sector is possessed of good products, globally competitive, with a productive workforce.
The sum of corporate Japan’s profits is equal to the government’s budget deficit. Put another way, the government is mistakenly spending money to boost the economy and run up budget deficits, when all they have to do is remove the depreciation incentives for the private sector to over invest and consequently collect some more corporate tax, as the true profits are revealed. In other words the Japanese government budget deficits are huge but needless and more than matched by the corporate surplus. Under PM Abe. Japanese corporate margins are up by 50% from where they were. The pendulum has swung too far toward corporate profit RETENTION and too far away from dividends and wages. Rising dividends often mean higher share prices. More than 50% companies are net cash in Japan vs 19% in USA and cash to market cap is 23% versus 9% for USA.
From the IMF, the Net International Investment Position of:
Japan +63.8% of GDP
Germany +54.4% of GDP
Australia – 55.6% of GDP
Guess which country needs more inward capital from abroad to balance the books? This inward capital can also become outward.
Governance and Board reform is underway and will improve dividends and shareholder treatment.
Japan has had its fair share of accounting scandals (eg Olympus Optical) in recent years and its boardroom policies and board member selection positively antediluvian. This is however changing, and the Nikkei company and the Tokyo Stock Exchange, launched an index about 4 years ago, the Nikkei 400, to specifically include and weight companies based upon governance metrics, return on capital and profitability. Many Japanese listed companies are clamouring to be included in this new index, because some of the largest investment pools, such as the Government Pension Investment Fund, explicitly use this as a benchmark in preference to the other indices such as the Topix or Nikkei 225 which are not weighted toward ‘good governance’.
We attach the construction rules here:-
Quantitatively
3-year average ROE: 40%
3-year cumulative operating profit: 40%
Market capitalization on the base date for selection: 20% Qualitatively
Appointment of Independent Outside Directors (at least one-third or a minimum of three. If one-third of the total number of directors is less than two, at least two.)
Adoption or Scheduled Adoption of IFRS
Disclosure of English Earnings Information via TDnet (Company Announcements Distribution Service in English
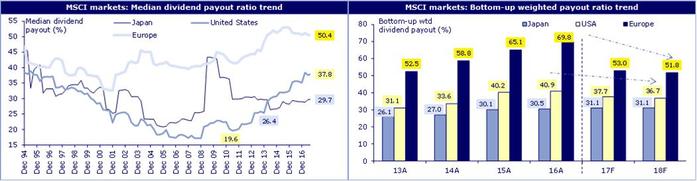
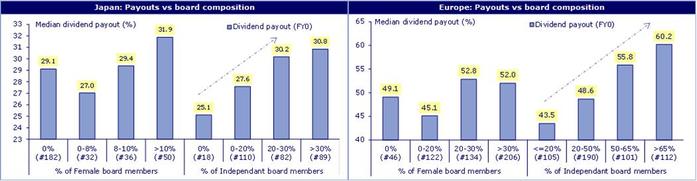
Better governance is strongly associated with better share price performance and dividends and fewer accounting shocks. We saw this trend in Europe and now expect this to occur in Japan. See that charts below comparing the payout ratio and board composition for Japan and Europe. It is quite possible that Japan follows Europe to the benefit of shareholders.
So what to buy?Stocks we like come from the globally competitive and often overlooked hardware technology sector where Japanese companies such as Disco, Hoya, Nidec and Tokyo Electron are the equal of USA and Taiwanese companies. Not all technology emanates from the USA and to solely focus on the USA stocks is a mistake. We also like Autos where exposure to emerging markets (Suzuki) and increasing respect for shareholders (Honda which has just declared it has a dividend policy with a resulting share price pop) will likely result in increasing revenue and dividends. Even the financial sector is attractive where Orix, a capital equipment leasing company (with a global fund management business in there as well) is likely to benefit from increased global investment in preparation for the One Belt One Road (OBOR) in China, and what we hope will be a “refreshment” of dilapidated USA infrastructure.
As we write this, the Japanese market has gone to 25 year highs. There may be an event known as ‘reculer pour mieux sauter” but use this as a chance to get further invested. We will be.
This week the TAMIM Australian Equity Small Cap team review some of the more interesting take aways from the November AGM season as it relates to their portfolio.
Konekt Limited (KKT.ASX)
Market cap: $52m AGM date: 16 November 2017
Workplace services provider Konekt (KKT) held its AGM during November. At the AGM, KKT confirmed forecast revenue growth of more than 70% and underlying EBITDA growth (excluding one-off items) of greater than 70%.
A key focus of the AGM was therefore on updating the market on its recent Mission Providence acquisition – pleasingly, KKT noted that there have been no surprises following completion and that the business was tracking to expectations. The acquisition diversifies KKT’s existing revenue streams, and enhances its ability to provide return-to-work (RTW) employment services, to complement its existing core offering of delivering RTW injury management programs (essentially managing the process of rehabilitating injured workers and getting them back into jobs – and where it is the current national market leader).
KKT noted the acquisition also provides KKT the capacity to enter new or underserviced markets. The logical potential new market here is providing RTW disability employment services – an attractive opportunity with the Federal Government’s 2017 budget highlighting an additional investment of over $3 billion in disability employment services to help people with disabilities get and keep long-term jobs.
A private equity fund has recently bought a majority shareholding in one of KKT’s key competitors – APM, the largest provider of disability employment services to the Federal Government (see here). Apart from this transaction, there has been growing private equity interest in the sector – possibly driven by the potential to capture some of the increasing amount of government funding committed to the disability sector.
KKT continues to trade on a PE multiple of less than 10x, with EPS growth (excluding amortization, abnormals and potential cost synergies) of 15% – 20% forecast over the next two years – a powerful combination of value and growth.
There would also appear to be little upside priced into KKT’s current share price to reflect the further growth available to KKT from the larger scale opportunities it is looking to capture, as the business transitions from its injury management focus to a larger, diverse, more integrated employment services company, operating in multi-billion dollar markets.
Joyce Corporation Limited (JYC.ASX)
Market cap: $48m AGM date: 30 November 2017
Diversified investment company Joyce Corporation reported a strong trading update at its AGM in respect of each of its businesses lines:
Lloyds online auctions – revenue growth for Q1 of FY18 of 61%
KWB Kitchens – revenue growth for Q1 of FY18 of 13%
Bedshed network – revenue growth for Q1 of FY18 of 5%
Investment properties – both now generating external rent with revaluation gains expected.
JYC continues to invest in the intellectual property and development of each business unit to ensure long term sustainable growth. JYC reiterated that on the whole, its businesses are resilient to economic cycles and are unlikely to face any significant threat from Amazon.
To summarise our investment case here, JYC has interests in:
The fastest growing, and one of the largest, online auction sites in Australia (FY17 revenue growth of 56%, and YTD growth of 61%);
The largest specialist kitchen renovation business in Australia;
A large bedding and furniture franchise business; and
Approximately $20m of recently refurbished real estate.
We view the sum of each of these equity interests to be significantly higher than JYC’s current $48m market cap.
Blackwall Limited (BWF.ASX)
Market cap: $52m AGM date: 17 November 2017
Blackwall Limited (BWF) – fund manager, property manager and manager/developer of the Wotso shared workspace business, held its AGM during November. BWF highlighted that by locating its Wotso workspaces in city fringe and suburban sites, it is able to achieve industry leading margins of 25% to 30%. This is because it incurs significantly lower rental expenses but is still able to charge similar rates for its spaces as city-based co-working spaces.
Wotso is a very fast growing business – during FY17, Wotso grew its revenue by 84% and operating profit by 93%. It manages the largest number of coworking sites in Australia, together with a Singaporean business, and is currently looking at New Zealand opportunities.
At the end of November, BWF confirmed that following the uplift in value of a fund that it manages, it had generated performance fees of approximately $11m. This fee will be converted into units in the fund – providing BWF with an ongoing income stream and the potential to benefit from further capital gains in the fund. This is an $11m asset that BWF did not have this time last year – and is quite material in the context of a $52m market cap company.
In addition to this ‘new’ asset, BWF has a number of other ‘surplus’ investment assets on its balance sheet – we estimate BWF’s net assets to be worth approximately $35m in total.
Deducting the value of these net assets from BWF’s market cap of $52m implies that BWF’s three operating businesses (the fast growing Wotso business, and BWF’s fund and property management businesses) are being valued at just $17m. The fund management business has generated performance fees of $14m in the last 6 months alone! To provide an indication of sector values for larger co-working companies, we note that WeWork, the world’s largest co-working company and Wotso’s largest Australian competitor, is currently valued at an incredible 20x its forecast
annual sales. (Wotso’s annual sales are currently tracking at approximately
$8m).
Paragon Care Limited (PGC.ASX)
Market cap: $138m AGM date: 22 November 2017
Healthcare equipment and consumables supplier, Paragon provided revenue and EBITDA guidance at its AGM which was in-line with market expectations and translates to ~10% organic EPS growth for the year (pre any acquisitions).
A number of growth drivers for PGC were articulated in the AGM
presentation:
– A growing demand for the provision of preventative equipment service and maintenance throughout the medical, scientific and allied health industries, with these recurring service revenues now expected to contribute ~10% of PGC’s FY18 revenues;
– Extending PGC’s geographic footprint – i.e. the rolling out of a new South Australian warehouse and logistics site in January 2018. Queensland and New Zealand are areas that remain underserviced
by PGC;
– PGC continues to benefit from increasing demand in the aged care sector with these revenues increasing 20% to $14m for FY17
– PGC’s e-health offering Midas, a web reporting software platform, is making strong progress towards contributing profit; and
– Strong pipeline of value accretive M&A to add to PGC’s product range, service and maintenance offering and geographical footprint are being reviewed.
Despite these positive developments the PGC share price continues to be weak. We believe the weakness can be explained by the following:
An upcoming CEO transition – short term in nature;
The market expecting a capital raise at some point to fund a potential large acquisition – again short term in nature if it happens;
Seasonality of the business becoming more pronounced as hospitals buying increasingly trends to the third and fourth quarters of the financial year (structural – but can be mitigated through increased service and maintenance and consumable revenues).
Whilst the current share price is disappointing, we expect the PGC share price to be materially higher this time next year. PGC have stated some aggressive financial targets (revenue of $250m and EBITDA of $37.5m) – and have an excellent track record in achieving its targets.