Ron Shamgar provides an update on a number of the companies held in TAMIM’s Australian equities portfolios.
Authors: Ron Shamgar
Cardno (CDD.ASX) is an environmental, government and community consultancy firm which operates with over 4,400 staff globally. The company has been overlooked by the market recently as it has been in turnaround mode for the last few years and also demerged its lab testing division, Intega (ITG.ASX), more recently, making it too small for some index funds to hold. We took advantage of this to build a position around 23 cents ($100m market cap) recently.
CDD released a strong trading update in July with the business not being impacted by Covid, benefitting in fact, as governments and corporates require help with community planning due to Covid restrictions. CDD is guiding to EBITDA of $41-$43m in FY20 and a positive net cash position. Operating cash flows were also strong and we believe there’s a good chance of dividends being reinstated. We estimate that FY21 will see further earnings growth as management has indicated a strong backlog of work. CDD is trading on a 6x PE multiple and we value it at 55 cents.
iSelect (ISU.ASX) is a price comparison site that helps consumers compare and save on Health insurance, energy and telco bills. The company has a strong and recognisable brand along with a valuable commission trail book worth 53 cents a share. We have been quietly building a position in the company at the 20-cent mark as we like the new management team and their strategy to simplify the business and cut costs.
ISU announced in July that its largest shareholder and competitor, Compare the Market, has lobbed a cash takeover offer of 40 cents. Unfortunately, the companies could not agree on some clauses related to Covid, and so the bid was cancelled for the time being (even though the price was not the issue). We think the bidder will eventually come back and may end up paying more.
In the meantime, ISU divested its loss making iMoney Asian business which will remove $4-5m of annual losses. During July, ISU grew profit substantially to $1.5m EBITDA or 65% growth on July FY19. This bodes well for profitability next year which we think can be about $15m in EBITDA. At the very least, we think ISU is worth 40 cents with potential for much more.
Tesserent (TNT.ASX) recently announced the acquisition of Canberra based cyber security firm, Seer. This now transforms TNT into the largest cyber security firm in Canberra. Seer services the federal government and defence department agencies and strengthens TNT capabilities to the government sector. More importantly, Seer is a high growth business that generated revenue of $7.6m and $2.2m in EBIT in FY20. We expect strong growth to continue next year.
In addition, TNT announced FY20 milestones of a $40m of annualised revenue run rate and reaching cash flow positivity in June. The company is now well funded with a newly established debt facility to acquire more cyber security firms in the short term. We expect at least one “bolt on” during August and a larger one thereafter. The shares reacted favourably since the deal was announced and TNT has now officially made us 5x our money since we bought the stock at 5 cents last year. We have taken some profits but still retain a sensible position.
Source: ST1 company filings
Spirit Telecom (ST1.ASX) is a modern national telco provider to businesses. The company has been transformed by their new CEO, Sol Lukatsky, who joined last year. They have blossomed from a sleepy fixed wireless infrastructure provider to an aggressive, high growth and modern national telco. ST1 has made several successive acquisitions over the last twelve months in order to offer not just a fast internet service, but also other IT services such as cloud and cyber security services, virtual hosting and IT hardware and support.
The company’s strategy revolves around their SpiritX platform which allows both business customers and telco dealers to use the online platform and see which is the best data connection for their location. ST1 offers not just its own fixed wireless network but also NBN and other provider’s fibre services. Overall, this increases the market size opportunity for ST1 and has resulted in strong growth.
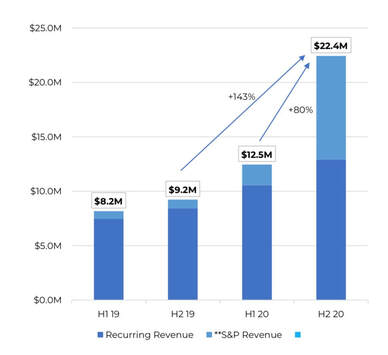
FY20 2H revenues grew 80% to $22.4m, with 14% revenue growth from Q3 to Q4. The recurring revenue base of B2B customers grew 82% in 2H. EBITDA for FY20 is approximately $3.8m. The company also recently made an acquisition of VPD which will add further growth in FY21. We see SpiritX as a strong lead generation tool with 12,000 addresses qualified through the platform in 2H. This provides visibility on customer demand and is valuable IP that the company is building.
Source: ST1 company filings
We expect ST1 to continue their acquisition of other providers in order to ensure national coverage and access to 300 telco dealers across Australia. We envisage ST1 to have an exit run rate in FY21 of over $100m in revenues and $15m of EBITDA. ST1 is currently our largest holding in the All Cap portfolio. We took our position at 21 cents and we believe that ST1 is worth 45 cents in the short term but potentially double that on successful execution of their acquisition strategy by management.
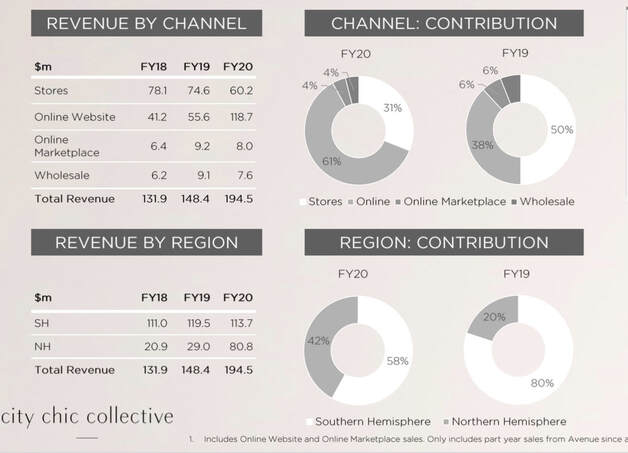
City Chic (CCX.ASX) is a leading online plus size women’s retailer. During July CCX announced the acquisition of the e-commerce assets of US based plus size retailer Catherines from bankruptcy proceedings. The deal, when successful, should add up to $90m in online sales in the US. To support the acquisition, which we estimate will cost $30m, CCX raised $90m in new equity. We have participated in this at $3.05 a share.
Management also provided FY20 financial results of 30% growth in revenues, to $195m, and about $29m in underlying EBITDA. The company finished the year with a net cash position and, together with the proceeds of the raise, should have over $60m to deploy on future deals. We expect 80% of group sales next year to come from online. The global opportunity in North America and Europe provides CCX a long runway for growth and management are astute in their opportunistic buying of other businesses. We value CCX at over $4.00.
Source: CCX company filings
Source: CGR company filings
CML group (CGR.ASX), which provides invoice financing to small and medium businesses, provided both a business update and a technology acquisition during the month. Pleasingly, CGR financed over $1.7bn in invoices during FY20 and achieved EBITDA of $20m and $8m NPAT. The company will also pay a 1.75-2 cents dividend which is an attractive yield. FY21 outlook is positive with demand increasing in June and July.
During tough economic times, invoice payments get delayed, and we are already seeing this with industry data showing invoice payment delays in June now at 49 days (compared to 15 days last year), with some industries seeing delays of over 60 days. This bodes well for CGR. The acquisition of Skippr in July provides an automated technology platform for the company to acquire smaller customers at a lower cost and thus increase their market size opportunity. We think investors will gradually begin pricing CGR as more of a fintech rather than a traditional finance company. CGR currently trades on 7.5x PE and a 6% ff yield. We value the company at more than 50 cents.
National Tyre & Wheel (NTD.ASX) is a leading national distributor of branded tyres and wheels. NTD announced the acquisition of Tyres4U for $50m in July. The acquired business is not profitable but presents an attractive opportunity for NTD to extract synergies and bring it to similar profit margins. The combined group will have over $450m of revenues and significant scale.
The deal will be financed partly through cash and a new debt facility structure with CBA bank. Following the deal we estimate net debt of about $30m. This deal presents good upside, as the group can double earnings through cost outs, but also adds further risk as the debt levels are now high. Overall we think management have shown themselves to be conservative and we think the risk reward proposition is still attractive. We value NTD at 70 cents.
Note: All stocks summarised above are held in either the TAMIM Fund: Australian All Cap or Small Cap Income portfolios.
Infrastructure companies are essential providers of facilities and structures for the effective operation of a business, state, or economy. They are indispensable to sustainable growth and enjoy stable demand, growing profitability and provide above average yields to equity investors. Robert Swift explores one such stock.
Author: Robert Swift
Listed infrastructure companies are currently very attractive investments. Many pay high sustainable dividends and their revenue streams are consistent and secure. Our estimate of the Beta of the infrastructure universe is 0.8 relative to the broader global equity universe. This means that the listed equity infrastructure category will not fall, nor rise as much as the general market. At a time when government bond yields have been suppressed to virtually zero and when equity market volatility is likely to rise, this means that the listed infrastructure ‘asset class’ offers yield and safety. Something which used to be the role of bonds, but which now appears to be beyond them?
We have termed the global infrastructure opportunity as one defined by:-
Renovation – the need to move infrastructure from 3rd World to 1st World status in the USA and much of Europe
Reinvigoration – expanding infrastructure will raise productivity and provide a fiscal multiplier boosting sustainable economic growth
Restitution – the adoption of cleaner renewable and recyclable will raise the quality of economic output.
This is a brief article on a company which fulfills all 3 criteria. It is a core holding in our Global Infrastructure strategy.
Electric utilities are key infrastructure companies, and while not the most exciting of companies to read or write about, it is often the case that boring companies can be great investments.
Nextera Energy (NEE.NYSE) in the USA has been a great investment despite just being an electricity producer, but it is interesting how it actually achieved this because it may help us to find the next “Nexteras”.
It is now the largest utility company in the world by market value and the largest producer of wind and solar energy in the world. It has certainly done well for its shareholders. Over 15 years its annualised earnings growth has been 8.4% and its dividend growth has been 9.4%. But even more impressive has been its share price rising 10x over 15 years at an annualised rate of 17%!
Given its good operational performance of earnings and dividend growth it has certainly been well managed with judicious use of capital and M&A activity. It has also played in to two key themes.
It has significantly increased the proportion of its electrical production from renewables – wind and solar power – and
has also significantly increased its battery storage technology and capacity. So, it now has the largest battery storage capacity in the world.
These have played well with institutional investors that have been under pressure to invest in a more environmentally conscious way.
A cynic may say that it has also been very good at marketing itself too and communicating all the right messages to the investment community. You won’t find much mention of the fact that it still has some of those nasty carbon burning power plants in its investor presentations!
Nextera has also explicitly targeted raising its ESG (Environmental, Social, and Governance) scores in other aspects. So Nextera has been ticking a lot of the boxes for investors. As a result, Nextera now trades at a significant valuation premium to other electric utilities at 30x PE for 2021. So, while it is likely that its best returns for shareholders are behind it but it could yet still outperform its peers; and provide a stable source of income and capital return in a world where government bond yields have been suppressed to virtually nothing.
As we move increasingly to electric vehicles (EVs) then this is likely to be a significant boost for electric producers and lead to significantly better growth prospects. So, it should become a more attractive sector with rising valuations, and we should see more M&A activity particularly in more fragmented markets like the USA. So, it’s a sector we prefer within the Global Infrastructure universe right now, with good earnings and dividend visibility in this Covid-19 economic environment.
Many countries are likely to run in to electrical capacity constraints – indeed lots of emerging economies already have capacity issues. As countries decommission oil, gas and nuclear plants so there will be a significant demand for wind turbines, solar panels, hydro electric turbines and other capital goods related to the electrical power generation industry.We are in the middle of a low carbon industrial revolution as companies commit themselves to lowering their carbon footprint. Although Covid may curtail some companies from spending money on capex to be more environmentally friendly it is unlikely to be the electrical producers where project times are long, and they usually have regulatory commitments. Key beneficiaries from project work like this would be Schneider Electric, Mitsubishi Electric, Siemens, GE, Honeywell, ABB and Vestas Wind Systems. We will write about these in the months ahead.
This week we continue our exploration of the energy thematic and look at another (perhaps misunderstood) sector, nuclear, and the potential for uranium as an investment.
Author: Sid Ruttala
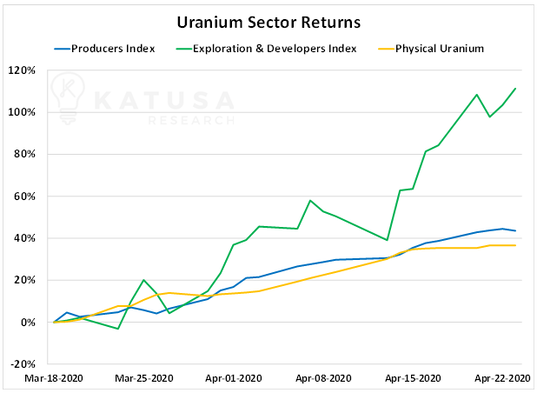
First let me start with a disclaimer, since I am particularly passionate about this topic it might cloud my judgement from taking a purely rational view. Put simply, I am of the belief that nuclear energy should play a crucial role in the energy mix of the planet going forward, despite the perhaps misguided murmurings of some lip-service environmentalists. This is even more important if one considers the very real possibility of negative emissions targets that are being set forth most recently by House Democrats in the US. As if that wasn’t enough, after years of a depressed market since the Japanese fiasco, the yellow cake has been the quiet performer this year moving from 24 USD/Llb to 34 USD/Llb at the end of June. Not a bad return in this year’s markets, especially since it didn’t seem to have any correlation with the broader market during the sell-off (an important point which we will come back to later on).
Source: Katusa Research
Some Context: Why Nuclear?
The immediate thing that comes to mind when one mentions “nuclear energy” isn’t necessarily one that makes it amenable to be bullish on the sector. Images of Chernobyl and Fukushima come to mind immediately or at best The Simpsons shenanigans regarding it, with Homer making a cake of himself at the Springfield Nuclear Power Plant or countless meltdowns and accidents over the show’s thirty year tenure (think about that, one of the most popular and widely circulated pieces of media of the last three decades consistently associates nuclear with bad things/accidents, all lorded over by an evil billionaire in Mr Burns). But the reality, in this author’s opinion (not necessarily TAMIM’s), is rather different. Nuclear energy has provided, and continues to provide, the world with stupendous amounts of clean, emission-free electric power. After all, how many people are aware that coal has killed far more people than uranium?
Perhaps most importantly, nuclear energy is a zero-emission alternative. For those of you who don’t understand the actual process, it uses fission (i.e. the splitting of atoms) to produce energy. The heat created through the fission process is turned into steam that then goes on to turn turbines. If we take the Nuclear Energy Institutes (NEI) data at face value, in 2019 the US’ use of nuclear power generation avoided the emission of more than 476m metric tons of CO2 into the atmosphere. Let me put this in context, it is the same amount released by around 100m cars and more than the combined output of all other green energy put together.
As emerging markets such as India, and others across Asia, continue to grow their economies and thus their energy consumption, it will become imperative for them to build upon their nascent power generation sectors. This is especially so as energy deficient nations such as India need to sustain their middle class and increasingly urbanized population. For example, 60% of the Indian population still lives in rural areas and will continue to shift to urban areas as the economy transforms from its agrarian roots, putting upward pressure on energy demand.
The only currently viable economic alternative for nations like India and China is coal. Given the aversion to fossil fuels and increasing pressure to reduce emissions, there will be a marked incentive for such nations to develop their nuclear footprint. This is because in densely populated nations, the most important factor when it comes to energy production is not only cost but also land footprint. It is not only expensive but downright irrational to build wind-farms where land scarcity is a significant issue. A typical 1000 megawatt nuclear facility for example requires less than 2.5 square kilometres whereas you would require 360x that in order to get the same magnitude of power generation from wind farms or 75x that space for solar photovoltaic plants. While this might change with advances in battery technology (harvesting power in land-rich nations such as Australia and exporting capacity) and increased efficiency across renewables, the scale and magnitude of the increased energy demand does not make this a viable alternative. For example, recent research from BP forecast India’s energy demand alone to grow by 156% by 2040 and if current trends are any indication, then over 58% of this will be met by coal with a subsequent increase 116% in CO2 emissions. In order to find credible alternatives we are likely to see Indian governments looking to nuclear for energy production, something that Australia was grappling with during the final years of the Howard government where the potential for uranium exports to India was effectively shelved by the election of the Rudd government.
A common argument against also stems from the waste produced but this is also completely misunderstood. One gram of uranium produces about as much energy as a ton of coal or oil and correspondingly, the actual waste is about a million times smaller, and only about 3% of the fission products are vitrified, the rest reused and recycled. For example, all of the waste produced by the US nuclear energy industry could in fact fit onto a football stadium at a depth of less than 10 meters.
Source: US Department of Energy, US Energy Information Administration
But what about the radiation? This is another rather moot point since it is a rather mistaken interpretation of the actual studies and using instances like Hiroshima/Nagasaki, Chernobyl and Fukushima is not an overly valid point. Firstly, the atomic bombs used on Hiroshima and Nagasaki and the subsequent radiation was an intentionally weaponized case. Second, there are currently 440 reactors in 30 countries while there have only been three significant meltdowns since 1957 (Source: International Atomic Energy Agency, Incident and Tracking Database), two in the Soviet Union (technology has moved on a bit since they were a thing) and the other was built on a fault line (that just doesn’t seem like a good idea in the first place). The somewhat over simplified point being? In regard to most things in my life, I would be ecstatic with a 99.3% success rate… Additionally, a moderate amount of radiation is actually essential to life. We’ve been bathing in it and radioactivity is as old as time, since our earth and the sun itself are remnants of a giant explosion, supernova. In fact even your own body is radioactive since it contains 8000 atoms disintegrating every second, half of which are potassium-40 and carbon-14. The reality is, we have identified harmful types of radiation and there are ever improving processes and technologies in place to shield us from it. Radioactivity in its broad sense is not the boogeyman it is often made out to be.
Where Is The Money?
So now that I have got that particular rant off my chest, let’s move onto the actual numbers. The debate around nuclear has seen a resurgence in recent years only as a result of the Tweeter-In-Chief’s investigation into Section 232 of the Trade Expansion Act, the short story of which is the reliance of the US upon uranium imports as opposed to domestic production. The very reason that some of the better recent performers in the space have been companies like GTI Resources (GTR.AX) with projects across Utah.
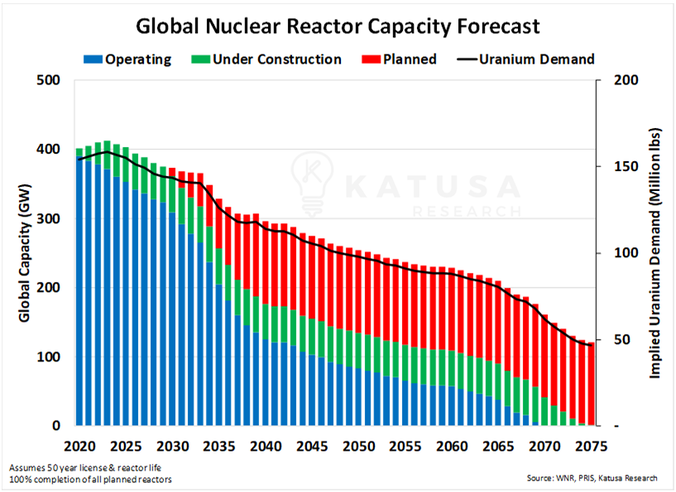
In terms of the actual numbers though, the prospect of nuclear energy is out of fashion at this point with planned increases in reactor capacity declining and many of the existing and operating reactors likely to be decommissioned without replacements over the next fifty years.
Source: Katusa Research
However, it is likely that we will see a reversion back to the mean as has always been the case with these issues. India has, in fact, committed itself to the path and China is likely to increase its own ambitions within the sector. The decommissioning and decreased building of new generation capacity is predominantly a result of public perceptions (mis!) in France and the OECD nations. We are likely to see substantial changes to this graph predominantly due to emerging markets. There is simply too much of an incentive from an efficiency perspective, for example, even though energy generation from nuclear since the 1980’s has increased by a factor of 2.5 actual input requirements in terms of fuels required only increased by 1.4.
Why Can One Be Bullish?
For one thing the supply-side gets rather interesting. Due to massive under-investment into the sector, we have seen consecutive quarters of decline in the actual production of both uranium and plutonium. Most of the global supply is dominated by Kazakhstan at 30% and Canada second. Australia is a very distant third despite this country being endowed with 30% of the proven global reserves (seems like an unexploited opportunity, doesn’t it).
Source: Paladin
Source: Paladin
In terms of the companies, the largest producers are dominated by companies in Russia, Kazataprom and the likes of Uranium One with connections to the Kremlin. As we continue to see aggressive stances made between Russia and the US we are likely to see downward pressure upon the actual supply, much the same way as sanctions against Iran and Venezuela suppressed supply in the oil markets. The Khazhak supply is likely to be re-oriented towards China (I would hazard a guess that western economies will turn to Australia’s largely untapped reserves in response). And so, while one need not be overly-bullish in the short-term based on the demand picture, the changing geopolitical picture will (we feel) lead to a gradual disentanglement of the actual prices. On-the ground prices in China, for example, are likely to be less than the global spot price.
This also creates rather good incentives for miners listed on the ASX with US assets and/or Australian exports of the finished product (with, one would hope, export restrictions to India lifted, the logic of exporting to China but not India defies us).
How To Play This?
For the conservative investors, BHP and Rio continue to have significant Uranium assets that look set to benefit from any advances in price and the capacity to increase production should prices move higher. BHP, by the way, produces around 3364 tonnes while Rio produces 1016. For the more adventurous, the old market darling Paladin (PDN.ASX), with 35m USD in cash reserves, requirement for less than 10m USD in spend and the restarting of their Namibian operations, looks attractive. The cost of production for its operations is also around 27 USD/lb and assuming a 45 USD/lb short-run (12-24 month) target we will likely see the share price more than double to 25c. For the exceptionally adventurous, GTI Resources (GTI) has been kicking goals in its exploration projects across Utah and is likely to see support from policy makers to get the projects up and running over the next 24 months.
While it would be fantastic if solar, wind and battery technology advanced enough and became cheap enough to cater to humanity’s energy demands, the reality is they currently don’t. Some additional clarification around this investment thesis too, Uranium as an investment is something I consider to be higher up in terms of the risk profile at this stage. But, should prices come back to economic equilibrium, it should reward the patient investor disproportionately.
This week we take a look at some of our current (and former) portfolio holdings and the impact recent developments both here and overseas have had on their prospects going forward, we see potential as future opportunities for investors.
Authors: Ron Shamgar
US Virus Outbreak/Surge
The US Covid-19 outbreak has, in the last few weeks, accelerated again and seen record new case numbers reported in the last few days. On Saturday alone, over 40,000 new cases were reported. This takes the total (official) cases since this started to 2.5m. The recent surges are being experienced primarily in the southern states of California, Arizona, Nevada, Florida and Texas.
Several of these states are now pulling back on their reopening plans, in some cases reinstating shutdowns for bars and other venues. Although we don’t see lockdowns being reinstated in full, it is our job to look for opportunities and we do think this trend is a positive for both Pushpay Holdings (PPH.ASX) and Marley Spoon (MMM.ASX).
PPH is a payment company enabling mobile app donations to the faith giving sector in the US. The business services over 10,000 churches and has seen a marked increase in take up as church goers stay home but still wish to connect and support their local community church. A recent profit upgrade by PPH reaffirms this trend with $74m EBITDA guidance for FY21. We expect the company to continue to grow, benefiting from this structural shift, and exceed $110m in EBITDA within two years. Given this, we think the stock could be worth in excess of $10.00.
Marley Spoon (MMM) is an online meal kit subscription business enabling consumers to order fresh ingredients according to easy to make recipes and portions to cook at home. We already saw the company benefit immensely during the lockdown period as people stayed at home and took up their services. Since then there were some concerns that growth could taper off as restrictions eased. The recent local outbreaks and the company having good exposure to the surging US market plays neatly into their outlook for at least this year. We expect a strong and profitable quarterly update in the next couple of weeks. MMM is currently trading at about half the revenue multiple of their larger peer, Hellofresh.
Wirecard’s Collapse Creates an Opportunity
Last week one of the world’s largest payment companies and a DAX top 30 German listed stock, Wirecard, was found to be trading fraudulently. Their CEO was arrested, and the business was placed into administration. The news rocked the fintech industry across Europe and the US.
For perspective: Wirecard reported (in Euros) about $2.8bn revenue and $800m EBITDA in CY2019.
Over the weekend the UK financial regulator has suspended the accounts of many of Wirecard’s digital banking customers (Pockit, Curve, Anna Money, among others) in order to protect customer funds. This has seen these providers scrambling to look for alternative and credible issuers to manage their customer programs. We believe EML Payments (EML.ASX), through its acquisition of PFS, could benefit immensely from this monumental customer churn event. Our estimates and analysis indicate an opportunity of up to $50m of revenue for EML is up for grabs in the next few months. Watch this space, execution will be key. We value EML at over $4.00.
Too Profitable? There’s a Downside
Lastly, this week Jumbo Interactive (JIN.ASX) updated the market on a renegotiated lottery ticket reseller agreement with Tabcorp (TAH.ASX). The agreement, due to expire in 2023, will now be extended to 2030 for a one-off fee of $15m. Unfortunately, the new agreement incorporates a new service fee that will phase in gradually from FY21 to FY24 and will see JIN pay an additional 4.65% of its lottery ticket sales back to TAH. We estimate this to represent a revenue hit of $28m by 2023, all lost profit for JIN.
For JIN holders this agreement is bittersweet news. It secured longevity but gives away significant margin. We wrote about JIN previously and took our position at around $9.00 about three months ago as we saw online lotteries to be a pure beneficiary from the unfolding Covid-19 situation. The stock then appreciated to $14.00 and we sold down the vast majority of our holding as our valuation of $13.00+ was exceeded. The recent update indicates that the trend toward online lotteries continues to accelerate. But, with JIN being too good at doing so and earning close to 60% EBITDA margins, it was probably never sustainable selling a product that is licensed to someone else.
Over time we expect the charity lottery business here and overseas to diversify sales away from Tabcorp. With the shift to online lotto sales only growing, we still see profits growing but at a lower rate, as the phased in service fee kicks in over time. We will continue to monitor JIN and potentially look for an opportunity to re-enter the stock as investor sentiment and enthusiasm inevitably dampens.
There’s an old saying that in a mining boom, investors should buy the companies supplying the picks and shovels. This week we present part 2 of our examination of the telco sector; we take a look at a services provider to the sector and see how it is benefiting from the surge in demand for connectivity that has been accelerated by the WFH trend.
Service Stream (SSM.ASX) provides services for Australia’s telecommunications, gas, electricity and water utilities, with large blue-chip clients including the likes of NBN Co, Telstra and a number of network owners and operators in the Australian water and energy sectors. Services provided include network design & construction, utility meter reading, replacement & installation, and the design & repair of utility assets, such as water pipelines, through the recent acquisition of Comdain.
Source: SSM company filings
We estimate that about 50% of SSM’s revenue is represented by NBN Co and Telstra. In FY19, NBN Co represented $463m of group revenue, while Telstra delivered $97m in revenue. Although in many cases the concentration of two large customers presents a risk, we believe strong demand for network connections and 5G mobile upgrades will see continued work for SSM for the next few years.
Recently NBN has recorded significant increases in the amount of traffic across its network (download traffic on 24 April at 11am was 62% above pre-COVID19 levels, upstream usage was up 117%). This is a result of individuals being forced to work from home and thus the increased use of technology like video conferencing and streaming. While this particular spike in demand is short-term, it is an acceleration of a longer term trend of increasing demand in the connectivity space as more and more aspects of our lives move online.
NBN has also revealed that activations rose 32% in March from their February levels. The 176k new premises activated in March was the highest monthly number since August 2019. In addition, SSM may also see a tailwind from further NBN maintenance & assurance activities, due to increased connections and data demand. This should materialise in increased capital and remediation activities to ensure that the network can manage the ever increasing workload.
SSM should also benefit from Telstra announcing recently that they will bring forward $500m of additional capex in the 2020 calendar year. This expenditure will be deployed to increase capacity as well as accelerate the roll out of their 5G network. We anticipate that Optus and Vodafone are likely to invest aggressively in their networks so as to stay competitive against Telstra.
SSM customers in the utilities sector are deemed essential services providers. As such, we do not foresee any issues when it comes to SSM completing their work orders. In fact, unlike many ASX listed companies that have provided trading updates, withdrawn guidance and cancelled their dividends, SSM has been very quiet since February and has paid their dividend – a very good sign in our mind.
Source: SSM company filings
We are attracted to the business not only because of industry tailwinds but also a robust balance sheet in a net cash position, $1bn in revenue forecast for FY20 and an estimated $115m in EBITDA. The company has a long history of generating significant free cash flow. In FY20, this should translate to about 16c EPS and a 10 cents fully franked (ff) dividend, which is very attractive on the last trading price of $2.10. This places the stock on a PE multiple of 13x and a dividend yield of 4.8% ff. We value SSM at $2.80.
Note: After this piece was published (20 May 2020) SSM provided a market update at 2.27pm on 21 May 2020. SSM updated the market of EBITDA guidance of $108m and strong cashflow. The company has experienced some delays on work with certain customers due to the lockdowns but nothing material that changes our medium- to long-term thesis.
Disclaimer: SSM is held in the TAMIM Australia All Cap and Small Cap Income portfolios.

 Source: ST1 company filings
 Source: CGR company filings