This week we thought it would be valuable to highlight Ron Shamgar’s recent monthly report. Ron has delivered a stellar return for our investors over the last couple of years, managing the portfolio through the covid crisis with aplomb.
Author: Ron Shamgar
During the month of February the ASX300 was up +1.48% while the Small Ords was up +1.55%.
The TAMIM Fund: Australia All Cap portfolio continued its strong outperformance for 2021 and finished the month up +4.30% net of all fees.
Calendar year to date, the portfolio is up +10.44% net of fees. The strategy has now delivered +20.37% p.a. since inception. More recently, the portfolio has returned +39.73% p.a. over the last two years.
February was a busy period as companies reported their half year results. In most cases, due to covid disruptions, many companies have regularly updated investors on their financial performance. Therefore, the devil was in the detail, so to speak.
One key feature of this reporting season and the first half of FY21 generally, was the way companies adapted their businesses to the new covid environment. In most cases cash flows were quite strong as management teams focused on working capital and cutting costs. This resulted in increased dividend payments which will flow on to investors from March.
Covid has forced companies to operate more efficiently and invest in digital capabilities in order to manage a remote workforce. We see these efficiencies remaining in the future even with the full reopening of economies and easing of restrictions.
Overall, our holdings delivered strong results. We added some new positions and cut some underperforming ones where we have lost confidence in management. We are seeing a lot of new opportunities and value emerging in many companies that should benefit from a post-covid world.
Finally, the biggest topic of discussion and concern for investors this month was long term bond yields increasing due to expectations of inflation. Generally speaking, higher yields lead to lower valuations of growth stocks as investors use this metric to value these businesses future cash flows. We have somewhat anticipated this shift and have recently moved away from some of the “Covid Winners” we have previously discussed and into companies that should benefit from the reopening trade in a post-covid world. We remain focused on the fundamentals of the businesses we own rather than macroeconomic noise. We see that alone, as the ultimate recipe for long term performance.
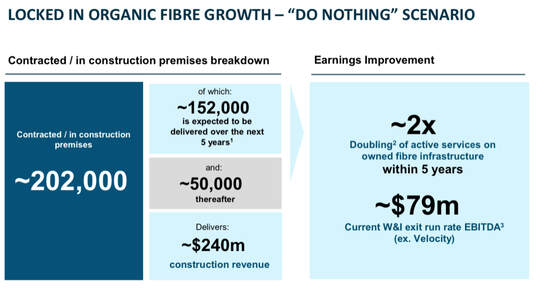
Uniti Group (UWL.ASX) delivered a pre-released result with 1H21 a revenue run rate of $200m and EBITDA of $116m while free cash flows are estimated at $72m. More importantly, approximately $100m of EBITDA will be generated by the high quality and long term wholesale and fibre division.
Source: UWL company highlights
We keep comparing UWL to a higher quality and higher growth mini version of the NBN. As such, we believe the company should be valued as a core infrastructure asset rather than a generic telco. In addition, management highlighted that over the next five years EBITDA should double to $200m purely by executing on the contracted future pipeline of fibre connections. Investors are slowly catching on to the upside and growth story in UWL and the stock has slowly re-rated towards our near term valuation of $2.50.
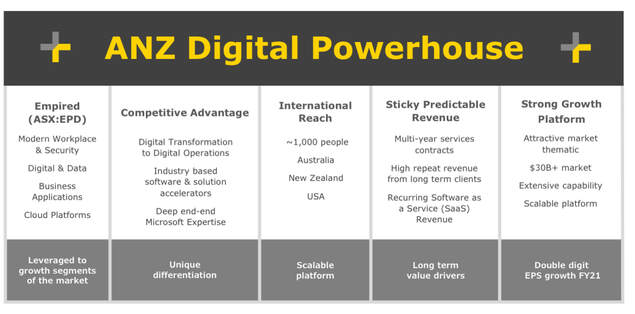
Empired Group (EPD.ASX) delivered a stellar result with revenues up 7% to $90m, EBITDA up 107% to $16.2m and NPAT of $7.7m. Operating cash flows were strong at $17.5m and the company is in a net cash position of $6m. A 1.5 cent interim dividend was also declared for the first time in six years. EPD is a beneficiary of the digital transformation undertaken by large corporates and government agencies. In addition, there is less competition from offshore IT services providers due to border closures.
Source: EPD company filings
EPD expects strong Business Applications growth to further strengthen in 2H21 with an outstanding pipeline of material contract opportunities. We see EPD delivering approximately $32m EBITDA in FY22. This translates to $15m NPAT and makes EPD look cheap at 8x PE and EV/EBITDA of 3.5x. Our valuation is $1.00.
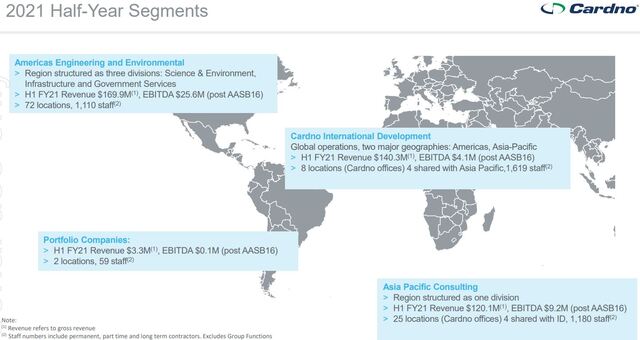
Cardno (CDD.ASX) is a professional infrastructure and environmental services consultancy. 1H revenues were down 11% to $434m while underlying EBITDA was up 10% to $25m and NPATA was $14.m. We expect full year EPS to be in the range of 6-7 cents which makes the stock look incredibly cheap at the current price of 47 cents. Our entry was 33 cents. CDD’s strong balance sheet and cash flows allowed the company to buyback 10% of shares on issue during the half. Accordingly, management declared a 1.5 cent franked dividend.
Source: CDD company filings
We see CDD as a beneficiary of the reopening trade in the post-covid world. Management also provided an upgraded guidance of EBITDA range of $45-50m (a 10% upgrade). We believe CDD is a potential takeover target if the shares remain undervalued. We value the stock at about 70 cents.
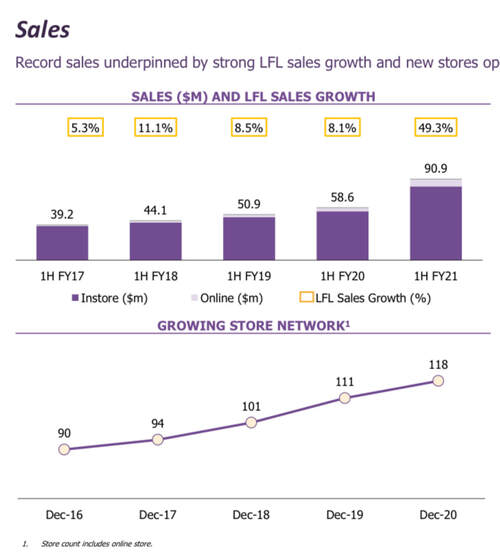
Dusk (DSK.ASX) results came in at the top end of their guidance as, like many retailers, DSK benefitted from covid consumer demand for home fragrances and decor. Sales were up 49%, online sales up 120%, and EBIT of $28.3m (excluding JobKeeper) which was up 194%. DSK also has a net cash balance of $35m. An interim dividend of 15 cents was declared. Pleasingly, management also provided a trading update for the first six weeks of 2H with sales up 55%.
Source: DSK company filings
DSK opened six new stores during the half with the store network now up to 118. Another four new stores and the refurbishment of thirty-six legacy stores is also planned for this year. Longer term, we believe DSK will have to show investors that the company can expand beyond Australia and NZ and into other markets in order to receive a higher valuation compared to peers like Lovisa (LOV.ASX). We took some profits above $3.00 as we have almost doubled our investment since our entry at around the $1.60 mark.
This week we would like to take a look at Greensill Capital and its spectacular fall from grace. Its fall, preceded by another yet bigger collapse in the form of German payment processor Wirecard, has raised many questions around the ability of regulators to keep up with changes in modern finance and left the German regulator in a shambolic situation.
Author: Sid Ruttala
A Bit of Background
So, how does a company that just two years ago had raised $961m at a lofty valuation of $6bn AUD from SoftBank and was talking up an IPO at a humble valuation of $7bn AUD (according to industry insiders) just a month ago, collapse almost overnight? What that might suggest about valuations and the IPO market in its current form may be an article in its own right but for now let’s look at what happened.
Firstly, let’s begin with what Greensill actually does. Simply put, the business, despite its later diversified revenue streams including conventional banking services and bonds (on debt it has purchased) to outside investors, operates in the world of supply-chain finance as its bread and butter. Think about it as BNPL for a supply chain. Essentially it is factoring in reverse, whereby a buyer uses a bank or financial institution to finance a suppliers invoice. Because the invoice gets immediately sold, the supplier gets immediate cash whilst the buyer has more time to pay off the cash. In this entire transaction there are three parties involved, the buyer, the supplier and the mediating financial institution (cue Greensill).
Simple, right? However, for the financial institution, there are even more hurdles. A company like Greensill needs two further things, access to immediate capital (a line of credit) to pay the suppliers on behalf of the buyers and, from a risk perspective, an ability to adequately insure the possibility of non-payment by the buyers. On face value this seems simple enough. However, problems can arise when any one of these pieces fails to work.
So, what happened?
The problem began around eight months ago, when Greensill found itself in a situation whereby the insurers, IAG (IAG.ASX) in this case, were unwilling to insure or renew around $4.6bn AUD in policies. With that first major problem, the dominos began to fall. Without insurance, there was no way that banks or financial institutions, in this instance Credit Suisse and GAM Holdings, were going to extend liquidity in order for them to make the requisite payments to their suppliers. The business model effectively falling to pieces as soon as this occurred.
There was some last minute flurry when Greensill sought an injunction in order to stop IAG from ceasing coverage. Unfortunately for Greensill, it was not until the last minute (they had found out about IAG looking to cease coverage in September 2020) that they sought to do so and the Justice cited this issue as the reason for denying the firm. Shortly following this Credit Suisse froze close to $10bn AUD in funds.
What went wrong?
This begs the question, why did IAG actually suspend coverage? What went so wrong? The answer lies not in the Greensill business model itself but around how it handled its risk and we’re quite sure that this is what IAG realised rather slowly. The big red flag for investors, including Softbank, should have come from the fact that when the firm sought a change in auditors due to increased complexity, two of the Big Four accounting firms (and the smaller BDO) all declined the business.
But let’s look at the risk and Greensill’s management of it or lack thereof, a somewhat understandable scenario given the founder and CEO’s propensity for risk-taking and making bold moves. So bold in fact that, despite the firm’s claim of over $163bn in financing and north of 10m customers, by far the biggest and most lucrative client was a single entity, GFG Alliance (the group owned by Sanjeev Gupta). This group owes close to $7.3bn AUD. Not only had the firm engaged in traditional supply-chain finance but they had made loans which were then repackaged, securitised and sold back to GAM Greensill Supply Chain Finance Fund (which has now been closed for subscriptions and redemptions).
Mr Gupta, of course, has conveniently indicated that repayments would be frozen and had previously indicated that GFG itself would file for bankruptcy should Greensill stop providing it with working capital loans. A relationship that had turned particularly toxic and was predicated much upon the personal relationship between the heads of both groups.
As if the concentration and reliance on one client wasn’t enough, it seems that, on the other end of the spectrum, IAG through its subsidiary BCC was the only substantial insurer. So, the firm in its entirety relied on one client and one insurer to make or break its business. A situation that helped it when it grew rapidly. The GFG and Greensill alliance, though now seemingly toxic, was mutually reinforcing (on the way down too it seems). On the positive for GFG, the loans from Greensill were unsecured.
For the shareholders of IAG? Despite the beating it took at the time of writing, the company has apparently managed to sell off its exposure. The subsidiary, BCC (the entity writing contracts to cover Greensill bonds), actually sold a chunk to Tokio Marine Management, itself owned by three companies all linked to the Mitsubishi UFJ Financial Group (MUFJ) keiretsu. IAG sold its 50% of BCC to Tokio on 9 April 2019 and the deal effectively wiped out any exposure to trade credit insurance. The timing was coincidental, of course. This author would like to know how Mitsubishi feels about this particular coincidence.
Where to Next?
Call me a cynic, but I for one have a feeling that it wasn’t an accident that the working capital issue was left to the last minute. Much of the recent mess may have been avoided with a timely IPO at a requisite valuation and enough of a liquidity injection. No one would have been the wiser. But for now, Apollo Global Management, the private equity firm with enough brains to see a good deal, are probably going to come out on top. They are likely to buy out the business for a tidy $127m, minus the headache of the Gupta loans of course. Remember, this is a business that still made close to $35m AUD in 2019 (that’s net profit) and, if you take out the biggest headache (GFG) and reinsure it with some capital on top, that may just be a decent deal (if done well, one might say, the deal of a lifetime).
As for the Honourable Lex Greensill CBE (oh yes, he’s that too)? The golden boy from Bundaberg might’ve fallen from grace along with his eponymous firm but, somehow, I doubt this will be the last we will see of him. For the moment, the now former rich lister might file for insolvency and be protected under safe harbour laws for whatever is left of his business (after Apollo is finished with its cannibalisation).
For us mere mortals though, it shows us some useful lessons when assessing a business. Always look to the downside, after all, it only took IAG pulling its support and a $7bn business went to 0 almost overnight.
Robert Swift takes a look at what happened in February in markets and touches on some of the adjustments made within his portfolio. This is an excerpt from Robert’s Global High Conviction report for February 2021.
Author: Robert Swift
We are at a very interesting juncture in capital markets. Equity markets have moved a long way up from the short term Covid induced nadir about a year ago. Profit taking always happens at some point and halfway through this February was that moment. Global Equity markets still rose c.2.5% in US$ terms. By way of comparison the Global Government Bond Index declined c.1% as long rates rose and the yield curve steepened.
It is still our view that for investors certain equities remain a better option than cash which yields nothing and government bonds which are fast becoming a return free risk as opposed to a risk free return. However, we want to make clear again that we are at a defining moment in capital markets and policy making.
Market participants have been told clearly and repeatedly by central banks, that there is no reason to raise interest rates. So much is clear but what is NOT clear is what the intentions are towards the longer end of the yield curve – an area which typically central bankers have left to market participants to set the price and yield. The defining moment is here because so much QE and now potentially another large fiscal programme (=8% of US GDP) has created a significant back up in the price of the 10 year US note. The SHAPE of the yield curve is steepening since investors rightly fear continued abuse of the fiat money system and continued inflation well over 2% (in some areas it is already here); and it is this and not the level of short rates that the equity market is now correctly focusing upon. What will the Fed do (they will say they are not concerned) about this?
So we will briefly make the following observations
Steeper yield curves presage stronger nominal GDP and a shift in equity styles whereby Value will do better than Growth
The time value of money with a steeper yield curve, means that it now matters WHEN profits and dividends are paid to investors. The longer you wait, the less value
Central banks will have to shortly decide whether to let this rise continue or to intervene. At some point, quite soon actually, the SHAPE of the US yield curve will be the same as it was in May 2013 when we had a big ‘taper tantrum’.
IF they decide to intervene to prevent this taper tantrum, then we will ponder how and how much AND whether they will return us to the 1950s when we had centrally directed capital allocation to buy government debt issuance. Do not rule this out. Much as the 1950s financial repression was necessitated by financing two wars, we have had a similar ‘war on Covid and have debt levels typically associated with wars.
At some point continued expansion of the Fed balance sheet will itself call into question the value of fiat money.
If they decide to return us somewhat to capitalism, and let the long end find a natural level given inflation expectations, then the long term benefits will be pleasing BUT SOME companies and bonds will not make it through. The cost of refinancing will be too high. Do not invest in loss making or companies whose multiples are stratospheric. (Scott McNealy’s words from 2001 should come to mind)
This dilemma has been handed to Jay Powell by his predecessors. This has been about 25 years in the making and asymmetrical monetary policy (always cut more than you sometimes raise) and now fiscal incontinence make for a heady combination and typically mean inflation.
Much like managing a forest – small frequent fires (recessions) are a lot better than letting the detritus build up and then having a MONSTROUS blaze (depression). Sadly we have had the latter over the last 25 years; and it has essentially been ‘monetary policy for rich people’.
There is hope! A recent but somewhat unnoticed comment came from the New York Fed President, John Williams, when he said that a higher minimum wage would work best to support the economy AND that there is some evidence that low interest rates can move asset prices disproportionately held by wealthy households. It’s a start.
Significant price changes in the month occurred in Industrials, Basic Materials and Energy companies. Valero, one of the world’s most sophisticated refining complexes, rose almost 40% in February as the market reappraised the need for non-renewable energy sources and downstream products. In Texas there was a complete blackout caused by unusually cold weather, raising the obvious point that renewables should be a piece of the generating capacity, but not all of it, and that natural gas is both clean and easily stored and transported. Texas, needless to say, has a number of peculiarities about its power system but a need for better and more investment in USA infrastructure is clear.
On March 3rd (US time) the American Society of Civil Engineers, releases its quadrennial report on the state of USA Infrastructure. Last time, in 2017, the grade was D+. Surprisingly, it went up and there will be a lot more interested readers this time.
Source: American Society of Civil Engineers
Source: American Society of Civil Engineers
Other significant company developments were Sony’s results (beat and raise) Quest Diagnostics (beat and raise) and Discovery A shares where the share price rose 25% as they announced strong subscriber growth for their streaming service. Over the last 1 2 and 3 years at the time of writing, Discovery A shares have outperformed those of Netflix.
We sold Nexon in Japan and reinvested in Kurita Water. We sold Legal & General in the UK and reinvested in Euronext the French based European exchanges owner operator. We took large profits in Hong Kong Exchanges where the share price had run up on the basis of the exchange receiving an infinite number of mainland China listings, no longer welcome via ADR in the USA. It is a large opportunity for HK in a region where other exchanges are lamentably short of large and quality companies, but everything and more is in the price. We reinvested into China Construction Bank H shares which are on a wide discount to the A shares and the Chinese financial system appears to be pulling back from wilder excesses. Some companies are allowed to default to the detriment of executives and bond holders. If only the USA was quite so enlightened.
In the medium term, infrastructure companies in the US especially will be subject to news flow surrounding the Green Energy Policy and thus volatile, but their revenue bases are stable and dividend yields attractive. The return of National Industrial Policy (also a nudge upward for inflation) will make logistics, storage and transport companies attractive – globally. Industrial companies likewise. Asia including Japan remains financially, economically and now geopolitically strong, and so is a favoured area.
Last week Sid Ruttala provided us with a list of things not to worry about, this week he goes the other way and takes a look at a couple of things to keep a eye on given the current market environment.
Author: Sid Ruttala
Last week we briefly spoke about central bank policy and the reason that investors should stay calm given some of the incentives that are currently driving the market. Subsequently we have seen some calming of treasuries Stateside (whether this has been direct intervention by the Fed we will have to wait and see) as well as in Australia where the RBA has upped its direct purchases and are buying at a rate of billions per day (see the RBA announcement here). The official cash rate remains unchanged at 0.1%, though whether this makes any difference at this point is open for discussion.
This week, I would like to look at two things to watch out for given the current market environment and the implications for investors.
Watch Out for Duration
Central banks have different incentives depending on context and policy preferences. Given the amount of government debt to be issued around the world we must accept that there is very little choice but to keep a lid on yields, there are two different ways this can be done. First, the debt is issued on the short-end and kept rolling over, in which case it is the short-end that is artificially suppressed while the long-end is left somewhat on its own (a particularly bearish case for growth stocks and gold). The second is to control the entirety in the hopes of flattening (i.e. buy longer duration along with the shorter, a situation that results in a business as usual case).
Let’s look at the first scenario and the problem faced there. People and the markets look at the long-end and assume increasing inflation expectations as well as a quicker normalisation of policy even if that is not the case.
I, as a somewhat rational economic participant, might look at the long end of the curve, for example, and expect my tax or debt servicing burden to increase sooner rather than later and as a result spend a greater portion of my income to increase savings or pay down debt as opposed to spending in the real economy. This is the conundrum faced by both Lagarde and Powell, as well as the reason they wish to calm markets in fears of stopping the recovery before it even begins.
There is also a second and seemingly more important problem that comes about under the first option, a problem more acute in nations such as Australia. That is the curious case of real estate. In particular longer duration mortgages (30 years) that make up a significant portion of the real estate market. Most longer term mortgages are tied intrinsically to the long-end of the curve, which might create a headache by 1) increasingly having people on shorter-term variable rates and/or 2) pricing a substantial chunk of would-be homeowners out of the market despite the seemingly lower interest rates.
For all intents and purposes this inhibits credit growth given that there might be a greater unwillingness to fix rates longer term or creates risks to the markets in the sense that more and more go onto variable rates. Potentially exacerbating risks further down the track as the economy becomes evermore vulnerable to even slight increases in rates.
On the other hand, let’s suppose that the above risks are unpalatable and we go to the second option and assume that central banks decide to jawbone the bond market into subservience by effective yield curve control, where increasingly longer duration is bought with the hope that inflation expectations are kept in check while the recovery takes place. This creates all-together different problems. Namely, the exacerbation of existing trends, misallocation in terms of risk as we continue to see money flood towards risk assets and the market goes into bubble-like territory (or further in). There are also the risks of an increasing zombification of the markets, something the Japanese are perhaps more familiar with after close to a two decade romance with the notion.
Somehow though, my view is that central banks will go with the first option rather than the second and hope flowery language will keep the long-end in check. This is especially so in the case of the US whose Federal Reserve has a tendency towards being reactionary rather than proactive (hence the hope part of policy making) and as was made abundantly clear during Q4 2018 when I first alluded to the impossibility of monetary policy normalisation. In Australia, there is a different incentive given the level of household wealth tied to property and the necessity of facilitating credit growth in the real estate market.
The RBA, we make the call, will have a greater willingness towards yield curve control than its counterparts. A higher proportion of variable rates and shorter duration makes the system vulnerable to liquidity squeezes.
Takeaway: Understand that if central banks refuse to control the long-end of the curve, the higher growth stocks will see red and the pivot to value will be quicker than would otherwise be the case. That’s not to say companies like Apple won’t continue to be good businesses but much of their price action in recent years has been predicated upon multiples expansion which will not be sustainable if the curve is not flattened. Think the Nifty 50 during the 1970’s which came into the decade at all time highs, they continued to perform for much of the decade and earnings continued to grow but it didn’t reflect in their share price. If you want something more recent, think of Microsoft after the dot com burst during Steve Ballmer’s time at the helm. The business continued to grow earnings with net income surging 215% and revenue more doubling, this however was not reflected in the share price (the valuation just playing catchup).
Timing
I’m sure you’ve all heard some variation of the saying “it’s not timing the market but time in the market that matters”. Remember that, now more than ever, the shorter-term movements are just that. We are just at the beginning of continued fiscal dominance globally, underwritten by the monetary side of the equation. At home, the AUD continues on a strong playing field which leaves the RBA with a lot more firepower than might be imagined given the cash rate. For example, in a circular manner, as global demand for iron ore and other commodities continues to rise due to infrastructure spending, this will continue to put upward pressure on the AUD and, as a nation with monetary sovereignty, the RBA finds itself in a position to be accommodative for longer without seeing ramifications in terms of inflation (and by doing so it also continues to help exports).
For all you property owners, this is one area you might seek to stay in for a little longer. There will come a time when this changes but long-duration assets, with an accommodative central bank that is unlikely to change course on a nominal basis, is what will continue to drive asset prices in the absence of any adjustments. I am of the fundamental belief that returns in those asset classes, just as with equities, are more a function of cost of capital than so called fundamentals like population growth (they only give you alpha and don’t account for the vast majority of the returns),
Similarly, REITS, industrials and, in adjacent categories from an income perspective, mining services companies look particularly attractive in my view. REITS and industrials, being leveraged entities that would’ve locked in longer duration as mentioned last time, will see their debt wiped away in real terms while mining services will see you benefit not only from a higher commodities prices but increased capex across the space. Where I don’t quite feel comfortable are the financials. This is due to a flat curve and arguably financial suppression on the part of the central bank, though they do remain protected species in Australia and are a more viable substitute than treasuries.
How long can this keep going? Believe me, we have seen this kind of thing before and, as we often say, remember the words of Mark Twain: “History doesn’t repeat itself, but it often rhymes.” The closest thing is probably the wartime economies of the 1940s, where fiscal dominance increased money supply while deleveraging the private sector. A period that saw inflation but on a manageable basis and where most increases in money supply were a function of direct intervention. A situation where it is central banks financing and governments “spending the money into existence.” The pandemic, one might convincingly argue, has functionally created a wartime economy.
Alongside this global pandemic we find ourselves in, we have increasingly frosty relations between global superpowers and those superpowers are vying for influence across most of the planet. If that “Cold War-time” type situation isn’t a close second to a wartime economy, I don’t know what is. In the similar period that followed WWII, the music continued to play for close to two decades even after the war, reconstruction also creating some strong growth.
WWII was devastating, yes, but equities investors continued to annualise around 9.6% p.a. Apparently even wars, be they between nations or against a virus, wont stop capital from seeking a return. Who knew? It just depends on where one looks.
Here we are, February of 2021 and it has been an interesting start to the year. For those of you that have read previous articles, you know I have been one of those outliers that has been predicting inflation and the tremendous risks posed by the bond market for a good 18-months. So, in keeping with that theme, I shall try and grapple with the interesting trading action so far. It started with a sell-off in treasuries, followed promptly by a sell-off in equities and precious metals with inflation jitters coming back into the equation.
Author: Sid Ruttala
How far we have come within the space of 12 months. Negative rates, negative energy prices to the polar opposite across everything from a resurgent oil price and a decade high in the price of Dr. Copper, a favourite inflation gauge for market participants. Add in a $1.9tn USD stimulus package and we have a seemingly perfect storm lined up.
But hang on a minute, how have inflation fears catalysed a sell-off in gold? Isn’t it meant to be a hedge? And why are energy prices so resurgent despite a considerable segment of the planet still in lockdown? Moreover, the yields at the long-end of the curve that’s on everybody’s minds are at a stellar 1.37% on US 10-years, I don’t know about the readership, that doesn’t sound like a particularly attractive prospect to me. This is especially the case when official targets for inflation are around 2% (depending on country), you’re effectively telling me I should lend you money and you will pay back less than what I gave you 10-years from now? So let us try and unpack that for a moment.
Do treasury yields actually mean what they used to?
Let me give you a couple of simple statistics.
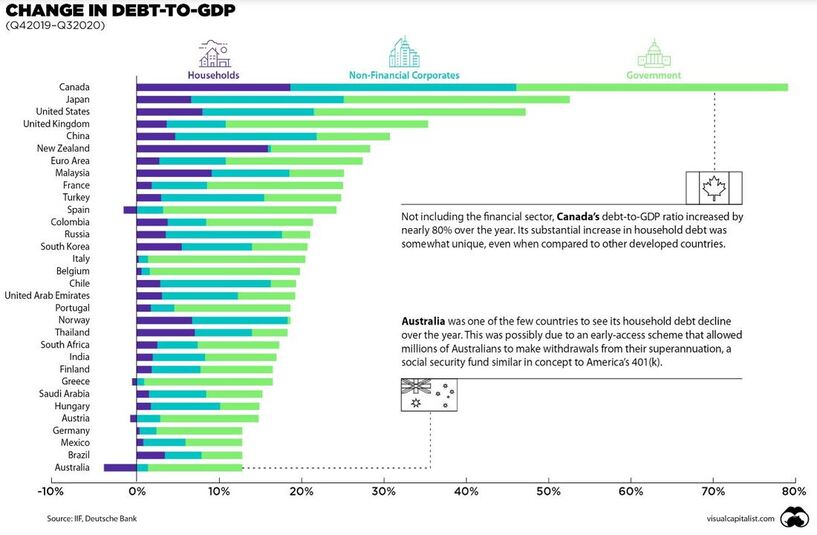
365%. That is the estimate of the global debt-to-GDP ratio to finish 2020.
106%. That was the public debt-to-GDP ratio in the US to end 2019. It is now closer to 130% (and likely to continue to grow disproportionately given the packages and budgetary measures currently under review on the Hill).
Think through this for a moment, what does even a 10 basis point increase in yield on the long-end imply in terms of debt servicing? More importantly, is any central bank likely to stomach that increase?
We have already seen Christine Lagarde of the ECB make a statement mentioning that they will be closely monitoring yields on the long-end. Stateside, Powell might very well be in a similar situation. This is not the same as the days of Volcker where debt-to-GDP ratios were a more manageable 70-80%. The tax base is not enough across most of the western world to support increases to debt-servicing requirements. The ruling out of yield curve control Stateside will, in my view, go the same direction as Lowe’s ruling out of QE in Australia back at the beginning of last year.
Source: Visual Capitalist
Simply put, yields will continue to rise as the market continues to factor in the potential for greater issuance of public debt and a resurgent economy. Where they might get it wrong, and what investors are seemingly ignoring, is a central banker caught between a rock and a hard place. There will be suppression of yields and government debt will be issued on the long-end. A scenario that increases the likelihood of inflation and yield suppression if within a reasonable range.
The government will issue, the central bank will buy, thus creating more money supply. Yes, I’ve just said it, debt monetisation. In fact, since the beginning of covid-19 the Federal Reserve has bought close $3.5tn in bonds in 2020 alone, the Bank of England allowed an overdraft of the government account and Australia has seen its central bank buy government securities, though on the shorter end of the curve, to put a lid on the yields.
Why inflation now?
It was during the depths of the GFC that central banks embarked upon then unconventional policy in the form of quantitative easing (after a certain amount of time, unconventional becomes conventional). Many doomsayers suggested that this might give rise to runaway inflation. It didn’t. Because they forgot one thing, increasing bank reserves doesn’t necessarily translate into the real economy, it just shows up in asset valuations rather than consumer discretionary spending.
However, where things change and the real economy gets impacted directly is direct stimulus measures. Take, for example, the stimulus cheques now under consideration. That is new money supply into the economy. Similarly, infrastructure projects that add to GDP but also contribute actual jobs. This comes along at the same time as increasingly frosty relationships between the major geopolitical powers of the day. I am of the view that technology wasn’t entirely the reason for the deflation of the past, rather the greatest deflationary event of the past two decades was China, which not only enabled cheaper production but stagnant wage growth across most of the western world. Something that, somewhat ironically, was good for the investor, may not have been the case for the average wage earner but, lets face it, we’ve done well out of it.
This situation of globalised supply chains led to things like Just-in-Time inventory systems, centralisation of healthcare systems, lowest cost production. All seemingly good things but what it also does is underinvestment in those very things as the costs continue to be driven down.
What happens when bottlenecks are introduced out of the blue, tough? A bottleneck like an economic lockdown due to a pandemic perhaps? Re-localisation of supply chains because of a shift in geopolitical priorities/government policy? Last week I wrote about the shortage in semiconductors within the automotive segment. We are seeing similar things in commodities, such as copper, which saw massive underinvestment for close to a decade due to uneconomic prices. But what happens if you add in potential for infrastructure projects, like renewables, while at the same time lacking an existing supply pipeline to deal with the increase? Is it any wonder that the Chinese have been the most aggressive buyers within that particular market?
So what am I trying to say?
I remain exceptionally bearish on global treasuries and USD overall. What we have seen through much of the year so far are short-term pivots. Precious metals are not selling off because the yields make such an attractive proposition, it is rather investors taking cash off the table after a run-up in the market to move towards re-allocation. If you sell-off your treasuries, the process is first to cash before you make a further allocation (thus putting a short-term upward pressure on the currency). In circular trajectory, once that happens and the yield goes up even slightly, it is the high-growth stocks (precisely those that have done well during Covid) but stand on premium valuations that get sold off (all of a sudden you can use a discount rate). Similarly, a short-term spike in the USD leads to a short-term sell-off in Gold due to the inverse correlation.
I remain of the conviction that we will see inflation coming back into the picture but not yet and yields certainly will not be going up in proportion. This is not necessarily a bad thing for the investor. It should only be concerning if said picture gets out of hand. We will continue to see accommodative monetary policy that drives markets but with the caveat that some of the higher-growth names you are used to might not see the same returns. More importantly, as fiscal expansion continues across most of the developed world, we will see every indicator of broad money supply increase and ridiculous valuations across anything that has scarcity value (even Bitcoin, though this author doesn’t quite understand that particular market).
What has been interesting to watch is the money flow towards pockets such as the Dow, industrials and emerging/Asian markets.
How to allocate?
In every economic expansion cycle over the past two centuries, inflation doesn’t hurt in the initial stages. As governments continue to occupy a greater proportion of GDP, we will see two things happen, household debt will proportionally decrease (i.e. crowding out) and corporate debt remains somewhat manageable (take a large firm such as Berkshire, for example, which issued debt at 105bps in 2020) as you effectively eat away the real value of the debt. We might quite literally have the Roaring Twenties roar back to life.
Remember that your portfolio should have three different pockets; the contrarian, income/defensive and a growth pocket. These react in different ways depending on the situation. Your defensives won’t do well in a bull market but that’s how they’re supposed to behave, precious metals fall in this category too (it doesn’t yield anything and it has no intrinsic value but it is an evergreen hedge against uncertainty, not inflation but uncertainty). Your growth will be healthcare and technology with the caveat of long secular growth stories, not the hype of the day, but SECULAR. Think about artificial intelligence, mobility or emerging markets. The third pocket, the contrarian, is the one that is an allocation assuming you have everything wrong (i.e. not contrarian to the market but contrary to your base case). Again for Australian investors, strap your belts, we are the beginning of a bull cycle in commodities.
Disclaimer: The Roaring Twenties (a name coined by Fitzgerald) weren’t “roaring” for everyone, with the most common job in the US being farming/agriculture. Harding was exceptionally kind to the investor, much like one recent ex-President, and the economy had deflation as opposed to inflation. In the words of Twain, “History doesn’t repeat itself, but it often rhymes.”
Conclusion? The music is still playing for now, it might even get louder. Dance while you can.
This is definitely worth thinking about at some point but it shouldn’t affect your investing decisions just yet.
And now a non-exhaustive list of other things life is too short to worry about:
Having one more TimTam
The lack of fundamentals behind Tesla’s share price