Over the past fortnight global equity markets have experienced a sharp and synchronised pullback. This week has added an important nuance. After the initial aggressive selloff, markets have not collapsed further, instead they have begun to oscillate. Large intra-day moves, sector rotations, and short bursts of recovery have replaced the one-way decline. That behaviour matters.
When markets fall in a straight line, the driver is usually positioning and forced selling. When they begin to swing violently in both directions, the market is no longer trying to find sellers, it is trying to find a price. Understanding the difference is critical because it tells us whether we are entering a deteriorating economic regime or simply adjusting to a new valuation framework.
At present, the evidence points strongly to the latter.
The Real Trigger: A Discount Rate Shock
The cleanest explanation for the recent market move is not earnings deterioration, geopolitical headlines, or even recession fears. It is the repricing of the discount rate.
Coming into the year, markets were positioned for a relatively comfortable environment. Inflation gradually cooling, central banks preparing to ease, growth remaining resilient, and investment in technology infrastructure continuing. That combination supports higher valuation multiples, particularly for growth and long-duration equities.
Over the past two weeks bond markets shifted that assumption. The expected path of interest rates moved slightly higher and further out. Not dramatically, but enough to change valuation mathematics.
Equities represent future cash flows discounted back to today. When the hurdle rate rises, even modestly, the present value of those future earnings falls.
The sequence we observed followed the textbook pattern:
-Long duration technology weakened first -High multiple growth followed -Small caps lost sponsorship -Broader indices eventually reacted
This is the signature of a valuation adjustment rather than an earnings collapse.
Why This Move Felt So Fast
Fundamentals rarely change in days. Positioning does. Entering 2026, investor exposure was concentrated in a handful of consensus themes: large cap growth, artificial intelligence infrastructure beneficiaries, and a broad expectation of small cap recovery. Many strategies were carrying leverage, both explicit and implicit.
When interest rate expectations shifted, selling did not occur gradually. Risk models forced it. Volatility targeting strategies reduced exposure. Leveraged portfolios cut positions. Systematic funds de-risked simultaneously. The market temporarily became flow-driven rather than information-driven.
This is why the selloff appeared indiscriminate across sectors and geographies. The market was not reacting to new economic damage. It was adjusting crowded positioning to a slightly different macro assumption.
Why Rising Yields Matter More Today
Not all rising yields are negative for equities. In a healthy expansion yields rise because growth strengthens. Today the concern is different. Markets are beginning to accept that interest rates may not return to the extremely low levels experienced over the past decade. Several forces are reinforcing this idea:
-Inflation falling but gradually (arguable) -Persistent fiscal deficits increasing bond supply -Central banks maintaining policy flexibility rather than emergency easing -A higher estimate of neutral policy rates
The implication is subtle but powerful. Valuations across asset classes may need to anchor to a structurally higher discount rate. In that environment even strong businesses can decline in price without any change to their long term outlook.
Liquidity Is Quietly Tightening
Behind the scenes, liquidity conditions have also shifted. Large government bond issuance absorbs capital that previously flowed into risk assets. Quantitative tightening removes marginal support from financial markets. Funding adjustments ripple through leveraged strategies.
Liquidity does not need to collapse to matter. It only needs to move from supportive to neutral. That transition alone is enough to compress valuations.
What This Is Not
Importantly, current market behaviour does not yet resemble a systemic crisis.
-We are not seeing widespread banking stress. -Credit markets remain orderly. -Earnings downgrades are limited.
Those characteristics define recessions and financial crises. Instead we are seeing a repricing correction, painful but fundamentally different. The distinction matters because valuation corrections recover differently from economic contractions. They typically stabilise once rates stabilise, not when growth reaccelerates.
Why This Week’s Price Action Matters
This week markets stopped falling in unison and began trading both directions. That shift suggests forced selling is moderating. The market is transitioning from liquidation to price discovery. Typically the sequence follows this pathway: First there is a sharp decline driven by flows, a volatile consolidation and then a gradual differentiation between companies
We appear to be entering the third phase. When markets begin rewarding balance sheet strength and earnings visibility even while indices remain unsettled, the foundation of recovery is forming beneath the surface.
The Australian Context
Australian equities often react with a slight delay to global interest rate volatility. The marginal buyer is international capital while domestic superannuation flows rebalance more slowly. Small and mid caps sit directly at the intersection of those forces. When global funds de-risk, liquidity contracts quickly. When stability returns, the rebound is equally sharp. Technology and SaaS companies feel this most acutely because they behave like long duration assets. Their valuations depend more on future growth assumptions than immediate cash flows. This explains why share prices can fall despite unchanged company performance. The valuation multiple changes, not the business.
What Historically Signals the Turn
Markets rarely wait for central banks to actually cut rates before turning. Instead, they tend to stabilise once interest rate volatility stops rising. Historically the sequence is consistent: bond yields peak and stop drifting higher, valuation compression comes to an end, high-quality growth companies begin to steady, and broader market participation gradually returns. Importantly, this recovery phase usually starts while economic news still feels uncertain rather than obviously improving.
What This Means For Investors
The current environment is uncomfortable but informative because it separates price volatility from genuine business deterioration. Periods like this tend to reward companies with strong balance sheets, predictable cash flows, durable demand, and disciplined capital allocation, while penalising businesses valued purely on distant expectations. Importantly, forced selling often creates temporary mispricing in companies whose long term outlook has not changed, and historically this is where long term investors have added the most value.
Tamim Takeaway
The recent market weakness appears driven primarily by valuation adjustment rather than economic damage. Interest rate expectations moved, positioning unwound, and liquidity tightened marginally.
This week’s stabilisation suggests markets are transitioning from forced selling toward price discovery.
Corrections caused by discount rate repricing tend to end when rates stabilise, not when economic growth accelerates. As volatility subsides, quality businesses typically recover first, followed by broader market participation.
Periods where prices move faster than fundamentals rarely persist. They instead create opportunities for patient capital prepared to distinguish between temporary valuation compression and permanent impairment.
Markets almost never ring a bell at the bottom. They rarely turn because investors suddenly feel optimistic. They turn because someone with better information decides the price is wrong.
That signal is not a rally. It is a takeover. We believe we are entering the early stage of a new takeover cycle, particularly in Australia, and in our experience this matters far more than trying to guess the next move in interest rates. Markets recover after confidence improves. Acquirers act before it.
Why M&A Leads Markets
Fund managers think about flows, volatility and returns. Corporate buyers think about owning the entire business for the next decade. That difference explains why takeover activity consistently precedes market recoveries.
Executives see demand trends, customer behaviour and competitive positioning long before they appear in analyst models. When they commit balance sheets to acquisitions they are effectively telling you earnings durability is stronger than the share price implies. The market waits for evidence. Buyers act on conviction. Every major recovery starts this way. The transactions come first, the rerating follows.
Why Conditions Now Support Deals
These ingredients typically create takeover cycles: cheap valuations and available capital. All now exist. Interest rates expectations have settled again and are no longer surprising markets. Small and mid caps remain well below long-term valuation averages despite operational performance holding up. At the same time private equity has accumulated significant undeployed capital after a prolonged lack of IPO exits.
For buyers the risk has flipped. Waiting risks paying more later, while acting today locks in long duration assets at discounted prices. That is the moment transactions begin.
Why Australia Becomes the Target
Australia repeatedly becomes a hunting ground in this phase of the cycle. The market contains many specialised leaders operating in niche or oligopolistic industries, but liquidity is thin. When global investors reduce exposure prices fall quickly regardless of business quality.
That creates a gap between business value and market value. Strategic buyers understand this well. Historically they have acquired Australian healthcare providers, software platforms, infrastructure services and financial businesses during similar conditions. We are starting to see that pattern re-emerge.
Private Equity Does Not Wait for Optimism
Public investors require momentum. Private equity requires stability. After two years of limited exit opportunities, funds must deploy capital. They do not need markets to rally immediately. They only need confidence earnings will not deteriorate materially. Operational improvement and valuation normalisation over time drive their returns. Public markets buy growth once it is obvious. Private equity buys before it is recognised.
Takeovers Cluster
The first transaction always looks isolated. Then another appears in the same sector. Boards reassess their own valuation gap, competitors react defensively and sponsors accelerate timelines. Suddenly it looks like a trend. In reality negotiations were occurring months earlier. By the time markets acknowledge a takeover cycle, a large portion of the opportunity has already passed.
What This Means for Investors
During takeover phases valuation is no longer set purely by trading. It is set by transactions.
Public markets price near term earnings multiples. Strategic buyers price replacement cost and long duration cash flow. The difference creates premiums and lifts valuation floors across sectors. Importantly this does not require strong economic growth, only stability. We appear to have reached that point.
Historically the sequence is consistent. Selective acquisitions occur quietly, premiums reveal undervaluation, investors reposition across similar companies, and broader small caps outperform. The takeover is not the end of the move, it is the start of it.
Where We Are Focused
Our approach in this environment is straightforward. We look for businesses where strategic ownership makes sense, where industry consolidation is logical and where valuation sits well below private market value.
Recently we have spent considerable time analysing one particular Australian opportunity that fits this framework unusually well. It is profitable, operates in a consolidating industry and carries strategic relevance significantly above its current market value. We will share more once positioning is complete.
Tamim Takeaway
Market recoveries rarely begin with optimism. They begin with informed buyers acting while sentiment remains cautious. As takeover activity increases it raises valuation floors and draws investors back into the market.
Historically the strongest returns in small and mid caps occur during this phase, not after it becomes obvious. The buyers are returning quietly and by the time the market fully recognises it, prices are usually already higher.
This week’s reading list reflects a shift toward discipline over momentum across markets and society. China is tightening oversight in an effort to engineer a “slow bull”, while global strategists point to an environment shaped by selectivity rather than broad-based risk taking. Gold’s surge past US$5,000 highlights renewed demand for defensive assets as technology stocks come under pressure, and inflation continues to quietly reshape how households spend and save. Beyond markets, deeper structural changes are unfolding. Millions are opting out of buying new altogether, oral GLP-1 treatments are beginning to disrupt the obesity-drug market, and scrutiny is growing around whether biodiversity policy is delivering measurable outcomes. These developments point to a broader reassessment of value, resilience and long-term progress across the global economy
The Ozempic moment for SaaS refers to a pivotal disruption scenario where a transformative technology threatens to erode or fundamentally reshape an established market leader’s core business model, much like the hype around Ozempic (and other GLP-1 drugs like Wegovy) did to ResMed (ASX: RMD) around 2023.
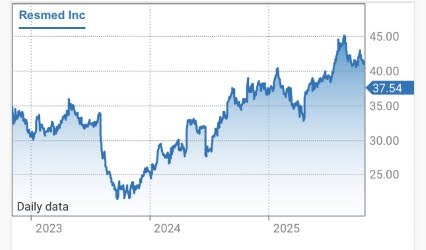
Back in mid-2023, as Ozempic exploded in popularity for dramatic weight loss, investors panicked over its potential impact on ResMed, the dominant provider of CPAP machines and sleep apnea devices. Obesity is a major risk factor for obstructive sleep apnea (OSA), affecting a large portion of patients. The fear was straightforward: if millions lost substantial weight via these drugs, demand for ResMed’s hardware; masks, flow generators, and related consumables could collapse, shrinking the addressable market and pressuring recurring revenue from resupplies and adherence.
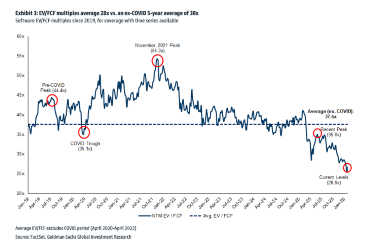
The market reaction was brutal. ResMed’s shares plunged roughly 30-40% in the second half of 2023 (from highs around $33-34 AUD to lows near $21), with some periods seeing over 25% drops tied directly to GLP-1 headlines. Analysts and headlines screamed “Ozempic overshoot” or “end of ResMed,” drawing parallels to how weight-loss drugs might cannibalize device sales. Valuations compressed sharply, with forward P/E dropping from historical averages near 30x to lows around 18-21x amid “nonsense sell-off” commentary. Investors priced in a structural decline, fearing GLP-1s would reduce OSA prevalence or adherence rates.
Source: CommSec Share Price Chart
Yet the reality diverged. By late 2023 and into 2024, ResMed’s data showed GLP-1s as a tailwind, not a headwind. Patients on these drugs entered the healthcare system more motivated, showed higher propensity to start CPAP therapy (up to 10.5% in some analyses), and maintained stable adherence/resupply. Many used combined therapies, and not all OSA stems from obesity (about 50% of cases aren’t weight-related). CEO Mick Farrell repeatedly downplayed the threat, calling fears overblown. By 2024, shares recovered strongly, with the company beating forecasts and declaring the “headwind thesis completely gone.” The initial panic proved exaggerated; the disruption was real but incremental and slower than feared, with adaptation (e.g., hybrid treatments) preserving demand.
Fast-forward to January 2026, and SaaS faces its own Ozempic moment – this time from agentic AI and generative tools. Investor sentiment toward software/SaaS companies is overwhelmingly bearish, mirroring 2023’s ResMed rout. Stocks like ServiceNow, SAP, Salesforce, Adobe, and others have seen double-digit plunges post-earnings (e.g., ServiceNow down ~10% despite beats, SAP cratering 16% on guidance shortfalls). The Philadelphia SE Software sector is down sharply, with phrases like “SaaS meltdown” and “software apocalypse” dominating commentary.
The core fear: AI agents could replace human workflows, eroding seat-based/per-user pricing models that underpin SaaS giants. One AI agent might handle tasks previously requiring multiple licensed users, enabling in-house builds or cheaper alternatives. Horizontal/point SaaS without deep proprietary data or complex integrations looks especially vulnerable to commoditization. Investors demand immediate, exponential AI-driven growth to justify elevated valuations, yet guidance often shows steady (but not explosive) 18-20% subscription increases, triggering sell-offs.
Like ResMed’s case, though, the threat may be overstated in the short term. Agentic AI adoption remains slower than hyped due to enterprise caution around trust, governance, security, and integrations. Many incumbents (e.g., Salesforce’s Agentforce, ServiceNow) are embedding AI deeply, shifting toward outcome-based or hybrid pricing. Vertical/deep-domain SaaS with proprietary workflows could endure or thrive as AI augments rather than replaces. Insiders predict evolution, SaaS reinvented as intelligent orchestration hubs, rather than outright death.
The parallel is striking: hype drives sharp deratings, but real-world data often reveals adaptation, tailwinds, and slower disruption. For SaaS today, as with ResMed then, the market may be over-discounting extinction while under-pricing resilience and reinvention. The next 12-24 months of agentic progress and adoption will tell if this is another temporary panic—or a more profound shift.
TAMIM Takeaway
Every investing cycle has its Ozempic moment, a narrative shock so compelling that the market briefly forgets how slow real-world change actually is.
ResMed lived it in 2023. The story was clean, frightening, and wrong in its timing. GLP-1 drugs did not kill sleep apnea. They nudged behaviour, pulled more patients into the system, and ultimately reinforced demand for therapy. The sell-off was real. The extinction thesis was not.
SaaS is now in the same psychological phase.
Agentic AI is genuinely transformative. But transformation does not arrive overnight, and it rarely destroys incumbents before they adapt. Enterprises move slowly, governance matters, integrations are messy, and mission-critical workflows are not casually handed to autonomous agents. The seat-based model will evolve, pricing will change, and margins will be pressured at the edges. That is not the same thing as obsolescence.
History suggests the winners will be platforms with deep customer embedment, proprietary data, and the ability to orchestrate AI rather than compete with it. Just as importantly, history suggests markets overshoot on fear before they recalibrate on facts.
For patient investors, these moments are not warnings to flee. They are invitations to think clearly while others extrapolate headlines. The SaaS extinction trade may yet prove as exaggerated as the ResMed panic, and the opportunity may lie in separating real disruption from narrative excess.
There are moments in markets when the noise gets so loud that it becomes meaningless. Every data release is framed as decisive, every central bank utterance is dissected like scripture, and every price move is treated as either confirmation or catastrophe.
Then there are quieter moments. The moments when investors sense, often without being able to articulate it, that the old playbook is fraying. That correlations are changing. That what worked cleanly for decades now works only some of the time, and sometimes not at all.
We are in one of those moments now.
Global equity markets are not breaking, but they are re-sorting themselves. The assumptions that governed portfolio construction from the early 1990s through to the post-COVID stimulus era are slowly being unlearned. Capital is no longer flowing automatically to scale, leverage, or financial engineering. It is becoming more selective. More judgement based. More demanding.
This is not a crisis. It is a transition.
And by the end of 2026, it will be obvious that global equity investing has entered a very different phase.
The End of the Easy Framework
For a long time, global equity investing benefited from three powerful tailwinds working in near perfect alignment.
Disinflation kept discount rates falling. Globalisation expanded margins and addressable markets. Liquidity suppressed volatility and rewarded duration.
You did not need to be particularly nuanced to do well. Exposure mattered more than selection. Beta did the heavy lifting. The difference between good and great investors was often measured in basis points rather than philosophy.
That era is over.
Inflation is no longer a one way variable. Supply chains are political as much as economic. Capital is no longer free, and when it is free, it is not evenly distributed. Governments are active participants in markets again, sometimes as partners, sometimes as distortions.
The result is not chaos, but friction.
And friction changes everything.
When the System Becomes the Risk
Recently, Ray Dalio observed that we are entering a period where the structure of the financial system itself matters more than the direction of markets. He was not predicting collapse. He was pointing to complexity.
That observation is important, not because it signals danger, but because it reframes the investment challenge.
In complex systems, linear thinking fails. A rate cut does not necessarily stimulate growth. A weaker currency does not automatically boost exports. Fiscal spending does not always translate into productivity. Correlations become unstable.
For global equity investors, this means that broad narratives lose power. You cannot simply be long technology, short cyclicals, overweight the US, underweight everything else, and expect a clean outcome.
What matters instead is how individual businesses interact with the system.
From Macro Bets to Micro Resilience
One of the defining features of the next phase of global equity investing will be the shift away from macro expression and towards micro resilience.
This does not mean macro is irrelevant. It means macro sets the weather, not the destination.
The businesses that will compound through 2026 and beyond will share several characteristics.
They will have pricing power that is structural rather than cyclical. They will operate in markets where demand is persistent, not discretionary. They will generate cash in real terms, not just accounting terms. They will have balance sheets that offer optionality, not fragility.
These are not fashionable attributes. They rarely screen well in momentum driven markets. They do not always tell exciting stories.
But they survive regime change.
The Repricing of Certainty
One of the quiet developments in global markets over the last eighteen months has been the repricing of certainty.
For years, investors paid up for predictability. Stable growth, recurring revenue, visible earnings. The multiple expansion that followed was logical in a world of low volatility and low inflation.
Now, predictability is still valued, but it is interrogated more aggressively.
Recurring revenue without pricing power is no longer enough. High margins without competitive durability are discounted faster. Growth without balance sheet discipline is penalised.
In 2026, certainty will not be defined by smooth earnings trajectories. It will be defined by adaptability.
The question investors will ask is not “How stable is this business today?” but “How well does this business adjust when conditions change?”
That is a very different lens.
Geography Matters Again
Another feature of the coming cycle is the return of geography as a material input into equity returns.
For much of the last decade, global equity investing was effectively US equity investing with satellite exposure elsewhere. Capital gravitated towards scale, liquidity, and index dominance. The US market became both benchmark and default.
That concentration is now being questioned.
Not because the US lacks quality businesses, but because valuation dispersion, regulatory risk, and political intervention are no longer abstract considerations. Meanwhile, parts of Europe, Japan, and selected emerging markets are offering something that was absent for a long time.
Asymmetry.
By the end of 2026, global equity portfolios that are thoughtfully diversified across regions, not for the sake of diversification but for the sake of differentiated return drivers, will look prescient rather than cautious.
Technology Without the Hype Cycle
Technology will remain central to global equity returns. But the way investors engage with it will change.
The next phase will not be about narrative adoption. It will be about economic capture.
Artificial intelligence, automation, data infrastructure, and digital platforms will continue to reshape industries. But markets will increasingly reward the companies that monetise these shifts rather than those that merely enable them.
Revenue quality will matter more than TAM narratives. Return on invested capital will matter more than user growth. Integration into real world workflows will matter more than theoretical disruption.
In 2026, technology will still dominate index weights. But stock selection within the sector will matter far more than it did during the liquidity driven years.
The Quiet Importance of Cash Flow
One of the most underappreciated dynamics in global equity investing today is the renewed importance of cash flow.
Not adjusted EBITDA. Not pro forma earnings. Actual free cash flow.
As capital becomes more expensive and less forgiving, businesses that self fund growth regain strategic control. They are not hostage to market sentiment. They can invest counter cyclically. They can acquire when others retrench.
Investors will likely look back and realise that the early winners of this cycle were not the fastest growers, but the most financially autonomous operators.
Why Concentration Will Matter More Than Ever
As markets become more complex, diversification for its own sake becomes less effective.
Owning many positions does not necessarily reduce risk if those positions are driven by the same underlying forces. In fact, it can obscure risk by giving the illusion of control.
The alternative is not recklessness. It is intentional concentration.
High conviction global equity investing is not about boldness. It is about clarity. Knowing why you own something, what could go wrong, and what would make you change your mind.
In a world of unstable correlations, conviction becomes a risk management tool rather than a stylistic preference.
What Global Equity Investing Looks Like in 2026
If we step forward and imagine the global equity landscape in 2026, several features stand out.
Returns are more dispersed. Index leadership rotates more frequently. Macro narratives matter less than business fundamentals. Balance sheets are scrutinised as closely as income statements. Geographic diversification is intentional, not cosmetic.
Most importantly, investors who succeed will not be those who predict the future most accurately, but those who build portfolios that are robust across multiple futures.
That is a subtle but profound shift.
The Discipline Beneath the Surface
The temptation in periods like this is to overreact. To trade more. To seek certainty through activity.
But history suggests the opposite approach is more effective.
Thoughtful global equity investing in the years ahead will require patience, selectivity, and a willingness to look wrong in the short term in order to be right over the long term.
It will reward investors who understand businesses rather than themes, and who accept uncertainty rather than attempt to eliminate it.
That is not a fashionable message.
It is, however, a durable one.
The TAMIM Takeaway
Global equity investing is entering a phase where judgement matters more than momentum, and resilience matters more than scale.
Portfolios built around a small number of high quality, cash generative, globally relevant businesses, selected with discipline and held with conviction, are likely to outperform those constructed around broad narratives or passive assumptions.
In an increasingly complex system, the edge does not come from predicting outcomes. It comes from owning businesses that can adapt to whatever outcomes emerge.


 Source: CommSec Share Price Chart