Robert Swift, of the TAMIM Global Equity High Conviction IMA, was recently invited to attend the ever-popular Berkshire Hathaway AGM. He has taken the time to write some notes on what he found interesting and what he observed.
Berkshire Hathaway AGM – notes from the ground
Robert Swift
It’s one of the most sought after AGMs to attend globally and it typically happens in May in Omaha, Nebraska. It is, of course, the Berkshire Hathaway AGM hosted by Warren Buffet and Charlie Munger. It is an investment and media frenzy with unbridled adulation for the duo even from wealthy investment industry veterans. To give you some idea of the frenzy, the presentation kicks off at 9am; the doors to the auditorium open at 7am, and the queue for good seats started up at 5am outside! I went with a friend who is a (happy) shareholder and he was kind enough to drop me off at 5.45am to save his place in the line. In years gone by he had his place saved by younger analysts who would sleep out overnight to ensure he got in right at the front. I was a severe disappointment to him with my lack of commitment!
I attended this year for the first time. I am glad I went and I found the whole exercise fascinating from an investment and sociological perspective.
It was actually great fun, and informative, to chat to folks queuing patiently early in the morning. There were people from all over the world, and people with plenty to say about the state of capital markets, and provide their opinions on politicians and central banks.
I also spent the previous afternoon strolling around the exhibition hall in which Berkshire showcase, and sell, as many of their products as they can. They have turned the company AGM into another profit centre. Smart to get investors to pay for your own AGM!
Rather than analyse Berkshire Hathaway which plenty of folks do, (it is one of the largest USA companies by market capitalisation) I thought it might be more interesting to make observations from the Friday and Saturday: the shopping in the exhibition hall, and the queuing, and then the Q&A at the AGM with Warren Buffet and Charlie Munger answering a very wide range of questions and dealing with some protests too.
Americans really don’t mind wealth creation. It’s clearly felt that Warren and Charlie are worth every cent they have made. There is no begrudging their fabulous wealth (Warren Buffet’s 17% stake is worth about USD$70bn) and there is no jealousy or outrage about this net worth. The only outrage came from a German activist investor in the Q&A. At least from what I saw. This attitude to successful wealth creation and the ‘equal opportunity’ is perhaps uniquely American. The obverse attitude to wealth is creeping in in some countries and that is felt to be a bad thing – at least by those queuing and they weren’t all Americans.
The consumer likes theatre and company and will spend money. Plenty of people were spending plenty of money on Friday and were seemingly buying stuff which was readily available on line or in department stores. It is no secret that the retail scene in the USA is depressed but it may be that the retailers are just doing it wrong? The trick appears to be to get crowds in and to have entertainment. It is all about getting footfall traffic because the impulse to buy, once inside, is enormous. USA retailers have waited for shoppers who then receive unsmiling service. The products haven’t been pitched and it isn’t a theatrical or memorable event but merely a transaction. Cheap ice creams and a chance to sit in a NetJets cabin; helpful and plentiful service, and some unique items for sale at this event only, all made for plenty of spending and happy people. Retailers everywhere take note. Make your spaces fun places.
There is a serious issue with the perceived ethics and integrity within the USA political and business system. By comparison, Warren Buffet, who has pledged to give away his fortune on his death, is a shining light. His statements on executive pay (too high) and incentives (too easy) went down well. He nicely illustrated the bias in current share option schemes where the strike price remains static such that the executives with such a scheme in place, can take more of the business from its owners (the shareholders) merely by doing their jobs.
Invest for the long term and let the power of compounding do its magic. Berkshire was a leading New England-based textile company. Buffett took control of Berkshire on May 10, 1965. At that time, the company had a market value of about $18 million and shareholder’s equity of about $22 million. It was a steal relative to net worth at the time but its market capitalisation is now over USD$400bn. We all try to ignore the short term but it’s hard because what we buy is typically marked to market on a daily basis. Berkshire owns outright much of what it buys and its valuation schedules allow it to look through any short term volatility.
Clearly you can’t double every year but even 8% pa with minimal volatility makes for a large number over a lifetime of investing. Be long term greedy.
Berkshire Hathaway is actually a hybrid Private Equity listed USA equity value biased business. To compare its NAV progression against the S&P 500 is incorrect and to challenge Berkshire to a performance contest with an equity fund is a mismatch. It would be better to compare its NAV progression against a pool of private equity fund returns and the S&P500. Given that Berkshire has no need to exit its investments, nor to deploy its capital raised quickly into deals it has a competitive advantage against PE funds too. While it is unique it is surprising that a hybrid like this isn’t in evidence elsewhere? Maybe Softbank in Japan is the nearest thing?
The benefits of flexibility offered by free cash flow are enormous. Too much debt is a serious problem. Markets panic routinely and the ability to deploy capital from free cash flow or having liquid assets gives you the chance to strike. Fortunes are made at the bottom not at the top. Berkshire invested about $50bn in 2008. The value of the insurance companies, owned by Berkshire, in providing this cash flow are increasingly apparent. Maybe Softbank isn’t quite there yet in not having this free cash flow?
PE funds are currently bidding up the value of private businesses making it hard to deploy capital in this area. Valuations are rich and sacrificing liquidity in the pursuit of an extra 2-3% return or for tax minimisation is currently dangerous. Valuations are also rich in government bonds and you shouldn’t be lending the government money at these interest rates either!
We hope this article is different and interesting. We are not going to try and copy Berkshire’s investing structure but interestingly have some listed companies in common.
This week the Small Cap team take a look at why investors frequently undervalue a simple but proven business and instead hit for the fences with supposed disruptors.
Why investors often undervalue simple businesses
Summary:
We have noticed that investors often gravitate towards exciting but unproven business models which promise disruption. In contrast, investors often tend to overlook more simple business models which are generating good cash flows here and now. We view this behavioural bias as a key driver behind the opportunity set we are focused upon capturing, the under-valued high quality smaller companies which consistently generate cash flows and tend to out-perform long term.
Investors love excitement!
In our experience there is a clear behavioural bias in the smaller companies’ market towards the more exciting stories. Investors often tend to gravitate towards businesses which promise to revolutionise a market in reaction to a major challenge which people can identify with. When these businesses are presenting to investors they tend to highlight the challenge they are aiming to address and then show numerous charts showing what it would mean for their business if their new approach could gain only a small portion of the entire existing market. Such presentations can dazzle investors with compelling big picture charts and very large numbers. This is how hype is created in the investment world.
Big win mentality: the driving force
So why are investors so attracted to the hype? Why does it attract highly intelligent people despite the seemingly obvious risks?
The fact of the matter is a very small portion of revolutionary business models will succeed over the long term, and thus create enormous wealth for their early shareholders along the way. As can be seen here, for example, if you had invested in Amazon at its IPO you would currently be sitting on a c.49,000% increase in value since 1997.
There are other similar examples of life changing gains in revolutionary new business models, and each story will have been told thousands of times over until it has reached near mythical status. And this is what is driving investor interest in “blue sky” business models; a belief that “this could be the one which creates life changing wealth for me”; often referred to as a big win mentality.
Putting a value on “blue sky” business models often irrelevant
At this point it is worth asking: how does one value a “blue sky” business model which is aiming to capture an emerging opportunity?
As a starting point, investors don’t have many financial metrics to focus upon since most of these companies don’t generate earnings or even revenues. As a result, investors will often look at the overall market size and work back to a fair stock value based upon successful market share capture by the business looking forward.
This backwards methodology of valuing a business pre-supposes that the business model is going to be successful over the long term, despite a complete lack of evidence.
Why “blue sky” investing doesn’t generally work…
It is obvious where we are going with this.
While a small portion of investors will benefit from Amazon like returns by investing in a revolutionary start-up, we believe there are a number of reasons which explain why investing in “blue sky” business models is generally a poor long term investment strategy:
High risk of disappointment – By investing with a strong-held assumption that an unproven business model will succeed, and valuing the business on this basis, investors are very exposed to disappointment risk.
When the disappointments come they are usually of significant size – When a new business model fails to gain traction as hoped, the difference between the expected financial performance and the actual financial performance is usually large. With large disappointments, come large share price falls.
The hit rate of highly successful “blue sky” business models is remarkably low – Most investors’ chances of being exposed to the right business model is very low as a result.
It is hard to invest with conviction in “blue sky” companies which means it is highly unlikely most investors would invest enough capital (if there is one successful “blue sky” company in their portfolio) to make the life changing gains they are aiming for. As a result, if a portfolio is exposed to one of the few successful “blue sky” business models, its positive returns will be from a low weighting, and are likely to be heavily diluted by the decreasing valuations across the less successful emerging companies in the portfolio.
Want to change lanes? Simple business models: a few simple ingredients
So what are the key aspects of a simple business model? Here is our list:
Long term trading history, preferably as a listed entity – A company which has been listed for many years is far easier to understand than a newly listed entity as a long term listed history will reveal the business’s key growth drivers and risks.
Earnings and cash flow positive – We view this as a key requisite of a simple business model. All businesses should ultimately be about generating a profit and positive operating cash flow. Rather than speculating if a business will achieve profitability in the future, we believe the true simple test is here and now.
Understand-able business model and activities – This one is key. We always ask ourselves if we genuinely understand how a company is making money. And to be honest, the answer is often no with “blue sky” business models.
Honest and competent management – When we meet a management team we want to walk away with a feeling of trust that they are running the business competently and are honest with their shareholders.
Stock example – an under-valued simple business model: PNC
Pioneer Credit Limited (ASX:PNC) is a great example from our portfolio of a simple, profitable business which is growing its earnings through sensible strategies from an excellent management team.
What does the company do?
PNC is a financial service business specialising in the purchase of debt ledgers.
Do we understand the business?
Yes, we do– the company aims to generate the highest possible pay back from each debt portfolio it purchases: i.e. the company may purchase a portfolio for only 20c in the dollar with the intention of generating as high as possible a payback in the coming years.
Does the company generate earnings and a positive cash flow?
Yes, the company recently reaffirmed its FY17 guidance of at least $10.5m statutory NPAT, while it also guided to an additional 12% increase in earnings for FY18 based on pre-announced FY18 EPS consensus of 24 cents (approx. 27 cents or $16m NPAT).
KEY PNC FINANCIAL METRICS: FY12 to FY17
Source: PNC company presentation
Does the company have a long term trading history, preferably as a listed entity?
Yes, the company has been listed for 3 years and had been highly successful for a decade prior to listing.We first invested in PNC in mid-2015, and have increased our investment in the company over time as we have become more comfortable with management, the business model and the company’s long term potential. Over that time PNC has also grown from being the minnow of the ASX listed debt collectors (after Credit Corp and Collection House) to being the second largest acquirers of ledgers in FY17.
Market awareness has increased over this time, as has broker coverage. Four brokers now cover PNC with price targets of between $2.00 and $3.05. FY18 earnings estimates are generally in line with PNC’s guidance (ranging from 27 cents to 28 cents) which puts PNC on a PE multiple of approximately 7x to 8x earnings at current prices.
Are management honest and competent?
In our experience, yes. We have met them a number of times and have always been very impressed.
Conclusion:
Call us simple but we will stick with investing in simple, profitable businesses which are growing their earnings by virtue of sound management strategies. We believe this strategy will continue to deliver superior long term returns.
This week the Small Cap team review their investment in Zenitas Healthcare Limited (ZNT.ASX).
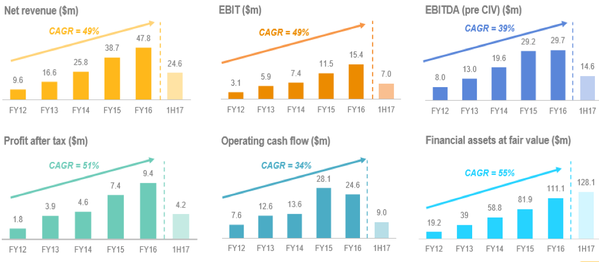
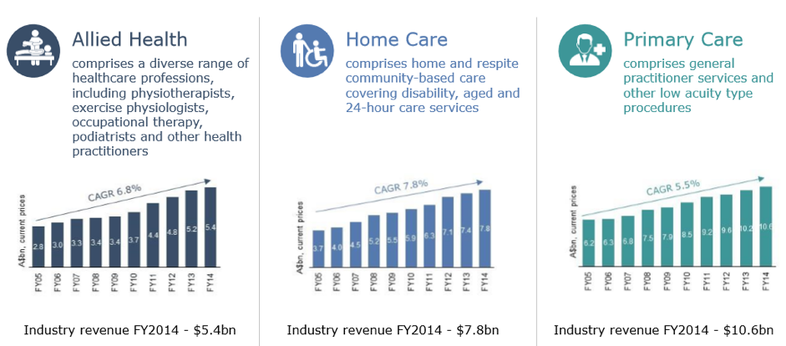
Zenitas Healthcare Limited (ZNT.ASX – formerly BGD.ASX) is a community healthcare company providing a range of community-based health services – allied care, home care & GP services. Combined, these services enable an integrated healthcare offering, primarily aimed at reducing the high cost of acute hospital care. Community healthcare is expected to benefit from supportive government policy, as community-based health services represent a cost effective solution compared to high cost hospital care. The three areas in which ZNT operates have demonstrated solid long term growth as shown below:
Source: ZNT company filings
We first invested in ZNT when it was known as BGD Corporation in December 2015, when it was undertaking a small raising to fund the acquisition of a group of profitable GP clinics (Modern Medical) and had a market capitalisation of under $5m.
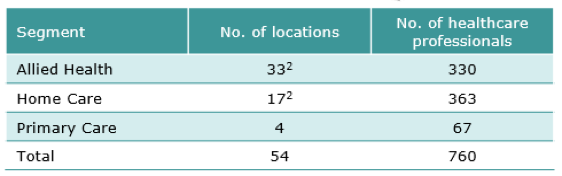
In December 2016, we increased our investment in ZNT by participating in a larger capital raising ($30m) to fund various acquisitions, which was well supported by Australian institutional investors and an Asian healthcare investor. ZNT now operates from 54 locations throughout Australia, employing 700+ health professionals, providing services across allied health, home care and primary care (GPs). ZNT now owns Australia’s largest allied health/physiotherapy business, and the first ASX listed home-care business.
Source: ZNT Prospectus (October 2016)
Note: ZNT’s Allied Health division provides home care services in WA
ZNT’s offering is unique, in that it is focused on having its three divisions (allied, home care and primary care) complement each other, through:
Offering an integrated patient care approach utilizing services from across its divisions;
Cross referrals (particularly from GP to allied health, i.e. chronic disease management);
Co-locating facilities; and
Centralised management and administration.
Since relisting in January, two brokers have commenced research coverage on ZNT:
Wilsons (current price target $1.25) noted “Zenitas Healthcare offers an exposure to the emerging Australian community-based healthcare market. We expect Zenitas will deliver solid network growth as it expands and integrates three service verticals in allied health, general practice medicine and homecare.”
Bell Potter (current price target $1.27) noted “Zenitas Healthcare is a fresh take on corporate healthcare in Australia. The business incorporates General Healthcare, Allied Healthcare and Home Care Services in an integrated model that aims to service high needs patients and the growing home care industry”.
In recent months ZNT’s Management has been focused on developing the cross referral network of the current businesses and building out practitioner numbers/utilization rates in those facilities that have excess capacity. Given the relatively fixed cost base, these initiatives offer meaningful earnings upside.
ZNT also has an extensive pipeline of acquisition opportunities currently under review that have the potential to add significant scale to each of the three ZNT verticals. ZNT currently has debt and equity funding available of up to $20m to pursue these acquisitions (equating to a possible contribution of ~$4m to $5m in EBITDA earnings).
Bell Potter have assumed FY18 earnings incorporates an additional $3m of acquired EBITDA (resulting in total EBITDA of $9.7m forecast for FY18), which flows through to their forecast EPS for FY18 of 10.5cents. On current prices, this places ZNT on an FY18 PE of under 10x and a 5% dividend yield. Wilsons are forecasting more modest acquired EBITDA ($1.4m) in FY18 in their assumptions (forecast FY18 EBITDA of $8.0m), therefore ZNT has the balance sheet capacity to comfortably exceed broker forecasts (i.e. the potential to acquire up to $5m EBITDA to add to their FY17 forecast EBITDA of $6.6m – reaffirmed by ZNT on 28 April 2017) without incurring dilution.
We like ZNT as it is in a sector supported by strong tailwinds and encouraging thematics, it is priced on an undemanding multiple, has multiple and credible pathways to grow, and is run by an experienced management team. While it is early days, (ZNT currently has a market cap of $45m), ZNT has the platform in place to become a leading national community healthcare player and respected brand, with the potential to have multiple clinics providing integrated services offerings in major cities throughout Australia.
Recent ASX announcements indicate that larger institutional investors that supported the December 2016 capital raise have been buying more stock on market. We have also been adding to our position into recent weakness, and ZNT now represents one of our larger holdings.
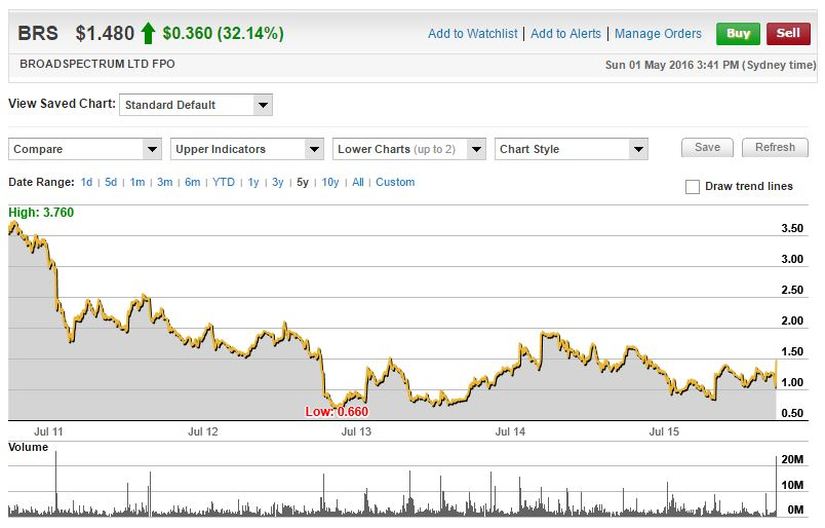
This week the portfolio finds itself exiting a long time holding Broadspectrum Limited. The company has seen its share price jump 32.1% to $1.48 over the last week, after the diversified services and contracting company decided to accept the takeover bid from Ferrovial. The company’s board had rejected the Spanish infrastructure and services giant’s advances previously, but have now unanimously recommended shareholders accept the $1.50 cash per share bid.
This weeks stock pick is from our TAMIM Australian Equity Value (TAEV) portfolio. The underlying fund, which is headed by James Williamson, has achieved a return after fees for investors of 18.4% over the last year, compared to a return of the ASX 300 of negative -9.5%.
This week the portfolio finds itself exiting a long time holding Broadspectrum Limited. The company has seen its share price jump 32.1% to $1.48 over the last week, after the diversified services and contracting company decided to accept the takeover bid from Ferrovial. The company’s board had rejected the Spanish infrastructure and services giant’s advances previously, but have now unanimously recommended shareholders accept the $1.50 cash per share bid.
Broadspectrum says it has changed its mind due to increased uncertainty over its Manus Island contract. Manus Island is where the Australian gov
ernment has been sending illegal immigrants, but the Supreme Court of Papua New Guinea recently ruled that the detention of asylum seekers was unconstitutional.
We would like to remind those who have been speaking to us about investing in this strategy, that we have TWO specific areas that we are confident in and where you’ll see us consistently making money from:
Small-cap businesses where the management team hold a large percentage of the business, thus making it unviable for most fund managers to invest in. This means that these companies often have no broker coverage, and as a result can be materially undervalued. See our previous article on WLL that has substantially outperformed the market over the last 12 months.
Stocks that have been oversold as they have disappointed (or more ideally embarrassed) investors the most in recent years. Many of these companies attract the attention of short sellers, and if we learn how the markets think and behave (which we believe we have a good handle on), can continually be taken advantage of.
Let us think about that last statement- “can continually be taken advantage of”. As professional share market investors, our clients pay for our expertise in understanding financial analysis and investor sentiment and behaviour; that is, they pay for the skills we have acquired over years that have taught us how to make your money work harder for you.
Not once, but twice we have bought and sold BRS. The company has a history of downgrades and bad news, but has been turning the company around quite nicely in recent times. We have used our investment expertise, to buy an undervalued business when the market didn’t want to know anything about it, only to turn around and sell it once the market woke up to the inherent value in the remaining assets. Similarly, our article on NPX two weeks ago, further demonstrates why you may want to have a conversation with us about managing some of your wealth.
We encourage you to read our original article and investment thesis for Transfield so that you too may learn how to spot such opportunities for yourself.
BRS Share price Chart Source: Commsec
Transfield (June 2014 Article) The share price performance of our largest investment, Transfield Services (TSE) has fallen dramatically declining -60% and -50% over 3 years and 5 years respectively, while the likes of Commonwealth Bank doubled. This negative performance brought TSE to our attention. After a brief period of averaging down our entry price, we are now generating a satisfactory return. More importantly, we believe this turnaround story is still pregnant with substantial upside for the patient investor.
We like to purchase unloved or underfollowed businesses which are being sold down by the market.
TSE has a long profitable history. Founded as a private company in 1956 the company developed into one of Australia’s leading providers of operations and maintenance service solutions in Australia. At the time of the initial public offering in early 2001 (at listing the share price was $1.60) the company was presented to investors as an investment opportunity with strong growth prospects with a bullet proof balance sheet (no debt attached to the services business, the $113.2m of borrowings shown on the balance sheet was non-recourse associated with its power generation infrastructure investments). Over the next couple of years TSE management led the company down the path of acquisitions (including offshore) and increased gearing seemingly giving investors what they wanted, fuelling further share price increases. In 2007 the TSE share price peaked over $10 with a price earnings multiple ~20 times. During this period, judging by the share price and favourable broker analyst recommendations at the time, few realised that the risk profile of the Group had increased substantially.
The Global Financial Crisis proved to be a rude awakening for TSE, leading to management changes and impairment charges. Unfortunately the acquisition binge culture did not stop with new management. The company completed the debt and equity funded drilling rigs business acquisition on peak earnings in late 2010 (Easternwell). Today profitability from the minerals and geotechnical drilling rigs acquired as part of the Easternwell acquisition have been wiped out with only profitability from the coal seam gas well servicing rigs remaining.
After this introduction to TSE you may be questioning why this company is considered one of our key investments. Firstly the share price has been one of the worst performing on the stock exchange in recent years and expectations for the company have been lowered considerably. In fact, you will be hard pressed to find any research analysts with a positive view on the company. We may well buy a lemon occasionally but hopefully only for the price of a lemon and without unrealistic earnings expectations.
Secondly, we think the appointment of Graeme Hunt as Managing Director and CEO was a step in the right direction. He has a good track record with over 37 years of industry experience, 34 of those years with BHP Billiton. More recently the appointment of Vincent Nicoletti as Chief Financial Officer (also ex BHP Billiton) and the election of wellregarded Diane Smith Gander as the non-executive independent director provides us some comfort that management and oversight of the company is in good hands. In a very short period of time Graeme has already injected life into the business by completely overhauling the risk management and tender process along with a rigorous approach to reducing costs and still unacceptably high gearing levels. The unwinding of some of the excesses of the past will still take some time but we believe TSE has turned the corner.
Thirdly, the core traditional services business in Australia and New Zealand (~70% of FY14 earnings) remains in good health and represents the bulk of earnings diversified across a number of customers and sectors. This includes managing commercial property & facilities management, operating large scale assets (i.e. Sydney Ferries), contracts on key infrastructure projects (i.e. Australia’s National Broadband Network) and responsibility for managing other government owned facilities (support services and welfare at Manus Island and Nauru more recent examples). Furthermore, earnings from the Easternwell coal seam gas well servicing rigs (~24% FY14 earnings) not only look secure but look likely to grow over time as the number of rigs in the market will have to increase to keep up with substantial demand over the next decade.
A perverse extension of human nature is to tend to see a company as higher risk immediately post a profit warning– surely the point of highest risk for an investor was prior to the share price plunge? High risk in our language is the increased chance of crystallising a loss. Along this line of thinking we don’t view TSE as a ‘terrible business’ or ‘high risk’ simply because it has disappointed investors. Frankly speaking TSE is a business with some good and bad qualities. At the current price we see TSE as a good vehicle to further enhance the value of your investment. However, when and if appropriate, from time to time we will take profits.
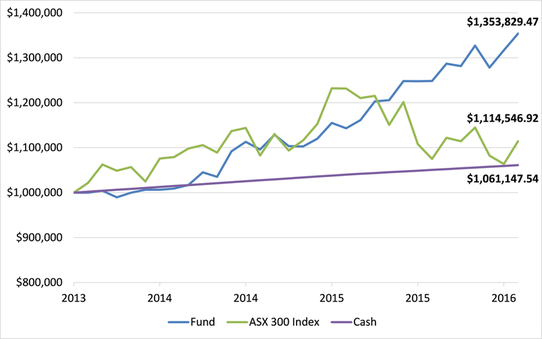
The Fund represents the Wentworth Williamson Australian Equity Fund net of fees and with distributions reinvested. The Index Represents the ASX 300 Accumulation Index and Cash represents the RBA Cash rate.
For the record the underlying fund has purchased and exited its holding in TSE (now Broadspectrum) twice. First purchasing at under one dollar and exiting at close to $2 and the second entry again below the dollar level with an exit now at $1.50.
With the federal budget upon us tonight, a federal election only a couple of months away, and period of global economic uncertainty (as there always is, don’t forget), investors often refer to attention seeking headlines. While some of these articles may be interesting reads from time to time, they add little value to our process. As the famous economist and author John Kenneth Galbraith said, “the function of economic forecasting is to make astrology look respectable”.
We will continue to focus our energy on variables we can control, researching one company after another until we have uncovered an investment opportunity that excites us. We are not in the business of buying fair value, but rather deep value.
We aim to invest in companies that in our view fall below their underlying value (often as we have a contrary view to the market for the reasons mentioned above) and sell when the price rises above our assessment of fair value. The key aspect of our investment process is determining the underlying or intrinsic value of the businesses. We therefore spend a great deal of time developing differentiated information that helps us determine the intrinsic value of a target company. This involves rigorous research and analysis of the industry and competitors, in order to construct a detailed picture of the dynamics of the market and investment being reviewed. By not limiting ourselves to any market capitalisation size or sector and by allocating more time to research and investing (rather than trading) we believe this strategy gives us a structural competitive advantage to generate returns in excess of our benchmark.
Happy investing,
This week Guy Carson, manager of the TAMIM Australian Equity All Cap Value IMA, takes a look at the Australian supermarkets, the prevailing duopoly, incoming competition from ALDI, Costco and Amazon and how the future looks for this sector.
Australian Supermarkets: The death of a duopoly Guy Carson
If you were to travel back in time five or ten years ago and asked Australian fund managers to name some of the highest quality companies listed on the ASX, there would be very good chance that a number of them would name Woolworths. For a long period of time the company was so consistent with its store roll-out, earnings growth and returns on capital that it was hard to go wrong buying the shares. Unfortunately that has all changed. Fast forward to today and ask some of the same fund managers to name one of their favourite turnaround plays and you might get the same answer, Woolworths.
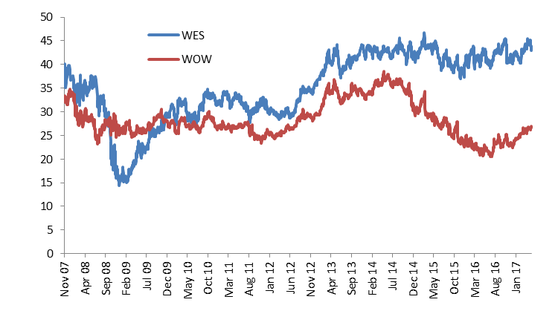
What caused this dramatic change in investors thinking? For the answer we need to look through recent history. Back in 2007, the industry structure was a cosy duopoly of Coles and Woolworths with a third player, Metcash, carving out a niche. Life was easy for Woolworths, particularly as their management stayed one step ahead of Coles in store layout design. The Coles share price was suffering and Woolworths was booming. However, the first major change to the industry was close and after rejecting two bids from private equity firm Kohlberg Kravis Roberts & Co, Coles was bought by Wesfarmers for $22bn. This was the largest ever takeover in Australian corporate history and many fund managers wrote the price off as too high and believed Wesfarmers would fail.
The initial share price reaction was negative for Wesfarmers (WES) whilst Woolworths (WOW), seen as “recession proof” by many, held up remarkably well during the GFC. Wesfarmers raised capital initially at $29 for the acquisition then was forced into another raising at $13.50. Investors in those capital raisings have done well with the share price sitting at $43 now.
Source: Thomson Reuters
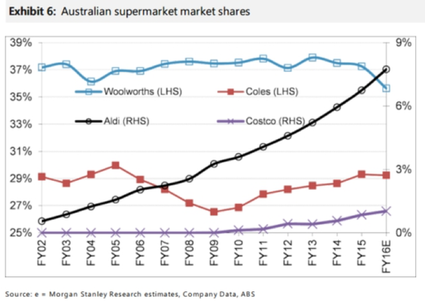
Meanwhile in 2014, Woolworths share price started to take a turn for the worse. They had begun to lose to market share. After years of mismanagement, Coles had become a legitimate competitor (arguably by copying the Woolworth’s model). In addition a new threat had emerged. After opening its first store in Australia in 2001, Aldi has opened a further 456 stores and has grown to be a significant presence with close to $7bn worth of sales last year. In comparison, Woolworth’s food division had close to $35bn of sales, and Coles had $32.5bn.
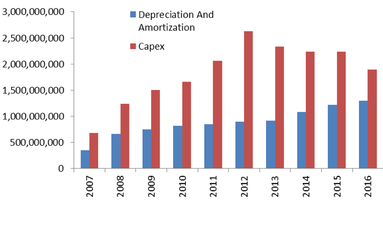
The main loser to date from Aldi’s rise has been Woolworths with Coles more or less maintaining their market share after gaining ground between 2009 and 2015. The reason behind Cole’s success during this period was twofold. Firstly under new ownership, the company spent a lot of money on store revamps to make their offering more appealable. In recent years the company has spent a significant amount of growth capex in order to catch Woolworths. The below chart compares their capex spend to their depreciation charge (a proxy for sustaining capex) to show how aggressive their spend has been.
Source: Thomson Reuters
With more appealable stores they closed the quality gap between themselves and Woolworths. The second aspect of their success was undercutting Woolworths with regards to price. Coles typically ran EBIT margins of below 5% versus Woolworths above 6%. Hence, consumers started to migrate to the cheaper option. Woolworth’s margins (which were the highest of any supermarket in the world) were simply unsustainable. The company has now realised this and has started to compete with Coles on price as can be seen by the fall in margins below.
Source: Thomson Reuters
The problem for Woolworths and Coles is that they are likely fighting for a smaller pool. The rise of Aldi is unlikely to be halted any time soon with an aggressive rollout plan. They continue to have significantly lower margins with lower grocery prices and smaller store areas (meaning lower overhead costs such as rent). EBIT margins for Aldi in Australia were 4% last year according to the ATO.
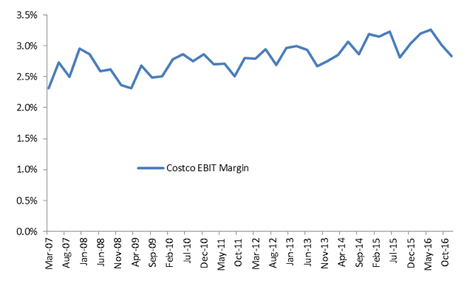
Another competitor set to gain market share is Costco, where their unique business sees them run EBIT margins of sub 3%. Costco make over three quarters of their profit from their annual membership fees (currently $55 per annum in Australia) and as a result can sell the goods to consumers near cost, hence the name.
Source: Thomson Reuters
Then there is the imminent arrival of Amazon into Australia. This is less of a worry than the above threats. Amazon has struggled to make meaningful headwinds into the US market with consumers still preferring physical stores for groceries. Their market share currently stands at around 1% of the US market and in attempt to grow that, the company is experimenting with physical stores in Seattle.
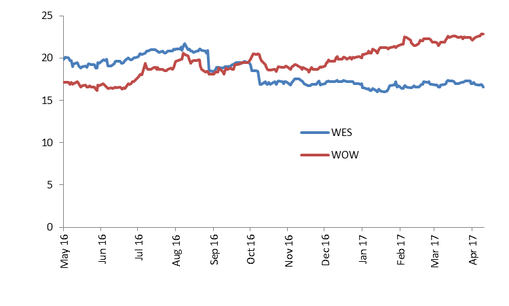
Whilst Amazon is currently grabbing headlines, the major threat for the major supermarkets remains Aldi. The constant of an aggressive low cost competitor means life will remain difficult. Despite that pressure we have seen a significant rally in the Woolworths share price since June last year. The rerating has been driven by two consecutive quarters of solid sales growth and a rerating in the Price to Earnings ratio from around 16x to 23x. Meanwhile, Wesfarmers has gone the other way and seen their P/E ratio fall from over 20x to 16x (driven by a flat share price and rising earnings from their coal division).
Source: Thomson Reuters
The rerating in Woolworth’s Price to Book valuation multiple has been to a similar scale, going from around 3x to 4.1x. A level similar to what the company traded on between 2009 and 2014.
Source: Thomson Reuters
This is despite Return on Equity (which is the return on the book value that should justify the above multiple) having fallen significantly in recent years.
Source: Thomson Reuters
From the above valuation metrics, it appears the popular trade right now is to bet on a Woolworths turnaround. If we were running an index aware strategy, we would much prefer to take the 16x on Wesfarmers instead of paying 23x for Woolworths. In addition to a cheaper valuation, Wesfarmers has the added advantage of owning Bunnings. Bunnings is a very high quality business that represents 34% of Wesfarmers EBIT, is currently growing at a double digit rate and has a return on capital employed of above 35%.
One of the great aspects of our strategy is that we aren’t benchmark aware. A company that comes into our portfolio has to stand on its own two feet and not just be a better alternative that its competitor. Whilst we would be more likely to invest in Wesfarmers than Woolworths at this point of time, we don’t due to concerns that the market is underestimating the ongoing growth of Aldi on both businesses.