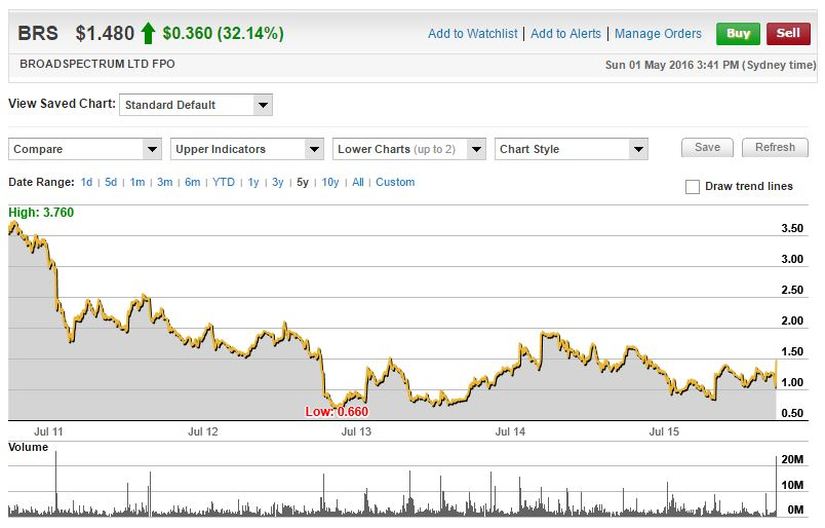
This week the portfolio finds itself exiting a long time holding Broadspectrum Limited. The company has seen its share price jump 32.1% to $1.48 over the last week, after the diversified services and contracting company decided to accept the takeover bid from Ferrovial. The company’s board had rejected the Spanish infrastructure and services giant’s advances previously, but have now unanimously recommended shareholders accept the $1.50 cash per share bid.
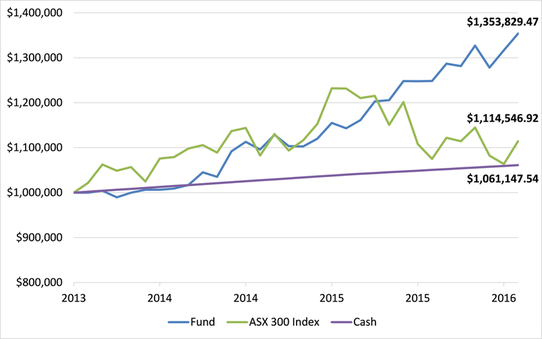
This weeks stock pick is from our TAMIM Australian Equity Value (TAEV) portfolio. The underlying fund, which is headed by James Williamson, has achieved a return after fees for investors of 18.4% over the last year, compared to a return of the ASX 300 of negative -9.5%.
This week the portfolio finds itself exiting a long time holding Broadspectrum Limited. The company has seen its share price jump 32.1% to $1.48 over the last week, after the diversified services and contracting company decided to accept the takeover bid from Ferrovial. The company’s board had rejected the Spanish infrastructure and services giant’s advances previously, but have now unanimously recommended shareholders accept the $1.50 cash per share bid.
Broadspectrum says it has changed its mind due to increased uncertainty over its Manus Island contract. Manus Island is where the Australian gov
ernment has been sending illegal immigrants, but the Supreme Court of Papua New Guinea recently ruled that the detention of asylum seekers was unconstitutional.
We would like to remind those who have been speaking to us about investing in this strategy, that we have TWO specific areas that we are confident in and where you’ll see us consistently making money from:
Small-cap businesses where the management team hold a large percentage of the business, thus making it unviable for most fund managers to invest in. This means that these companies often have no broker coverage, and as a result can be materially undervalued. See our previous article on WLL that has substantially outperformed the market over the last 12 months.
Stocks that have been oversold as they have disappointed (or more ideally embarrassed) investors the most in recent years. Many of these companies attract the attention of short sellers, and if we learn how the markets think and behave (which we believe we have a good handle on), can continually be taken advantage of.
Let us think about that last statement- “can continually be taken advantage of”. As professional share market investors, our clients pay for our expertise in understanding financial analysis and investor sentiment and behaviour; that is, they pay for the skills we have acquired over years that have taught us how to make your money work harder for you.
Not once, but twice we have bought and sold BRS. The company has a history of downgrades and bad news, but has been turning the company around quite nicely in recent times. We have used our investment expertise, to buy an undervalued business when the market didn’t want to know anything about it, only to turn around and sell it once the market woke up to the inherent value in the remaining assets. Similarly, our article on NPX two weeks ago, further demonstrates why you may want to have a conversation with us about managing some of your wealth.
We encourage you to read our original article and investment thesis for Transfield so that you too may learn how to spot such opportunities for yourself.
BRS Share price Chart Source: Commsec
Transfield (June 2014 Article) The share price performance of our largest investment, Transfield Services (TSE) has fallen dramatically declining -60% and -50% over 3 years and 5 years respectively, while the likes of Commonwealth Bank doubled. This negative performance brought TSE to our attention. After a brief period of averaging down our entry price, we are now generating a satisfactory return. More importantly, we believe this turnaround story is still pregnant with substantial upside for the patient investor.
We like to purchase unloved or underfollowed businesses which are being sold down by the market.
TSE has a long profitable history. Founded as a private company in 1956 the company developed into one of Australia’s leading providers of operations and maintenance service solutions in Australia. At the time of the initial public offering in early 2001 (at listing the share price was $1.60) the company was presented to investors as an investment opportunity with strong growth prospects with a bullet proof balance sheet (no debt attached to the services business, the $113.2m of borrowings shown on the balance sheet was non-recourse associated with its power generation infrastructure investments). Over the next couple of years TSE management led the company down the path of acquisitions (including offshore) and increased gearing seemingly giving investors what they wanted, fuelling further share price increases. In 2007 the TSE share price peaked over $10 with a price earnings multiple ~20 times. During this period, judging by the share price and favourable broker analyst recommendations at the time, few realised that the risk profile of the Group had increased substantially.
The Global Financial Crisis proved to be a rude awakening for TSE, leading to management changes and impairment charges. Unfortunately the acquisition binge culture did not stop with new management. The company completed the debt and equity funded drilling rigs business acquisition on peak earnings in late 2010 (Easternwell). Today profitability from the minerals and geotechnical drilling rigs acquired as part of the Easternwell acquisition have been wiped out with only profitability from the coal seam gas well servicing rigs remaining.
After this introduction to TSE you may be questioning why this company is considered one of our key investments. Firstly the share price has been one of the worst performing on the stock exchange in recent years and expectations for the company have been lowered considerably. In fact, you will be hard pressed to find any research analysts with a positive view on the company. We may well buy a lemon occasionally but hopefully only for the price of a lemon and without unrealistic earnings expectations.
Secondly, we think the appointment of Graeme Hunt as Managing Director and CEO was a step in the right direction. He has a good track record with over 37 years of industry experience, 34 of those years with BHP Billiton. More recently the appointment of Vincent Nicoletti as Chief Financial Officer (also ex BHP Billiton) and the election of wellregarded Diane Smith Gander as the non-executive independent director provides us some comfort that management and oversight of the company is in good hands. In a very short period of time Graeme has already injected life into the business by completely overhauling the risk management and tender process along with a rigorous approach to reducing costs and still unacceptably high gearing levels. The unwinding of some of the excesses of the past will still take some time but we believe TSE has turned the corner.
Thirdly, the core traditional services business in Australia and New Zealand (~70% of FY14 earnings) remains in good health and represents the bulk of earnings diversified across a number of customers and sectors. This includes managing commercial property & facilities management, operating large scale assets (i.e. Sydney Ferries), contracts on key infrastructure projects (i.e. Australia’s National Broadband Network) and responsibility for managing other government owned facilities (support services and welfare at Manus Island and Nauru more recent examples). Furthermore, earnings from the Easternwell coal seam gas well servicing rigs (~24% FY14 earnings) not only look secure but look likely to grow over time as the number of rigs in the market will have to increase to keep up with substantial demand over the next decade.
A perverse extension of human nature is to tend to see a company as higher risk immediately post a profit warning– surely the point of highest risk for an investor was prior to the share price plunge? High risk in our language is the increased chance of crystallising a loss. Along this line of thinking we don’t view TSE as a ‘terrible business’ or ‘high risk’ simply because it has disappointed investors. Frankly speaking TSE is a business with some good and bad qualities. At the current price we see TSE as a good vehicle to further enhance the value of your investment. However, when and if appropriate, from time to time we will take profits.
The Fund represents the Wentworth Williamson Australian Equity Fund net of fees and with distributions reinvested. The Index Represents the ASX 300 Accumulation Index and Cash represents the RBA Cash rate.
For the record the underlying fund has purchased and exited its holding in TSE (now Broadspectrum) twice. First purchasing at under one dollar and exiting at close to $2 and the second entry again below the dollar level with an exit now at $1.50.
With the federal budget upon us tonight, a federal election only a couple of months away, and period of global economic uncertainty (as there always is, don’t forget), investors often refer to attention seeking headlines. While some of these articles may be interesting reads from time to time, they add little value to our process. As the famous economist and author John Kenneth Galbraith said, “the function of economic forecasting is to make astrology look respectable”.
We will continue to focus our energy on variables we can control, researching one company after another until we have uncovered an investment opportunity that excites us. We are not in the business of buying fair value, but rather deep value.
We aim to invest in companies that in our view fall below their underlying value (often as we have a contrary view to the market for the reasons mentioned above) and sell when the price rises above our assessment of fair value. The key aspect of our investment process is determining the underlying or intrinsic value of the businesses. We therefore spend a great deal of time developing differentiated information that helps us determine the intrinsic value of a target company. This involves rigorous research and analysis of the industry and competitors, in order to construct a detailed picture of the dynamics of the market and investment being reviewed. By not limiting ourselves to any market capitalisation size or sector and by allocating more time to research and investing (rather than trading) we believe this strategy gives us a structural competitive advantage to generate returns in excess of our benchmark.
Happy investing,
This week Guy Carson, manager of the TAMIM Australian Equity All Cap Value IMA, takes a look at the Australian supermarkets, the prevailing duopoly, incoming competition from ALDI, Costco and Amazon and how the future looks for this sector.
Australian Supermarkets: The death of a duopoly Guy Carson
If you were to travel back in time five or ten years ago and asked Australian fund managers to name some of the highest quality companies listed on the ASX, there would be very good chance that a number of them would name Woolworths. For a long period of time the company was so consistent with its store roll-out, earnings growth and returns on capital that it was hard to go wrong buying the shares. Unfortunately that has all changed. Fast forward to today and ask some of the same fund managers to name one of their favourite turnaround plays and you might get the same answer, Woolworths.
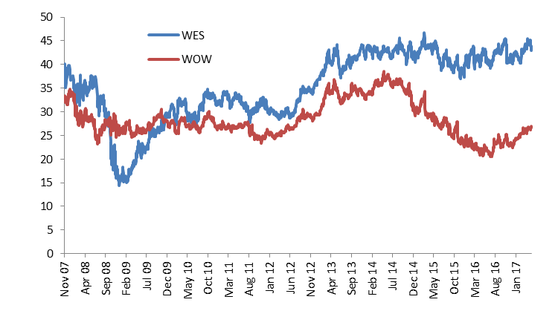
What caused this dramatic change in investors thinking? For the answer we need to look through recent history. Back in 2007, the industry structure was a cosy duopoly of Coles and Woolworths with a third player, Metcash, carving out a niche. Life was easy for Woolworths, particularly as their management stayed one step ahead of Coles in store layout design. The Coles share price was suffering and Woolworths was booming. However, the first major change to the industry was close and after rejecting two bids from private equity firm Kohlberg Kravis Roberts & Co, Coles was bought by Wesfarmers for $22bn. This was the largest ever takeover in Australian corporate history and many fund managers wrote the price off as too high and believed Wesfarmers would fail.
The initial share price reaction was negative for Wesfarmers (WES) whilst Woolworths (WOW), seen as “recession proof” by many, held up remarkably well during the GFC. Wesfarmers raised capital initially at $29 for the acquisition then was forced into another raising at $13.50. Investors in those capital raisings have done well with the share price sitting at $43 now.
Source: Thomson Reuters
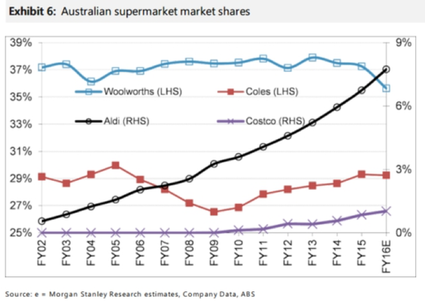
Meanwhile in 2014, Woolworths share price started to take a turn for the worse. They had begun to lose to market share. After years of mismanagement, Coles had become a legitimate competitor (arguably by copying the Woolworth’s model). In addition a new threat had emerged. After opening its first store in Australia in 2001, Aldi has opened a further 456 stores and has grown to be a significant presence with close to $7bn worth of sales last year. In comparison, Woolworth’s food division had close to $35bn of sales, and Coles had $32.5bn.
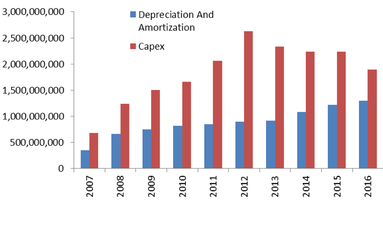
The main loser to date from Aldi’s rise has been Woolworths with Coles more or less maintaining their market share after gaining ground between 2009 and 2015. The reason behind Cole’s success during this period was twofold. Firstly under new ownership, the company spent a lot of money on store revamps to make their offering more appealable. In recent years the company has spent a significant amount of growth capex in order to catch Woolworths. The below chart compares their capex spend to their depreciation charge (a proxy for sustaining capex) to show how aggressive their spend has been.
Source: Thomson Reuters
With more appealable stores they closed the quality gap between themselves and Woolworths. The second aspect of their success was undercutting Woolworths with regards to price. Coles typically ran EBIT margins of below 5% versus Woolworths above 6%. Hence, consumers started to migrate to the cheaper option. Woolworth’s margins (which were the highest of any supermarket in the world) were simply unsustainable. The company has now realised this and has started to compete with Coles on price as can be seen by the fall in margins below.
Source: Thomson Reuters
The problem for Woolworths and Coles is that they are likely fighting for a smaller pool. The rise of Aldi is unlikely to be halted any time soon with an aggressive rollout plan. They continue to have significantly lower margins with lower grocery prices and smaller store areas (meaning lower overhead costs such as rent). EBIT margins for Aldi in Australia were 4% last year according to the ATO.
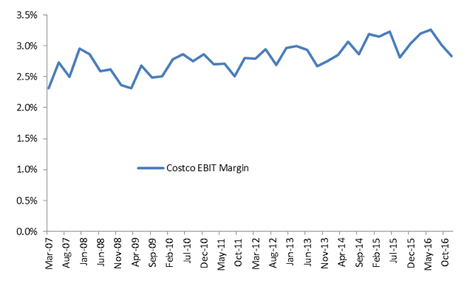
Another competitor set to gain market share is Costco, where their unique business sees them run EBIT margins of sub 3%. Costco make over three quarters of their profit from their annual membership fees (currently $55 per annum in Australia) and as a result can sell the goods to consumers near cost, hence the name.
Source: Thomson Reuters
Then there is the imminent arrival of Amazon into Australia. This is less of a worry than the above threats. Amazon has struggled to make meaningful headwinds into the US market with consumers still preferring physical stores for groceries. Their market share currently stands at around 1% of the US market and in attempt to grow that, the company is experimenting with physical stores in Seattle.
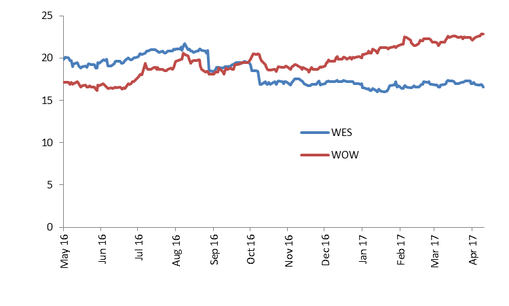
Whilst Amazon is currently grabbing headlines, the major threat for the major supermarkets remains Aldi. The constant of an aggressive low cost competitor means life will remain difficult. Despite that pressure we have seen a significant rally in the Woolworths share price since June last year. The rerating has been driven by two consecutive quarters of solid sales growth and a rerating in the Price to Earnings ratio from around 16x to 23x. Meanwhile, Wesfarmers has gone the other way and seen their P/E ratio fall from over 20x to 16x (driven by a flat share price and rising earnings from their coal division).
Source: Thomson Reuters
The rerating in Woolworth’s Price to Book valuation multiple has been to a similar scale, going from around 3x to 4.1x. A level similar to what the company traded on between 2009 and 2014.
Source: Thomson Reuters
This is despite Return on Equity (which is the return on the book value that should justify the above multiple) having fallen significantly in recent years.
Source: Thomson Reuters
From the above valuation metrics, it appears the popular trade right now is to bet on a Woolworths turnaround. If we were running an index aware strategy, we would much prefer to take the 16x on Wesfarmers instead of paying 23x for Woolworths. In addition to a cheaper valuation, Wesfarmers has the added advantage of owning Bunnings. Bunnings is a very high quality business that represents 34% of Wesfarmers EBIT, is currently growing at a double digit rate and has a return on capital employed of above 35%.
One of the great aspects of our strategy is that we aren’t benchmark aware. A company that comes into our portfolio has to stand on its own two feet and not just be a better alternative that its competitor. Whilst we would be more likely to invest in Wesfarmers than Woolworths at this point of time, we don’t due to concerns that the market is underestimating the ongoing growth of Aldi on both businesses.
Karl Hunt, of the TAMIM Global High Conviction strategy, spent a month living in a district in Shenzhen, in an attempt to better understand what was happening in the world’s second-largest economy, and to gauge what the locals were doing. Here is his report.
The Shenzhen Special Economic Zone bordering Hong Kong is the epitome of the Chinese economic “miracle”. First established by Deng Xiaoping in 1980 as China sought to establish economic reform, Shenzhen, once a fishing village of 30,000 people, has grown to have a population of 12m+ covering an area of 790 sq.miles, and a GDP of USD $284bn and GDP per capita of USD $27,230. By comparison the USA has a US$GDP per capita of $51,638 (2015, Source: Trading Economics).
It is the “Silicon Valley of China” with the Shenzhen stock exchange akin to NASDAQ, home to hi-tech stocks such as Tencent (internet search, payment, chat,etc) , ZTE (telecom equipment), Huawei (electrical goods), and BYD (electric cars). It is estimated that over 20% of China’s PhD holders work in Shenzhen.
Economic success produces asset price and wage increases. Shenzhen property prices have now surpassed Beijing as being the highest in China, with areas like Nanshang (new hi-tech central business district) boasting prices of RMB 150,000 per sq. metre (psm) – USD $2,016 per sq,ft.. To put this in to a London perspective only Knightsbridge would be higher at USD $2,430 psf and on a par with Chelsea! Reminiscent of the boom times in the West, in the suburb of Shenzhen in which I stayed, nearly every shop was a real estate agency, staffed by smartly dressed eager youngsters!
The prevalence of ostentatious wealth with premium European cars on the road (Ferrari, Maybach, Porsche, etc) abounds and puts most Middle Eastern cities like Abu Dhabi in the shade. (Though you will have to pay double the European prices for these cars due to hefty import duties).
The well-heeled also do their grocery shopping at foreign branded supermarkets like Walmart, Metro, etc where prices are above those in the West given that most of the produce is imported – it appears the middle classes often mistrust Chinese food quality/standards. Western brands and quality for everything from cars, clothes, electrical items and food are highly desirable for locals – an encouraging sign for Western companies and their aspirations to grow in China.
There is more to come. As you move from the coastal areas of Shenzhen to the interior, and the manufacturing areas, there is a stark contrast. Infrastructure becomes notably inferior – poor roads, street lighting, housing, etc. Factory workers live in rundown properties next door to chemical and plastic manufacturing plants. Here the most common form of transport is scooters (I didn’t see one person wear a helmet) or bicycle. Here you are in no doubt that you are in a 3rd world country.
Inequality is high with many professional occupations, anecdotally, appearing to earn salaries higher than those in the West in Shenzhen. By contrast semi and unskilled salaries still remain low – though they have been rising. They still have one big advantage over the West – they don’t have much of a welfare system to fund!
The question of course is, are the high growth rates and exorbitant property prices sustainable? Will capitalism continue to penetrate the interior or will government intervention and/or a crash in asset values cause a reappraisal? Even if the growth continues how can we make money as investors?
As always there are nuances to consider. A number of factors have come together to create this massive boom in house prices. The main driver is the wealthy speculating on property in the belief that the government will back stop any fall and that the migration from rural to urban areas will continue. How could this be?
This is a country that has never seen a property price crash and people have come to view property as a one-way bet. In a country where they believe the government controls everything, so too they believe that the government won’t allow property prices to fall.
China has strict currency controls and it is difficult for most people to buy overseas assets so they are forced to invest locally. They have seen volatility in stock markets and many have been burnt; so property is the staple investment for most. It is not uncommon to see large numbers of apartments, and houses that remain empty in China – they are simply bought for speculative investment.
The government has tried to curb the speculative nature of the property market so that now people can no longer buy outside their residency permit area. It hasn’t stopped prices rising so the government may need to introduce more measures. But the speculative nature of the market clearly is a cause for major concern should some event trigger a rush for the exit. Household debts are not too high at 40% of GDP, and home buyers still needing a substantial deposit to buy a house, so this may continue to persist for now.
Arguably, a more worrying near term risk is in the corporate sector where the debt has been piled up. China’s gross total debts (government, corporate and personal) now stand at an eye watering 277% of GDP at the end of 2016 up from 254% in 2015 according to UBS. The Debt/GDP ratio of the corporate sector is estimated to be 160%+ alone.
The massive increase in the number of companies, the factories – capital formation – has been financed by debt. Each industry in the West – railways, cars, chemicals, tech, etc – emerged and evolved at different times in history and the debt was accumulated across many years in lock step with GDP growth. But in China since the introduction of private enterprise in the 1970s, all sectors have seen a simultaneous expansion in the number of companies and total production capacity. So when you look at each sector, there are many more car companies, chemical companies, tech companies etc than currently exist in Western Europe for example. With cheap and plentiful availability of capital there have been far too many companies being set up and too much capacity.
When this happens, returns invariably fall.
Much of the debt is likely to turn bad. Some companies go bust, weaker ones get swallowed up, industries consolidate and a far fewer number of bigger companies emerge at the end. This process took decades to achieve in the West in most industries. But just like the rapid expansion in China the consolidation may be equally dramatic. When this disruption happens – the fallout – people lose their jobs, confidence falls, investment declines, uncertainty rises and this invariably affects property prices. Which would then have 2nd round effects as wealth falls and consumer spending gets reined in.
Ironically, without this capacity write down and consequent debt write-off, the situation for many industries looks poor because with so much capacity, there is no pricing power.
We are aware that pundits have called the “top” on China’s economy many times over the last 10 years. Although Chinese policy makers seemingly evade the question of excess capacity and continue to meddle and muddle, the government does have over $3tn in reserves which can substantially help to smooth over future bumps in the road and help to fill in “black holes” created by losses in either local government or State Owned Enterprises (SOEs). There are also fiscal programmes now in place such as “One belt one road” to improve connectivity in China and help the interior to grow and provide cheaper labour.
However, with so much over-investment, returns on capital can only come down. No government in history has yet stopped market forces eventually taking control of asset prices. It seems to me then that it’s case of “damned if you do and damned if you don’t”. Chinese companies may restructure but cause some closures and defaults or they don’t, but endure sub-par profitability for a while.
Consequently, this side of that restructuring we are staying out of cyclical basic industries in China. Without any restructuring, we are definitely staying away from Chinese companies and also those that compete against them since global pricing is likely to remain irrational. This is also known as ‘dumping’ and has been a major impediment to Western companies’ profitability and a source of political friction.
Following on from a previous article – Australian Banks: The death of a 25 year bull market – last week, this week we highlight an article from Sam Ferraro on APRA and the impact their macro-prudential changes will have on the banks. While the article is slightly more technical, it may be one of the more important reads on the banks this year.
– Evidente –
APRA’s quest for an unquestionably strong financial system continues Penned April 6, 2017
It has been a good week for APRA and the RBA. Their announcements surrounding the expansion of the use of macro-prudential policy tools and warnings around slow growth in rents and the outlook for property prices have had the initial desired effect of maximum media coverage. They would hope that lenders and potential property investors are getting the message.
The head of APRA yesterday, further weighed in on the debate surrounding banks’ loss absorbing capital buffers. Mr Wayne Byres had already bought into the key recommendation from the Financial System Inquiry (FSI) that Australia’s financial system should be unquestionably strong due to the fact that Australia has historically been a net importer of financial capital, and the high concentration of residential mortgages on banks’ loan books. To that end, the FSI suggested that Australia’s banks’ capital positions should be in the top quartile globally. APRA hasn’t committed to this hard edged quantitative aspiration or target and it is at their discretion which capital ratios they focus on.
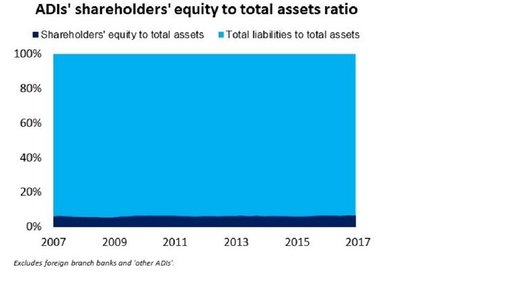
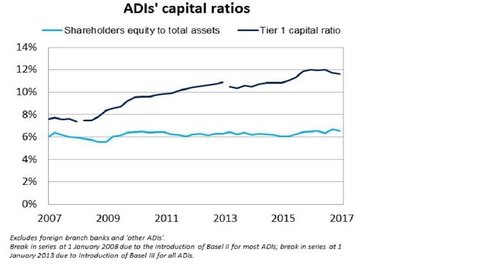
In mid-2016, APRA lifted the risk weights used by banks with internal risk based models (ie. larger banks) by 50%, from 17% to 25%. In yesterday’s speech however, Mr Byres took a more glass half empty approach by drawing attention to the fact that Australia’s banks had indeed lifted their risk weighted capital ratios since the financial crisis, but their leverage ratios had remained little changed during this time. The leverage ratio, the ratio of total assets funded by shareholders’ equity, has increased marginally to around 6.5% from 6% in 2007 (see chart).
The Tier 1 capital ratio – which represents the ratio of shareholders’ equity to total risk weighted assets – has increased to 12% from 8% over the past decade (see chart). Risk weighted assets assign lower risk weights to loans that are considered less risky (eg. residential mortgages) and higher risk weights to more risky loans such as commercial lending. The key implication is that a bank must therefore must use more shareholders’ equity to fund a commercial loan than a residential mortgage.
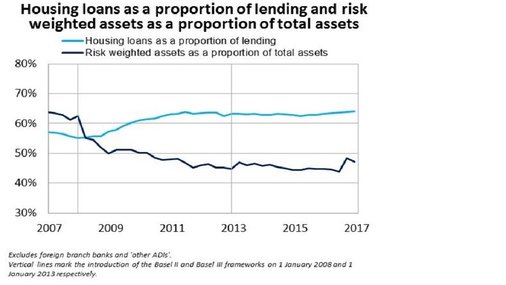
Because housing loans attract low risk weights, growth in risk weighted assets has been slower than growth in total assets as banks have lifted the share of residential mortgages in their loan books (see chart). A cynical interpretation is that the banks have gamed the risk weights; a more generous interpretation is that a lift in mortgage lending has helped to offset the persistently weak demand for corporate lending since the crisis.
Against this backdrop, Mr Byers announced that it would release an issues paper later this year, outlining a road-map on how it intends to further strengthen banks’ loss absorbing capital ratios, and hinted at the prospect of a further lift in the risk weight for residential mortgages used by the larger banks.
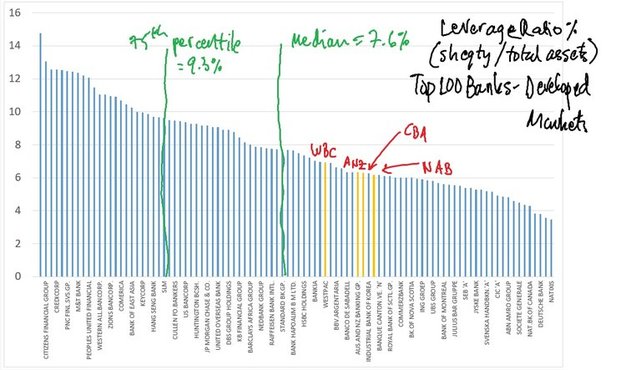
The key development in Evidente’s view is the focus on the leverage ratio. APRA has left itself plenty of flexibility at this stage, and I am not suggesting that that APRA intends to target a desired leverage ratio. But as a guide only, we undertake a global comparison of leverage ratios and a sensitivity analysis. At present, the leverage ratios for the Australian majors range from 6% to 6.5%, which puts them below the median of the largest 100 developed market banks by over 100 basis points (see chart).
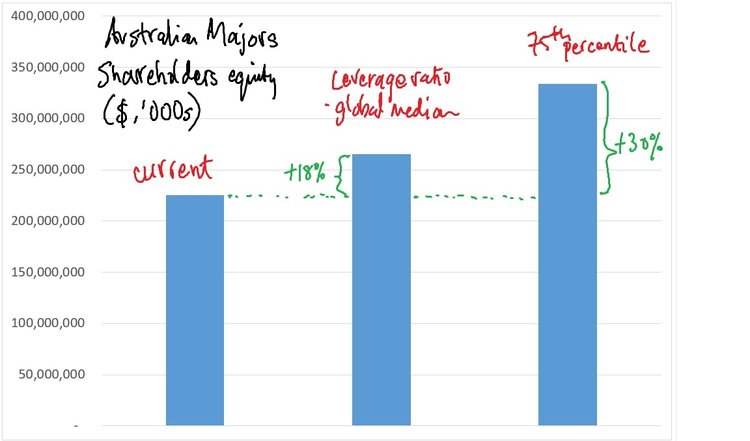
Assuming that the sector’s assets remain unchanged from current levels, the majors would need to top up their shareholders equity base by 18% or $40 billion to reach the global median of 7.6%. To get to the top quartile would require an additional $70 billion or a 30% more equity. These are large numbers and I suspect for this reason, APRA won’t be imposing a hard edged target on the leverage ratio.
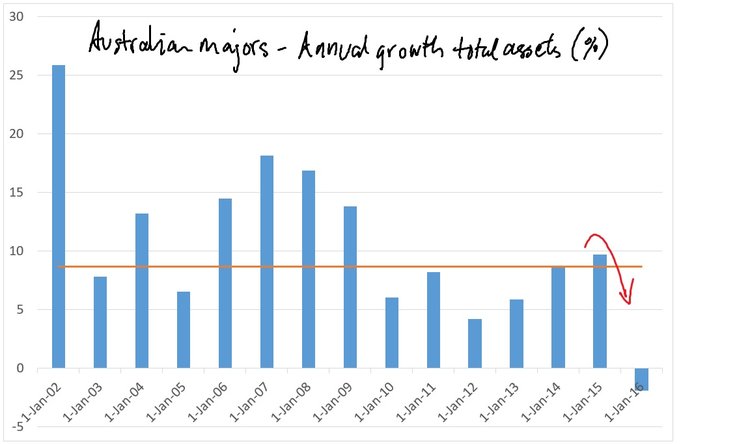
Finally, it is not just possible but likely that the path to stronger capital positions will involve some contraction of assets. This has already been evolving, with annual asset growth in the sector turning negative for the first time in over two decades recently (see chart). ANZ and NAB have been seeking to ‘shrink to greatness’ by shedding low return international businesses, and Evidente expects this process to continue with ANZ and CBA looking to sell their wealth management businesses.
Evidente is an independent financial consulting firm managed by Sam Ferraro that delivers innovative financial advice to wholesale investors, including active long only funds, hedge funds, pension funds, and sovereign wealth funds, in Australia and globally. Drawing on academic research in asset pricing, behavioural finance and portfolio construction, Evidente provides wholesale investors with commercial solutions to stock selection and asset allocation decisions across equities and other asset classes.
Sam writes as a freelance journalist for The Age, Sydney Morning Herald and Australian Financial Review, was a member of the advisory board of API Capital, teaches business finance and international finance courses to undergraduates at RMIT, and most importantly Sam is a well respected source of information and friend of TAMIM.
We take a look at accessing IPO’s and Capital raisings. Small investors tend to be locked out of these raisings. In most instances, this is not an issue as the quality of the capital raisings tend to be poor. However, in the case of a strong IPO, you can benefit from a relationship with an investment manager who provides access to these IPO’s and Capital raisings.
Summary:
Gaining access to the best IPOs and Capital Raisings appears to remain the preserve of institutional and high net worth individuals at present. Whilst this plays to our advantage at TAMIM Asset Management we would like to see the market playing field level over time to allow fairer access to retail investors. However, in the meantime we continue to take advantage of opportunities to access the highest quality IPOs and Capital Raisings within the ASX smaller companies universe. In this article we discuss the ins and outs of gaining access to stock.
Not all IPOs and Capital Raisings are created equal…
IPOs and Capital Raisings are a sensitive subject for many retail investors who often view them as “closed doors” for smaller investors. And of course the more a door appears closed, the more it is natural for human psychology to want it to be opened.
However, we believe this way of thinking warrants caution since not all IPOs and Capital Raisings are created equal. In our opinion the vast majority should be avoided due to their lack of track record and evidence of sustainable moats, and their often unproven business models. We have previously written about our high quality shopping list, and we find the majority of IPO and Capital Raising opportunities fail to meet our criteria of a high quality investment.
We recently saw a cautionary tale when it comes to IPOs, as covered on The Lazy Dog blog.
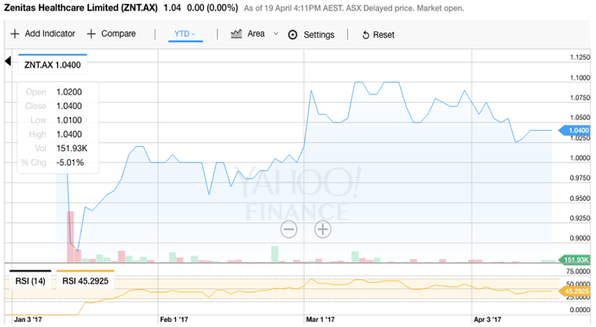
STOCK EXAMPLE: Zenitas (ASX:ZNT) is a good example of a recent Capital Raising which ticks all our high quality boxes. ZNT now operates from 54 locations throughout Australia, employing 700+ health professionals, providing services across allied health, home care and primary care; making it a significant player in the community healthcare in the Australian market. Community healthcare is expected to benefit from supportive government policy, as community-based health services represent a cost effective solution compared to high cost hospital care. We like ZNT as it is in a sector supported by strong tailwinds and encouraging thematics, it is priced on an undemanding multiple, has multiple and credible pathways to grow, and is run by an experienced management team. That said, the business still has work to do prove itself to the market, and to build out its model. As it does, there is ample room for the share price to re-rate.
Once you have identified the right ones – how to gain access?
We have generally found that competition is intense for stock if an IPO or Capital Raising does indeed tick all our high quality boxes. In small Capital Raisings that are in high demand, it is often the case that the stock available is bid for multiple times over by institutional and sophisticated investors, before retail investors are even offered an opportunity. As a result, it can be very challenging for retail investors to pick up stock in these cases. Conversely, it is often easier for retail investors to pick up stock in the lower quality IPOs we are aiming to avoid.
At this point it is worth mentioning that the IPO market largely remains under the control of the larger brokers who still generate very high fees for handling IPOs. So the main route to IPO or Capital Raising stock supply is through the broking community.
For smaller investors this means leveraging existing broker relationships, and showing yourself as a potential longer term client for that broker rather than an “IPO flipper”. If an IPO is in hot demand brokers will be very focused on the clients they believe will help build their business longer term rather than short term focused traders.
This is one of the areas where it is a major advantage to be invested through a long term focused smaller companies investment manager since these funds tend to move to the front of the queue for the reasons mentioned.
STOCK EXAMPLE: In the above mentioned example of Zenitas (ASX:ZNT), there was no public float or ability for retail investors to participate. And even sophisticated investors had their bids substantially scaled. However, we were able to use our existing relationship with the company through our long term shareholding in BGD Corporation to secure a strong allocation.
What is being done about it by the ASX?
The short answer is the ASX are doing nothing about this. They recently released a consultation paper on listing rules reform, which made it clear they don’t intend to address the fair participation in IPO issue at all. This effectively means the IPO (and Capital Raising) markets will remain the preserve of bankers, brokers and high net wealth individuals, at least in the short term.
Alternative strategy to gain access to IPOs: Onmarket Bookbuilds
It is positive to see the emergence of onmarket bookbuilds, a relatively new business model which aims to provide IPO access to retail investors. At present, this type of business is generally the secondary IPO broker behind a traditional primary broker so is generally only contributing a relatively small portion of the IPO fund raisings it in involved in. However, the key point is that this business is providing IPO access to retail investors who were previously locked out of the market, which is a clear step in the right direction.
We hope these bookbuilding models succeed in building their business longer term as their success will lead to greater access to the higher quality IPOs which remain largely inaccessible for retail investors at present. And hopefully other alternative access points for retail investors will emerge in the coming years.
Conclusion:
We rarely participate in IPOs and generally only participate in the highest quality Capital Raising opportunities. However, fair access to stock is a debate which will rage on. We believe a move towards fairer access to stock for retail investors is likely longer term despite the ASX’s recent lack of reform action.