This week the TAMIM Australian Equity Small Cap team review some of the more interesting take aways from the November AGM season as it relates to their portfolio.
Konekt Limited (KKT.ASX)
Market cap: $52m AGM date: 16 November 2017
Workplace services provider Konekt (KKT) held its AGM during November. At the AGM, KKT confirmed forecast revenue growth of more than 70% and underlying EBITDA growth (excluding one-off items) of greater than 70%.
A key focus of the AGM was therefore on updating the market on its recent Mission Providence acquisition – pleasingly, KKT noted that there have been no surprises following completion and that the business was tracking to expectations. The acquisition diversifies KKT’s existing revenue streams, and enhances its ability to provide return-to-work (RTW) employment services, to complement its existing core offering of delivering RTW injury management programs (essentially managing the process of rehabilitating injured workers and getting them back into jobs – and where it is the current national market leader).
KKT noted the acquisition also provides KKT the capacity to enter new or underserviced markets. The logical potential new market here is providing RTW disability employment services – an attractive opportunity with the Federal Government’s 2017 budget highlighting an additional investment of over $3 billion in disability employment services to help people with disabilities get and keep long-term jobs.
A private equity fund has recently bought a majority shareholding in one of KKT’s key competitors – APM, the largest provider of disability employment services to the Federal Government (see here). Apart from this transaction, there has been growing private equity interest in the sector – possibly driven by the potential to capture some of the increasing amount of government funding committed to the disability sector.
KKT continues to trade on a PE multiple of less than 10x, with EPS growth (excluding amortization, abnormals and potential cost synergies) of 15% – 20% forecast over the next two years – a powerful combination of value and growth.
There would also appear to be little upside priced into KKT’s current share price to reflect the further growth available to KKT from the larger scale opportunities it is looking to capture, as the business transitions from its injury management focus to a larger, diverse, more integrated employment services company, operating in multi-billion dollar markets.
Joyce Corporation Limited (JYC.ASX)
Market cap: $48m AGM date: 30 November 2017
Diversified investment company Joyce Corporation reported a strong trading update at its AGM in respect of each of its businesses lines:
Lloyds online auctions – revenue growth for Q1 of FY18 of 61%
KWB Kitchens – revenue growth for Q1 of FY18 of 13%
Bedshed network – revenue growth for Q1 of FY18 of 5%
Investment properties – both now generating external rent with revaluation gains expected.
JYC continues to invest in the intellectual property and development of each business unit to ensure long term sustainable growth. JYC reiterated that on the whole, its businesses are resilient to economic cycles and are unlikely to face any significant threat from Amazon.
To summarise our investment case here, JYC has interests in:
The fastest growing, and one of the largest, online auction sites in Australia (FY17 revenue growth of 56%, and YTD growth of 61%);
The largest specialist kitchen renovation business in Australia;
A large bedding and furniture franchise business; and
Approximately $20m of recently refurbished real estate.
We view the sum of each of these equity interests to be significantly higher than JYC’s current $48m market cap.
Blackwall Limited (BWF.ASX)
Market cap: $52m AGM date: 17 November 2017
Blackwall Limited (BWF) – fund manager, property manager and manager/developer of the Wotso shared workspace business, held its AGM during November. BWF highlighted that by locating its Wotso workspaces in city fringe and suburban sites, it is able to achieve industry leading margins of 25% to 30%. This is because it incurs significantly lower rental expenses but is still able to charge similar rates for its spaces as city-based co-working spaces.
Wotso is a very fast growing business – during FY17, Wotso grew its revenue by 84% and operating profit by 93%. It manages the largest number of coworking sites in Australia, together with a Singaporean business, and is currently looking at New Zealand opportunities.
At the end of November, BWF confirmed that following the uplift in value of a fund that it manages, it had generated performance fees of approximately $11m. This fee will be converted into units in the fund – providing BWF with an ongoing income stream and the potential to benefit from further capital gains in the fund. This is an $11m asset that BWF did not have this time last year – and is quite material in the context of a $52m market cap company.
In addition to this ‘new’ asset, BWF has a number of other ‘surplus’ investment assets on its balance sheet – we estimate BWF’s net assets to be worth approximately $35m in total.
Deducting the value of these net assets from BWF’s market cap of $52m implies that BWF’s three operating businesses (the fast growing Wotso business, and BWF’s fund and property management businesses) are being valued at just $17m. The fund management business has generated performance fees of $14m in the last 6 months alone! To provide an indication of sector values for larger co-working companies, we note that WeWork, the world’s largest co-working company and Wotso’s largest Australian competitor, is currently valued at an incredible 20x its forecast
annual sales. (Wotso’s annual sales are currently tracking at approximately
$8m).
Paragon Care Limited (PGC.ASX)
Market cap: $138m AGM date: 22 November 2017
Healthcare equipment and consumables supplier, Paragon provided revenue and EBITDA guidance at its AGM which was in-line with market expectations and translates to ~10% organic EPS growth for the year (pre any acquisitions).
A number of growth drivers for PGC were articulated in the AGM
presentation:
– A growing demand for the provision of preventative equipment service and maintenance throughout the medical, scientific and allied health industries, with these recurring service revenues now expected to contribute ~10% of PGC’s FY18 revenues;
– Extending PGC’s geographic footprint – i.e. the rolling out of a new South Australian warehouse and logistics site in January 2018. Queensland and New Zealand are areas that remain underserviced
by PGC;
– PGC continues to benefit from increasing demand in the aged care sector with these revenues increasing 20% to $14m for FY17
– PGC’s e-health offering Midas, a web reporting software platform, is making strong progress towards contributing profit; and
– Strong pipeline of value accretive M&A to add to PGC’s product range, service and maintenance offering and geographical footprint are being reviewed.
Despite these positive developments the PGC share price continues to be weak. We believe the weakness can be explained by the following:
An upcoming CEO transition – short term in nature;
The market expecting a capital raise at some point to fund a potential large acquisition – again short term in nature if it happens;
Seasonality of the business becoming more pronounced as hospitals buying increasingly trends to the third and fourth quarters of the financial year (structural – but can be mitigated through increased service and maintenance and consumable revenues).
Whilst the current share price is disappointing, we expect the PGC share price to be materially higher this time next year. PGC have stated some aggressive financial targets (revenue of $250m and EBITDA of $37.5m) – and have an excellent track record in achieving its targets.
Robert Swift takes a look at the electric vehicle phenomenon and takes a look at how his TAMIM individually managed account strategy is looking to take advantage of this increasingly potent thematic.
Our one source of energy
The ultimate discovery
Electric blue for me
Never more to be free
Electricity
Nuclear and HEP
Carbon fuels from the sea
Wasted electricityOur one source of energy
Electricity
All we need to live today
A gift for man to throw away
The chance to change has nearly gone
The alternative is only one
The final source of energy
Solar electricity
Electricity, Orchestral Manoeuvres in the Dark, 1979
Aside from showing that our musical tastes are firmly mired in the late 1970s, this is an article on the apparent inexorable rise of electric powered vehicles, and the concomitant decreasing importance of humans in driving them. We seem to be in the midst of a number of significant technological changes including the prospect of a mass, government mandated, move towards Electric Vehicles (EVs).
Initially spurred on by environmental concerns, battery technology is likely to advance so rapidly that it will prove cost advantageous to switch to EVs as vehicle prices, running and maintenance costs come down, and recharging facilities become ubiquitous. For example, battery prices were around US$1300 KWh in 2007 falling to US$500 KWh in 2012, US$145 KWh in 2016 and General Motors estimates US$100 KWh in 2021.
At the moment, under 0.5% of all global vehicles are fully electric. Several governments, such as France and UK, have already mandated a date for the outlawing of combustion engine sales! Additionally, the UK has seen a price put on diesel emissions by a charge now levied on diesel vehicles, in addition to the congestion charge already levied, to enter capital cities. This has had an immediate impact on the resale value of diesel cars and the incentives are clearly being put in place to introduce fully or partially electric cars.
However, are electric cars feasible currently; are they truly less polluting, and how can we make money as investors, from this trend?
We don’t think EVs are currently feasible for a number of reasons, BUT will be when some other necessary changes take place – many of which are already underway such as ride sharing in cities.
Here are the obstacles which need to be overcome for EVs to be feasible and for a mass uptake possible:
1) Range.
EVs currently look good, especially the sports varieties, but do not have sufficient driving range to be viable, especially when there is the problem of…
2) Inadequate recharging infrastructure.
The USA has over 125000 gas filling stations and currently fewer than 15000 electric recharging stations. Not only that but the home voltage of 110V in the USA is inadequate to charge a battery in an acceptable time frame. Even at 220V, the standard elsewhere, the car battery would take over 8 hours to recharge. Check out the Nissan charge website here for details.
What about people who live in apartments or houses with no driveway? Are we to see wires hanging out of windows in streets tightly packed with terraced houses? It’s unlikely. In short, a lot of infrastructure spending is needed.
In countries where there has been some uptake of EVs like USA and China, auto manufacturers like Tesla and VW have built parking bays for re-charging so it’s possible. Local authorities in conjunction with electricity companies, have plans to provide further facilities in streets. Oil companies with existing fuel stations will also gradually convert these to electric charging as take up increases.
It is also likely that car dealerships will become marque aligned charge points. These businesses are already under pressure since there is really no reason for their existence. They are tied to the manufacturers for historical reasons, but the success of the direct selling model, piloted by Tesla, has illustrated their obsolescence. Qualcomm, the USA based technology company, is even discussing how charging can take place wirelessly from the road surface – effectively producing a limitless range vehicle – as you charge on the move.
The infrastructure will be built but capital expenditure requirements will be high, and experience has taught us that to invest during a period of high capital investment is not optimal – better to wait until we see who is winning and then enjoy the momentum.
3) Initial outlay cost for EVs is too high.
Savings from lower fuel costs will take most of the expected holding period of the car to materialise. Additionally, the EV technology is likely to get better and thus the resale value of even a three year old EV is likely to plummet at an ever faster rate. In short, a strictly logical buyer would still opt for a combustion engine or hybrid car over a fully electric powered vehicle.
4) Current technology.
The combustion engine will continue to improve both in terms of mileage and emissions. It is also not readily apparent that EVs are LESS polluting than the combustion engine, simply because the source of the electricity may be producing high carbon emissions? Additionally, the EV batteries tend to contain a lot of heavy metals which are hard to dispose and are polluting to mine. Put another way, when the fight is really on, the traditional technology has many more aces to play and the benefits of the switch may become LESS obvious not more.
Our conclusions?
1) EVs will become synonymous with driverless cars.
There will more incentives offered, and penalties imposed, from governments to aid the adoption of EVs and driverless vehicles. Higher gasoline or diesel taxes and additional taxes on low MPG cars and ‘congestion charges” are always good revenue raisers, and are consequently probable!This is very likely to result in the greater use of Electric Vehicles for short distances where the range limitations are irrelevant and probably as a ride sharing format. City commutes less than 15km by single passenger occupancy combustion engine cars may become a thing of the past.
Intel’s purchase of Mobileye looks increasingly clever since cars will become more intelligent if they are to be both driverless and use an infrastructure which is not yet fully ready.
2) For car makers, bigger will be better since some of the bigger car companies have deep pockets, but all the smaller ones don’t.
Existing auto manufacturers face both an opportunity and a threat from the transition to EV; they also have to grapple with other new technologies too – driving automation and artificial intelligence. This is already leading to vast investment expenditure by all the major players. Some will invest well and be winners, while others lose out. At this stage it is just too early to call but they will all share a need to deploy a lot of capital on new technologies.
Bigger may be better because they have deeper pockets. Our fund currently holds Daimler – the owner of Mercedes Cars and Trucks. They are rarely first to market with anything, but, they do have the size and financial resources to make the necessary investment scale. They have already developed an electric truck, and this is being trialed with various customers. EVs will become viable in short haul ride sharing format but longer distance driving and heavy payload will remain combustion engine dependent (at least in the short term).
Right now, it is just too early to know who the definite winners and losers will be from the auto manufacturers, but the picture will start to get clearer as time evolves. Newcomers like Tesla may be early, but they may not ultimately be successful – they may have made the initial technological leap – but ultimately vehicles need to be made to a consistent and reliable standard, and profitably. This can only happen with high volume capacity. This challenge may yet defeat Tesla.
3) Invest in the auto component suppliers since the capex burden will necessitate devolving more production and R&D to autoparts companies.
A way for the car makers to free up necessary cash flow is to outsource more of their existing work in the manufacture of parts, and their R&D functions. We like Lear Corp, Borg Warner, and Magna. Battery companies too will continue to be theme stocks. Battery technology is improving rapidly right now having been fairly static for decades, so we can’t be sure precisely what will finally win out. At present the focus is on lithium, cobalt and magnesium.
Toyota and Panasonic are cooperating on battery technology to provide a ‘Japan Inc’ solution and VW has committed over US$10bn with JAC Motors which is based in Anhui Province, China and listed on the Shanghai Exchange.
Mining companies with significant exposure to these materials may continue to do well – Albermarle, FMC Corp, SQM (NYSE), Tianqi Lithium Corp (China) have all been names in the headlines.
4) Invest in the shovel makers not the prospectors?
We’ve all heard the old saying from the California gold rush in 1849 – the ones who were sure to make money were the shovel suppliers – few actual prospectors got rich; many died.
This may not be a bad approach in this new gold rush? So, what are the “shovels” in the electric and/or autonomous vehicle market? Well electricity for one!
Of course, it will be some time before consumption by electric vehicles becomes meaningful for electricity utilities and the distributors, but it will eventually lead to significant growth for them from about 2025 and beyond. Many countries simply don’t have the capacity right now to meet this demand, so this will require more electricity infrastructure. This will have to be renewable energy such as nuclear, wind, solar or bio fuels. This will create demand for the likes of Siemens, Vestas, and solar panel manufacturers,
Another reason to like electric utility and transmission companies? The surge in crypto currency interest and its mining is incredibly power hungry. Power demand from Bitcoin mining operations has surged along with the Bitcoin price, and miners now consume as much power as Denmark! Bitcoin mining will consume 1.5-3% of global power.
These utility companies have suffered from poor performance in the growth driven stock market of the last few years and are now priced for zero revenue growth and profit declines. With growing power consumption per capita as living standards rise, and growing populations, this looks unlikely.
The following companies are ones we think interesting:
China Resources Power
ENEL in Italy
First Energy Corp in the USA
RWE in Germany (majority owner of listed Innogy, the renewable energy company)
We have been right in having zero exposure to utilities but as interest rate increases become increasingly discounted, and as electricity consumption continues to rise, the attractions of owning the shovel makers in this new gold rush are becoming increasingly tempting. We follow about 2,000 global companies of which about 120 are classified as utilities. Of these 120, over one quarter are in the top 10% rank by valuation. Put another way – many of these stocks are very, and disproportionately, cheap.
Invest in electric utilities and you can tell your friends that you are also investing in the future of electric vehicles.
This week Guy Carson takes a look at the Australian GDP figure and digs in to how it impacts the everyday share portfolio.
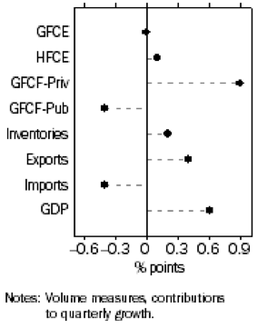
Last week the Australian Bureau of Statistics (ABS) released the GDP data for the September quarter. The headline result saw an economy that grew at 0.6% for the quarter and 2.8% for the last 12 months, both slightly below expectations. The annual rate increased from 1.9% year on year rate achieved in June as the negative September 2016 quarter dropped out. Beneath the hood, there were some interesting trends within the data with strong fixed investment (infrastructure) offsetting weakness in household consumption.
The chart below from the ABS splits out the different components of GDP for the latest quarter. As you can see the standout from the last quarter was GFCF – Private (Gross Fixed Capital Formation – Private) which represents private investment. This added 0.9% to the final number despite residential investment falling with infrastructure taking up the slack.
Source: ABS
On the other side is the Australia consumer. Household Final Consumption Expenditure (HFCE) added just 0.1% which was the weakest result since 2008. This shouldn’t come as a major surprise and is something we have talked about for some time (see here).
The trend of increased infrastructure investment, lower residential investment and subdued household spending are in our opinion likely to continue (again we wrote about this here). In order to see the economy transition away from the mining boom, the Reserve Bank of Australia cut interest rates to spur economic transition. With the worst of the mining decline now behind us, the RBA is reluctant for the interest rate cuts to continue (and at 1.5% there is a little scope for further cuts anyway). The interest rate cuts spurred a residential boom through both prices and (more importantly for the economy) construction.
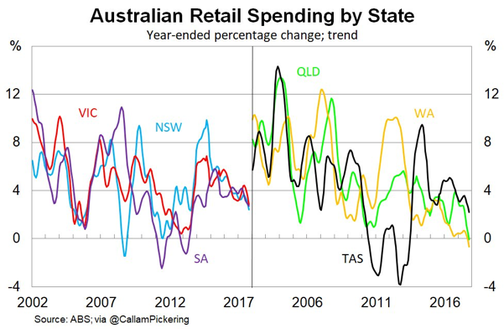
Further interest rates cuts are most likely off the table now and that means no further boosts for the household. It also means house price growth will slow (and potentially reverse). With no sugar hits left for households, consumption is set to be weak and has been slowing for some time. We can see this trend in the chart below looks at retail sales growth by state. The decline has been led by the mining states with Western Australian and Queensland in negative territory whilst the other states are trending downwards as well after a strong bounce in 2012 as the interest rate cuts started.
Retail sales were particularly weak with two key drivers. On July 1, households were hit with two price increases. Firstly, the large amount of household debt got hit with APRA induced interest rate increases. These rate rises were for interest only and investor mortgages. This did see a significant amount of switching from Interest only to Principal and Interest but the overall impact remains capacity taken out of the household budget. Secondly, electricity prices went up 17% across the board. The combined impact is that heavily indebted households have less to spend. Whilst the media has focused on the entrance of Amazon to Australia, it is our opinion that the weakness in household balance sheets has been the major source of weakness for retail companies to date.
We do have to note thought that both of the price rises mentioned above are one off in nature. We do see households as the major risk to the Australian economy; however a stabilisation rather than a capitulation is the most likely scenario in the near term without further external cost increases.
The major question for households therefore becomes how much impact does the wealth effect have? The wealth effect is the theory that when household wealth rises, people will feel richer and spend more. On the flipside, when prices soften, spending will suffer. With a majority of household wealth held in property and prices potentially starting to soften, there is the potential that household confidence will weaken and spending will follow.
For us, the retail and residential sectors (as well as 2nd order derivatives) remain difficult to invest in. There may be specific opportunities but “Green Shoots” remain a distant thought.
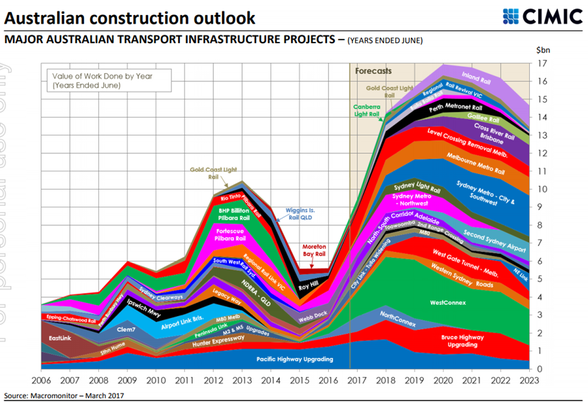
On the flip side, infrastructure investment continues to be the most likely driver of economic growth going forward. The chart below shows the range of projects and the spike in activity set to come. The projects are focused on road work and along the East Coast.
Source: Cimic
Over the course of this year we have added positions across companies focused across the likes of Bridge building, surveying and scaffolding. These companies tend to be leading players in niche industries and as a result are typically ignored by larger institutions. We have been able to acquire these positions at what we believe to be attractive valuations and all cases believe the prospect for earnings growth over the coming years.
Timing the cycle is always difficult so whilst we do have an exposure to infrastructure, our major sector exposures continue to be Information Technology and Healthcare. These are two sectors that have structural tailwinds and contain quality niche companies that we believe will continue perform strongly regardless of the economic cycle.
This week the Small Cap team present a brief investment thesis for Konekt (KKT.ASX), one of their favourite holdings.
Summary:
In our search for under-valued high quality ASX listed smaller companies we occasionally come across an opportunity which truly stands out from the crowd. In this article we discuss a company which is currently trading at less than 10 times FY18 earnings despite expected earnings growth of 15-20% p.a. over the next 3 years driven by solid tailwinds in a defensive industry. And to top it off, the company is led by one of the best management teams we’ve had the privilege to get to know – and we’ve met a lot of management teams over the years.
An emerging business model in a sizeable market:
Konekt is a workplace health solutions provider – the company helps companies and healthcare insurers prevent injury and help rehabilitate sick/injured employees so they can ultimately return to work. The company employs more than 800 staff operating nationally from over 125 locations helping people return to the workforce – currently injured and unemployed, but potentially also disabled people looking to enter the workforce. This pool of labour looking to return to the workforce is the supply side of the emerging Konekt model.
As at August 2017 there were over c.200,000 jobs vacant in Australia – the majority in blue collar occupations, with some national firms having in excess of 1,000 jobs vacant at any point in time. This is the demand side of the emerging Konekt business model, as it transitions from its traditional injury management business model. Konekt has strong existing relationships with many of these significant corporate and government employers through its injury management and pre-employment services. Konekt has a significant opportunity to match the labour supply it has access to with the large pool of labour demand/vacancies mentioned. The company is in the relatively unique position of having the resources and scale to place large numbers of employees into vacancies at significant national corporate and government employers. Konekt also has the added advantage of being able to offer a range of other pre-employment screening/assessments and injury and mental health management services to these employers.
The benefits to society of having unemployed, disabled and injured workers return to the workforce (and off government benefits) is likely to see Konekt’s services continue to be well supported irrespective of the government of the day.
Clear revenue and earnings growth drivers:
As a well-funded, well managed & respected ASX-listed service provider, Konekt has a 25-year track record of delivering strong outcomes for employers, employees and society more generally – Konekt’s return-to-work rates are above market at an impressive 94%. As a result, the company is well positioned to continue to take market share from sub-scale, under-resourced competitors operating in each of the three return-to-work verticals (injured, unemployed and disabled).
Konekt also has material margin expansion opportunities looking forward. The company is currently only offering one return-to-work service from each of its offices. Given rent is c.10- 12% of total costs and there is excess space in many offcies, margins and productivity could be significantly improved if Konekt can offer two return-to-work services (eg. both injury and unemployed) from the same office. And in the event that Konekt decides to enter the disability return-to-work market (and are awarded a contract) then it could offer three services from the one location, which would mean further margin upside.
Mission Providence acquisition:
On 29th September 2017, Konekt announced the completion of its acquisition of employment services company Mission Providence – a provider of employment services under the Federal Government’s $1.4bn Jobactive program. This acquisition was partly funded by a $15m capital raise, of which Konekt directors contributed c. $3m.
A key focus at the company’s recent AGM was updating the market on this acquisition. Pleasingly, Konekt management mentioned that there have been no surprises following completion and that the business is tracking to expectations. The acquisition diversifies Konekt’s existing revenue streams, and enhances its ability to provide return-to-work employment services, to complement its existing core offering of delivering return-to-work injury management programs – essentially managing the process of rehabilitating injured workers and getting them back into jobs, where it is the current national market leader.
Konekt management noted the acquisition also provides Konekt with the capacity to enter new or underserviced markets. The logical potential new market here is for the company to provide return-to-work disability employment services – an attractive opportunity with the Federal Government’s 2017 budget highlighting an additional investment of over $3 billion in disability employment services to help people with disabilities get and keep long-term jobs.
Private equity interest in the sector is building:
Interestingly, a private equity fund has recently bought a majority shareholding in one of Konekt’s key competitors – APM, the largest provider of disability employment services to the Federal Government (see here). Apart from this transaction, there has been growing private equity interest in the sector – possibly driven by the potential to capture some of the increasing amount of government funding committed to the disability sector.
Guidance:
Konekt recently confirmed forecast revenue growth of more than 70% and underlying EBITDA growth (excluding one-off items) of greater than 70% for FY18.
On an attractive valuation:
Konekt continues to trade on a PE multiple of less than 10x, with EPS growth (excluding amortisation and abnormals and potential cost synergies) of 15% – 20% p.a. forecast over the next two years – the company offers a powerful combination of value and growth. There would also appear to be very little priced into Konekt’s current valuation to reflect the significant growth opportunities available to Konekt as the business transitions from its traditional injury management focus to a larger, diverse, more integrated employment services company, operating in multi-billion dollar markets.
This is the type of smaller company we get out of bed for, and we look forward to supporting and building upon our shareholding over the long term.
This week we bring to you a piece by friend of TAMIM Sam Ferraro of independent financial education firm Evidente.
This article was originally penned on October 13, 2017.
The RBA’s biannual Financial Stability Review (FSR) has become essential reading since the financial crisis, even for stock-pickers. The central bank has used the October issue as an opportunity to vent about its concerns surrounding investor complacency in global financial markets. It has cited some of these concerns previously, but the language it is resorting to now suggests that its patience is wearing thin. Below is the list of key risks that the central bank has identified.
In the FSR from April 2017, the RBA pointed to the risk of a sharp decline in prices of risky assets associated with a sharp reversal of the ‘search for yield’ trade. That language has now been more hard edged; low volatility and interest rates are facilitating excessive risk taking via a search for yield, increasing the risk of a ‘disruptive correction.’ In particular, high asset values and low market volatility suggest that investors might be under-estimating downside risks. Any number of uncertainties – if they were to transpire – could ‘trigger a reappraisal of asset valuations and a spike in volatility.’
Previously, financial stability risks in China were elevated; debt had grown significantly over the past decade, with strong growth in lending from less regulated and opaque parts of the financial system. The RBA has now added that these developments have ‘led to ‘considerable credit, liquidity and contagion risks in the Chinese financial system.’ Moreover, the ‘authorities face a challenging transition away from growth strategies associated with rising debt.’
Previously, conditions in commercial property markets were described as strong in Melbourne and Sydney, and weak in Brisbane and Perth. Now, the RBA has expressed ‘some concerns about non-residential commercial property markets’, with prices continuing to outstrip in Sydney and activity subdued in some other cities.
One of the key lessons taken by central banks from the financial crisis has been to become more pro-active around managing financial stability and calling out what they see as unsustainably high asset valuations. In the lean versus clean debate around the delicate task of managing asset price bubbles, the RBA has drawn its line in the sand, preferring to lean against what it considers to be speculative excesses. For asset allocators and stock pickers, the challenge remains market timing. It remains to be seen if the RBA’s warnings are as premature as were Alan Greenspan’s concerns about ‘irrational exuberance’, expressed in December 1996.
Evidente is an independent financial consulting firm managed by Sam Ferraro that delivers innovative financial advice to wholesale investors, including active long only funds, hedge funds, pension funds, and sovereign wealth funds, in Australia and globally. Drawing on academic research in asset pricing, behavioural finance and portfolio construction, Evidente provides wholesale investors with commercial solutions to stock selection and asset allocation decisions across equities and other asset classes.
Sam writes as a freelance journalist for The Age, Sydney Morning Herald and Australian Financial Review, was a member of the advisory board of API Capital, teaches business finance and international finance courses to undergraduates at RMIT, and most importantly Sam is a well respected source of information and friend of TAMIM.