Recent weeks have highlighted the rather uncomfortable and somewhat frosty relationship between our nation and our largest trading partner. Hence we thought it might be pertinent to revisit the topic, something we first elaborated upon in the infancy of the Trump administration and his “trade war.” Much has changed and the situation continues to evolve.
Author: Sid Ruttala
In particular, I wish to give my two cents on where I see this situation heading and more importantly what it could mean from an investment perspective, especially given our reliance on China as an export market and what is probably going to be the largest consumer market in the world by this time next year. In particular I want to answer the all important question of where to next?
Some Context
Let me begin with some key facts that some of you may not be aware of. China’s growth this year, even in a world of Covid lockdowns, stood at 2% with consensus estimates for 2021 at 8%, the more optimistic standing at 9%. What does this mean and why does this matter? For one thing, if the Chinese economy were to keep its current momentum and trajectory, then it would be the exact size in 2021 that consensus estimates pegged it to be now back in 2019. To put it more succinctly in the words of The Economist, “it amounts to saying that China’s economic output will be as voluminous as it would have been had the coronavirus pandemic never happened.”
The nation with patient 0 handled itself efficiently but also came out, one could argue, stronger. The pecking order post-Covid has changed. Take India as an example, which saw its GDP contract by close to 10% in 2020. Or the US with its rampant and ever increasing Covid case count, dysfunctional political discourse and resurgent tribalism. The EU, with similar issues and a resurgent case count, is not much better. Vaccine notwithstanding, the global crisis has exposed many of the flaws within the Western world’s political framework and discourse, leaving many economies with some scarring that will take time to recover from, including consumer and business confidence. Contrast this with the resurgent consumer demand and credit growth in China where recent McKinsey surveys showed that 66% of the population believed that their finances will not be impacted for more than three months or not at all. This is especially relevant if one considers that despite its nominally “Communist” framework, whatever that term means for the CCP as it currently stands, there is no welfare or government support.
The Trade War and the lip service that followed suit not only enabled China to catalyse its own economic policy but also enabled them to put into action an evermore expansionary outlook (or try to). Even before the change in US administration, the policy makers in Beijing were putting into action a policy to transition away from reliance on export markets, including the US, through the curtailing of credit growth and corporate leverage, beefing up of local markets and increased self-reliance. The One Belt One Road (OBOR) is a way to not only secure China’s own supply chain but to also create the next burst of growth as the economy moved into the middle-income category where labor arbitrage (i.e. cheap labour) could not be relied upon further (though this was temporarily paused in 2020 as a result of Covid).
Source: Caixin
What has been evident is that policy makers are increasingly focusing upon and realising the fact that future GDP growth will come from developing an internal market with I (investment) and C (consumption) playing a greater part in the economy than has been the focus to this point. For some further context, I would suggest reading and reviewing the proposals put forth for the 14th Five-Year Plan (2021-2025) currently under review in the fifth plenary session. The focus is on “dual-circulation” and the drastic boosting of consumer markets while mitigating foreign risks.
In some ways, this is a page out of the US’ playbook whereby access to its own consumer and financial market allowed it to obtain the influence to not only export its systems but also its ideas/ideology through much of the post-WW2 era. Think back to Japan’s resurgence post-WW2 and the reliance of its own economic fortunes to that of the United States. This is perhaps one of the reasons that so much priority was placed upon the re-integration of Hong Kong into the broader Chinese state. It is also showcased by the fact that Net Exports, in terms of contribution to GDP, dropped from 35% in 2006 to a little over 17% in 2019 (and declining).
“When trade declines and exports drop, more and more Chinese products will be consumed and circulated internally,”
- Lin Yifu, dean and professor, Institute of New Structural Economics of Peking University. A vice chair of the expert advisory committee for the drafting of the 14th Five-Year Plan.
We will continue to see the expansion of China and its influence across much of SouthEast Asia and a carving out of a sphere of influence to include smaller nations such as Pakistan, Vietnam, Cambodia and much of Central Asia. The development of its own consumer and financial markets also offers China a primary place within the Regional Comprehensive Economic Partnership (RCEP), the largest trade deal signed in history. At the same time, it comes at precisely the time when the United States became ever more inward looking due to Trump’s isolationist “USA First” policies and pulling out of the TPP which had more merit in counterbalancing Chinese influence in the Asia Pacific than from a purely commercial point of view.
My thoughts on the process, especially when it comes to the political calculus of smaller nations including those in our backyard (i.e. Samoa, Fiji, etc), is along the lines of “better the devil you know”.
What does this mean? And why does this matter?
The Trump administration’s effort to counteract China and force a level-playing field for American businesses would have worked if it wasn’t for the unfortunate timing. The China of the 90s or even the early 2000s would’ve been the perfect target for such a confrontational approach. Unfortunately, the China of today is not what it was. It is in a position that when the deal was signed, much of the content was pretty much status-quo with increased buying of US goods that would’ve been necessary anyway (i.e. agricultural goods) given China’s own resource deficiencies.
I’ve mentioned in my previous articles that the Chinese state is not encumbered by the vagaries of election cycles or short-term approaches, their plans are multi-decade in nature and their projects (just as most autarchic regimes) are grand (think Three Gorges). The biggest incentive for the state is to avoid a repeat of the embarrassment that saw it fall from accounting for one-third of global GDP for much of human history to losing the opioid wars and the more recent WWII and Japanese occupation.
It is a state that is especially sensitive to perceived slights even if they are not intended as such. I am quite sure our Prime Minister is starting to find out.
Where to next?
The change in administration Stateside, especially given the cabinet picks that we have seen so far, suggest that the US might just come back to take its place within the multilateral framework. This is the only way in which to counterbalance Chinese hawkishness (the problem with Hawks and Nationalists unfortunately is that they exist on both sides – statecraft and economics only works when the parties are equally satisfied or dissatisfied). For the moment, it will be important to watch how the agenda is set come January. Unfortunately, the damage might have been done, so much so that any deals inked by an incoming administration may very well be dismantled or reversed by the next. Individuals can change their minds on a whim, the State cannot (or should not). In economics we call this path-dependence, it exists for a reason.
For us investors, we have a few key takeaways:
We will see China overtake the US as the largest consumer market in the world over the coming two years which has a twofold impact. The first, they have a lot more breathing space and can take a more confrontational approach since the power dynamic has now shifted. The second, it offers immense monetisation opportunities for the discerning investor (think everything from consumer discretionary to luxury goods) and I say discerning because all of a sudden the investor has to be cognizant of the political ramifications of policy. For example, if import restrictions make it harder for Penfolds and TWE, that doesn’t mean Chinese consumers stop drinking wine, they will just look for alternative brands.
We will see increased asset valuations as the corporate leverage decreases in preference for equity and the state places increased focus on developing capital markets.
Spheres of influence will be carved out which will once again offer opportunities. As I alluded to in my Mobility series, for example, the creation of artificial barriers to entry and hence economic rent-seeking by companies might not be convenient for consumers, but for the investor they can be profitable. If you want to see how this works in practise closer to home, read about the “Tattersalls heirs”.
The telco sector is currently the largest thematic exposure we have across our portfolios. It’s a sector we like because it’s defensive and has been a key beneficiary from the Covid remote working environment. Every 5-10 years we also see a period where the industry goes through large rounds of consolidation, mergers and acquisitions that can last several years.
Authors: Ron Shamgar
We have seen this begin recently. Think TPG merging with Vodafone, Uniti group acquiring Opticomm, Optus offering on amaysim’s mobile business and many other deals at the smaller end of the market.
Our top three picks in the sector are, in our opinion, undervalued and could even become one larger company one day
Uniti Group (UWL.ASX) is a fibre infrastructure play. UWL competes directly against the NBN and, following the acquisition with Opticomm (OPC), they now have 15% market share of Greenfield residential connections after the NBN.
Source: UWL company filings
Although UWL had to pay up for OPC following a bidding war against industry super fund, Aware, it does highlight the desired quality of an annuity, long life, cash generating fibre business. In addition, UWL recently received ACCC clearance for functional separation which means they can now sell internet services direct to consumers. This will allow UWL to capture more of the value chain margin and acquire more internet service providers (ISPs) in future.
We forecast UWL to deliver in excess of $100m of EBITDA in FY22 which places the stock on 11x EV/EBITDA. We also expect the stock to enter the ASX200 early next year. We value UWL at $2.00.
Aussie Broadband (ABB.ASX) is a pure play ISP provider which only listed a month ago and is already up 100% from its IPO price. Despite this, we believe it is still undervalued. ABB is the fastest growing (organic growth with no acquisitions) ISP brand in Australia with almost 90% year on year growth in residential connections, 310,000 during Q1 FY21.
ABB has taken 11% of all new NBN residential connections during Q1, a number which contrasts well to their current overall market share of 4%. This key metric is significant as it highlights that the company is taking share and is a good indicator of future growth.
Source: ABB company filings
Additionally, ABB is currently rolling out its own fibre infrastructure in the Australia’s main cities to connect directly to the NBN points of interconnections. This will allow ABB to save over $15m in costs and is all EBITDA margin by FY23. ABB can also sell add on services on this fibre to corporate customers.
We estimate that ABB will have over 500,000 residential connections by FY23 and EBITDA in excess of $55m. We value ABB at $3.00+ and believe it is a potential takeover target for UWL in the future.
Spirit Technology Solutions (ST1.ASX) is a modern IT services and telco provider, mostly to SMEs and corporate/government clients. ST1 is fast acquiring smaller telco and IT businesses and has recently entered the cyber security sector via two acquisitions. ST1’s strategy is to become a one stop shop provider to its customers. Offering not just internet/data connectivity, but managed IT services, cloud software and cyber security solutions.
Source: ST1 company filings
ST1 is currently annualising over $100m in revenues and EBITDA margins of about 15%. We believe more acquisitions will occur in 2H FY21 and, in our estimation, the company is well funded to complete one further deal. We estimate ST1 to exit FY21 on a revenue run rate of $150m+.
Part of our investment thesis in ST1 is backing its Managing Director, Sol Lukatsky, who has transformed this business over the last twelve months. We believe Lukatsky is focussed on crystallising shareholder value in the next 18-24 months through a merger or sale transaction. Once again, we see UWL as a potential acquirer as they have actually made a bid for ST1 in the past, almost two years ago. Watch this space. We value ST1 at 55 cents.
Disclaimer: TAMIM currently has positions in the three stocks outlined above.
Ron Shamgar provides an update on a number of the companies held in TAMIM’s Australian equities portfolios.
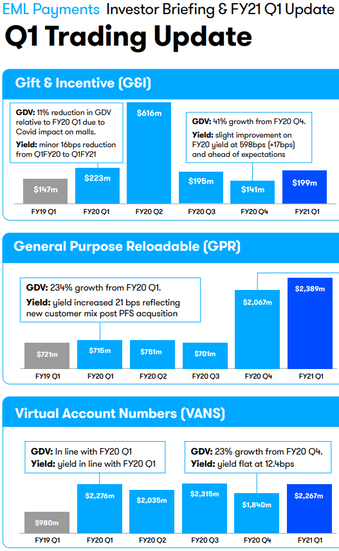
EML Payments (EML.ASX) provided a trading update for Q1 with revenues of $40m and EBITDA of $10m. EML’s transaction volumes have recovered strongly since the depths of the pandemic crash with GDV and revenue increasing +20% on Q4. The Gift & Incentive (G&I) segment was only down 11% on last year as shopping malls reopened globally. There is still uncertainty for investors as the Q4/Christmas period still is a key seasonal driver of earnings for the gift card segment with an incremental $19m of profit generated in the November/December period.
Source: EML company filings
EML is currently annualising over $60m of EBITDA based on last year’s seasonal peak, which is over 10% higher than consensus expectations. Our discussion with management in November points to steady volumes so far. There is a decent possibility that we see consensus analyst upgrades come in February next year.
Tesserent (TNT.ASX) is now officially an “8x bagger” for us since we bought in at 5 cents last year. The company continues to aggressively acquire cyber security firms in Australia but, more importantly, is winning new contracts organically which shows that the strategy is working so far. TNT provided the market with a bullish update in October, Q1 revenue was up 42% to $15m and annualised revenue run rate in excess of $100m.
Source: TNT company filings
The company is cashed up and now profitable. In addition, management has given a new annualised revenue target of $150m by June next year. Investors have responded well with the stock hitting our valuation of 40 cents during the month. We took the opportunity to continue taking profit. We expect more acquisitions and probably an expansion overseas. Based on their June forecast, we value TNT closer to 50 cents.
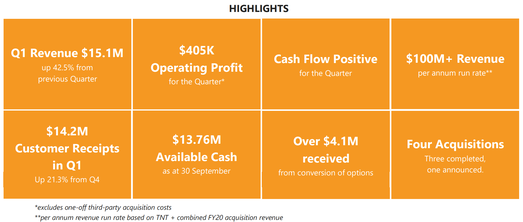
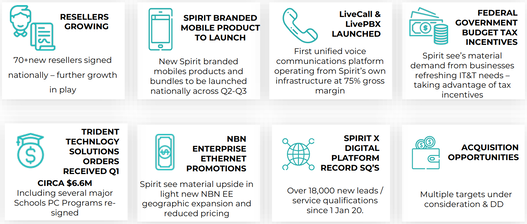
Spirit Technology (ST1.ASX) provided a Q1 update with revenue up 150% to $15.6m, 70+ new resellers signed and $30m of cash and debt for further acquisitions. We expect a deal to be announced before Christmas and we see greater focus on enhancing the company’s cyber security offering. We expect ST1 to finish FY21 with an exit run rate of $150m of revenues and EBITDA in excess of $22m.
Source: ST1 company filings
The business is operating in two segments of the market where we are seeing strong customer demand and consolidation (Telco/IT and Cyber Security). We believe management aspirations are to crystallise value for shareholders via a transformational transaction in the next couple of years. We value ST1 at over 50 cents.
AVA Risk Group (AVA.ASX) is a technology company compromising of AVA Global, providing risk management and logistics solutions, and Future Fibre Technologies, providing security solutions through electronic locks and fibre detection technologies. We took a position in AVA mid-year at 15 cents as we saw a new management team turn the business around and reduce costs while growing revenues. During October, the company provided a robust Q1 update with revenues up 73% to $17m and EBITDA up 522% to $7.7m. The company is cashed up with a net cash position of $11.5m.
Source: AVA company filings
We estimate FY21 EBITDA of $20m and a cash balance of $25m. The company has a strong pipeline of new business opportunities of which management expects to win a large share. In addition, the services division is looking to participate in ongoing industry consolidation and we believe a possible sale of the business could yield $40m+. The stock is now up 4.5x since we bought and we have taken the opportunity to take profit. The next catalysts to watch for are contract wins and corporate activity.
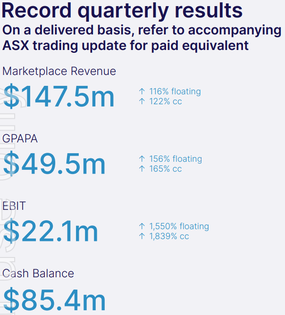
Redbubble (RBL.ASX) provided a strong trading update for Q1 that saw sales up 116% to $148m and EBIT of $22m with strong free cash flow generation of $27m. The business’ cash balance is at $90m. Historically, Q1 accounts for 22% of annual revenues so, on the current run rate, RBL is on track for EBITDA of $120m in FY21. The market is currently pricing in $70m. We track RBL’s global web ranking regularly as it’s a good measure of its growth trajectory over time.
Based on the data at hand and a seasonally strong Q2 sales period, we expect the next update to be very strong and well received by investors. RBL is currently the fastest growing and most profitable cash generating e-commerce company on the ASX, yet trades at a material discount on all metrics to its local and global peers. The recent CEO sell down of shares has dampened sentiment for the stock but we see this as a buying opportunity on a longer term basis. Our valuation is currently $7.00+.
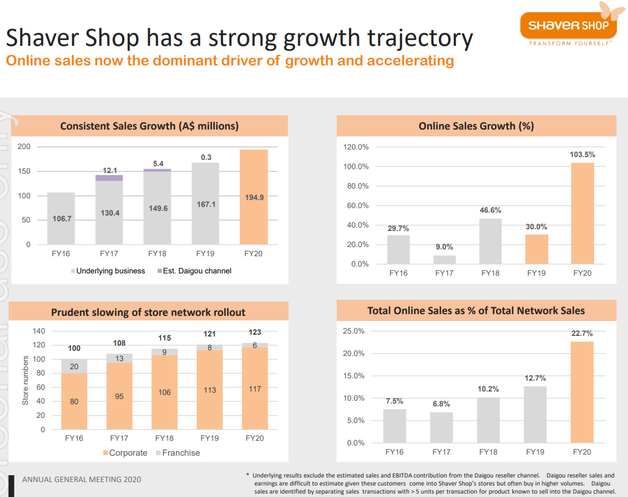
Shaver Shop (SSG.ASX) provided a stellar first quarter update with sales up 20% to $49m, online sales growing 192% (now 33% of group sales), and NPAT up 185% to $4.9m. For perspective, SSG reported $11m profit for the whole of last year! Unlike many other retailers, SSG never received JobKeeper. We see the company benefitting from the structural shift online as consumers are still discovering the Shaver Shop brand.
Source: SSG company filings
We believe the company is taking market share away from traditional brick and mortar retailers and department stores. The personal care market in Australia is worth $11bn and we believe SSG will continue to grow and take share for the next few years. The stock is trading on an estimated 9x PE and a 7% fully franked yield. We see the 2H sales momentum as key for the stock to rerate to a multiple that is more reflective of its growth rates, a quality cashed up balance sheet and relative peer valuations. We value SSG at $1.50.
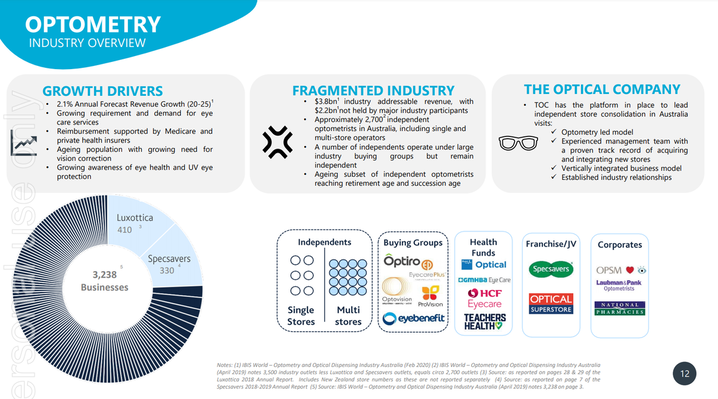
Healthia (HLA.ASX) announced a transformational deal to acquire the Optical Company for $43m. The business generated $36m and $5.7m EBITDA last year and diversifies HLA into the highly fragmented and defensive optometry sector. On a combined basis, the group is now a substantial allied health company with $180m of revenues and $30m EBITDA in FY22. Since listing, HLA management has delivered on expectations and has shown to be disciplined in its progressive acquisition of podiatry and physiotherapy clinics.
Source: HLA company filings
Pleasingly, the organic growth rate was 11% in Q1 showing that the business is not just growing via acquisition. The stock is currently trading on 5x EV/EBITDA, 8x PE for FY22 and has a 5% fully franked dividend. We believe the stock is now in the crosshairs of most fund managers based simply on scale and the market cap exceeding $100m. We expect a significant rerating of the earnings multiple in the next few months. HLA is a conviction holding and we value it at $2.25.
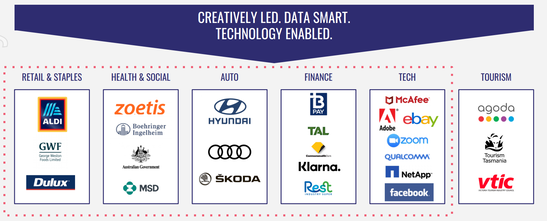
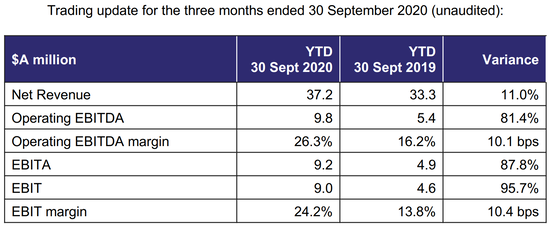
Enero Group (EGG.ASX) is a digital marketing and creative brand agency with offices in Australia, US and UK. The company is not being impacted by the reduced media and advertising spend experienced by peers as the majority of their customers are either in defensive sectors, such as fast-moving consumer goods (FMCG), and technology companies, which are prospering. The Q1 update released in October was almost jaw dropping with revenues up 11% to $37m but EBITDA up 81% to $9.8m (this number includes $1m of JobKeeper).
Source: EGG company filings
Underlying EBIT margins are now an industry best at 21%. Although revenue visibility for EGG is short, management expects Q2 to remain strong. The business is cashed up and we expect dividends and further acquisitions next year. We forecast 25 cents EPS and 15 cents of franked dividends. We took the opportunity to acquire shares as some long term stale holders have lost patience. We value EGG at about $2.50.
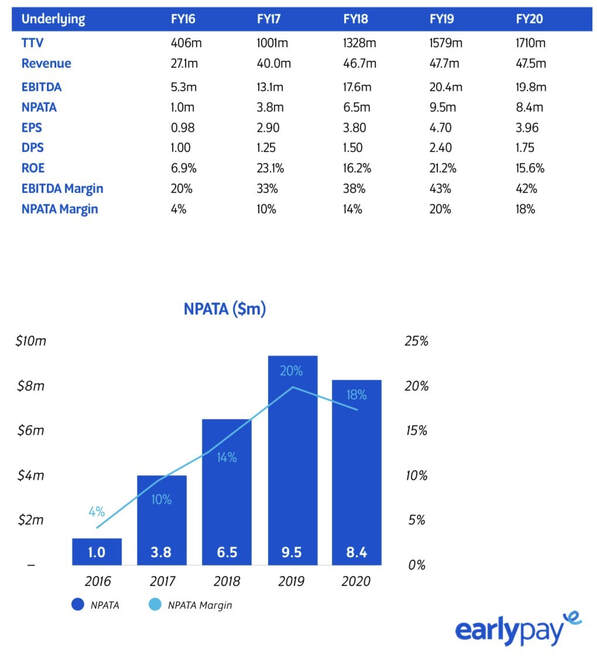
CML Group (CGR.ASX) provided a trading update and a digital rebrand to Earlypay. Management are trying to digitally transform the company from an “old world” invoice financing business to a “new world” fintech. The acquisition of Skippr has enabled the company to accelerate its onboarding capability of smaller sized clients from two weeks to 24 hours. This should see growth rates accelerate in future.
Pleasingly, the Q1 update is showing invoice volumes rebounding to FY20 annualised run rate levels of $1.7bn, although at a reduced margin due to customers repaying earlier than usual due to government stimulus assisting small businesses. The equipment finance segment is doing record lending of $3.5m per month with the loan book now at $100m. With their new fintech name and the business expected to return to growth mode in FY22, we believe CGR will slowly be rerated by the market and the takeover activity from earlier this year may resume. We value CGR at 55 cents.
Disclaimer: All stocks highlighted in this article are held in TAMIM portfolios.
This week we continue (and conclude) our series on the mobility thematic with the final two pillars in our framework, that is connectivity and shared mobility. Both of these pillars are intrinsically interrelated and are perhaps where we have seen the greatest focus from a consumer perspective. I will try to tie it up by looking at two companies that are personal favourites from an investment perspective.
Author: Sid Ruttala
When we speak of connectivity, we are primarily referring to the data-driven and enhanced experience that consumers are given. At a simplistic level, this can involve the basic requirements of tracking vehicle usage and monitoring technical status right through to the virtual chauffeur that is able to predict driver or occupant fatigue. Think for a moment of the applications not only from a transport perspective but the ability to advertise, say a coffee stop, to a passenger. Or the implications of having this enriched data for the likes of insurance companies or transport operators. In the case of insurance companies, for example, drivers could be offered incentives based upon where drivers were driving and how they do so, with secondary data around things like fatigue giving them specific and actionable risk metrics. Similarly, an insurer’s in-car risk platform might get additional revenues from advertising coffee stops to fatigued drivers or meal stops to those on long trips.
What we are seeing evolve is an ecosystem that is predicated upon not only consumers having a better travel “experience” but also increased opportunities and threats for the broader business environment. The data and access thereof creates immense opportunities even for incumbents in industries such as consumer discretionary alongside contextualised advertising, especially with personalised infotainment content. For example, massive chains like McDonald’s or Starbucks could use driver/vehicle data to optimise locations and easily geotarget advertising accordingly. We also see the development of SaaS providers that target the extraction/mining of data within this segment. As previously mentioned, Connexion Telematics (CXZ.ASX) is one company that comes to mind if one were to be encumbered by solely investing in the small pond that is the ASX.
The second aspect of shared mobility is probably the most obvious in terms of economic impact given the rise of Uber and Lyft. However, what isn’t immediately obvious within this is that it has broader implications for transport in general. Think, for example, of the rise of e-hailing and what this means for public transport and congestion. For one thing, there is great evidence to suggest that e-hailing has in fact lead to the increase of congestion since, as one McKinsey study showcased, fully a half of all ride-sharing trips would not have taken place in the absence of e-hailing (i.e. effectively meaning that there were a greater number of vehicles on the road than would otherwise have been the case). Another question that is immediately bought to mind within this context is automobile sales. One could easily argue that there might be a marked incentive upon policymakers and the population alike to put downward pressure upon private ownership of the automobile in preference for shared mobility especially in densely populated regions like Asia. Take Beijing for example (fun fact: China has already surpassed the US as the largest automotive market in the world), where locals spend approximately 1.3 hours in commute per day on average. As a case in point, across major metropolitan areas in China, including Shanghai, Guangzhou and Beijing, a number plate effectively costs more than the car itself.
Similarly, take note of nations like Singapore which actively discourages private car ownership with a 20% excise duty that effectively makes the nation one of the most expensive in the world to even buy a low-end Toyota. As such, it is logical to assume that we will see the greatest emphasis placed upon shared mobility and connectivity (especially in terms of data requirements) come from developed Asia before anywhere else.
Now, two companies worth a look.
Corning (GLW.NYSE)
It might seem a tad bizarre that after speaking about mobility and connectivity, the industries of the 21st century, I would recommend looking at Corning. This company is decidedly seen as a dinosaur, rightly so if one were to look at its age of 169 years. Their shot at fame within the automotive space came in helping the automotive manufacturers reduce their emissions as part of the requirements under the Clean Air Act of the 1970s. Most people are aware of the company as primarily a glass manufacturer and to a certain extent they would be right.
The more interesting story however is that Corning worked with Steve Jobs around the creation of the ultra-thin iPhone glass, now known as the Gorilla Glass. If you have a smart-phone you would probably be looking at or through a Corning manufactured product. It has proven not only to be adaptable but resilient in a dynamic space. As of last year, core sales for the company annualised $11.7bn USD or $1.76 USD per share. For me and within the broader connectivity and mobility thematic, think for a moment and ask yourself the question what are the components that go into connected automobiles. Yes, glass and windshields are required but more importantly, glass that is compatible with digital displays, that has the ability to respond to touch, connect with the web etc. My take is, look at it this way, if you’d asked me twenty years ago who would’ve won the mobile phone market, I wouldn’t be able to tell you but I could’ve jumped on the thematic by placing my bets on and investing in the controllables (i.e. the things that go into the manufacture of that mobile or smartphone). With Corning, it is not the Tesla of this thematic but it is a company that has a proven history and market share in a niche that it will likely continue to dominate.
It currently works as the original equipment manufacturer (OEM) for most of the major auto manufacturers across the planet, add in a diversified business that works across optical solutions as well with collaborations with Intel, Verizon and CenturyLink for the manufacture of its extreme density cable. This is one company that will benefit from the broader mobility theme. If you didn’t catch it earlier, optical solutions that go into enabling the 5G infrastructure is something I also consider part of this thematic since it is required for the connected car.
NXP Semiconductors N.V. (NXPI.NASDAQ)
Many of you are probably aware of NXP Semiconductors, but let us embark on a brief walk down history lane. The company itself is a spinoff from Phillips (PHIA.AMS) from which it was de-merged in 2006. Since then it has been a rather busy bee, announcing a merger with Freescale (which itself was a spinoff from Motorola eventually bought by Lenovo). It initially fell across my radar properly when Qualcomm (QCOM.NASDAQ) tried to make a bid in 2016 and, although it was given approval by US regulators, China refused to come up with a ruling.
That series of events in itself is interesting given it showed 1) increased consolidation within the broader semi-conductor space and 2) the political incentives that are also at play. We would posit that Chinese regulators were unwilling to give the green light for one simple reason and this is the same reason the discerning investor should look further into the company. The company now makes up close to 12% of the global automotive semiconductor market, a segment that is not only expected to grow at 7.5% CAGR for the next decade but one that is crucial for the building out of the connected car and shared mobility in general.
Importantly, the company acts as an OEM and key supplier of close to 95% of all automakers globally with considerable headway made in the Chinese market where it is in JV with Datang Telecom (600198.SHA). For the reasons mentioned throughout this series, including the upward pressure on data collection, we see semi-conductor usage and the market more broadly not only growing in volume but margins. Just think about the very simple maths of it all. If the new generation of connected and autonomous vehicles all have in the ballpark of 5x the requirement for semiconductors and there will be major incentives to transition to these vehicles, then it doesn’t take a genius to see the upside. NXP offers a unique opportunity to gain exposure to not only a market leader but also a potential takeover target if not from Qualcomm then a Chinese alternative. Or even a sale of NXP’s Chinese operations to a Chinese firm, since we’re quite sure the US and EU regulators would put up a decent fight, with the western operations being allowed to be taken out by Qualcomm.
This week we visit the first of the categories within mobility, that is the most obvious, the electrification of transport and automobiles. There are several key catalysts for this process including the continued adoption of regulatory frameworks by governments across the planet towards sustainable development and tackling climate change.
(Please forgive the title, it was too tempting to quote Eddy Grant’s iconic chorus. Ignoring that the song is about the 1981 Brixton riots, it is particularly fitting given that the song’s title refers to Electric Avenue in the south London district of Brixton, which was the first market street to be lit by electricity.)
Author: Sid Ruttala
Wherever you stand on the subject, and I shall avoid going into the science of climate change and the efficacy of the research behind it, these policy changes are happening. What we have been presented with is the certainty that there is general consensus towards creating sustainable goals and a key aspect of this is certainly the electrification of transport. However, when we talk of electrification we are not just referring to the electrification of automobiles but also large scale transportation including rail.
Let me set the scene, according to the International Energy Agency (IEA) and assuming a business-as-usual scenario, the demand for the passenger vehicle fleet will need to double to 1.7bn by 2035 and triple by 2050 in order to sustain even a modest amount of global growth. This increase comes at precisely the time when governments across the planet set out towards ambitious goals to diversify their energy base and reduce emissions. Regarding this, the EU has placed a reduction in emissions of close to 40%, China and carbon neutrality by 2060 and the US targeting reductions of 26-28% by 2025. This places immense pressure on both the automotive sector and the R&D race. This scenario makes electrification not only a “want” but a “need”, vital for the survival of auto manufacturers. This is because even if the average efficiency of the combustion engine were to be doubled it would not only be unable to meet the increased demand but also, from a regulatory perspective, meet emissions reduction targets (a double whammy).
To put this into a little more context, the world’s current stock of cars, trucks, buses, two-wheelers, trains, ships and aeroplanes account for about 20% of all primary energy consumed, almost 93% of which is dependent upon fossil fuels. Given that this is the case, there is a marked incentive for nations with a high level of population growth to diversify their energy supply, especially across Southeast Asia and much of APAC. This is perhaps the primary reason why the CCP decided to set up ambitious targets. It is not simply a question of emissions but also energy independence and national security. China and much of Asia is not only dependent upon fossil fuels but broader macroeconomic policy remains at the whims of energy prices. Take India as an example, its demand for energy is set to outpace domestic supply which, according to DFAT, will probably contribute less than 30% of that nations energy mix by 2035. It’s marked incentive is to diversify away from fossil fuels, including thermal coal which it remains on track to be self-sufficient in the medium term. From a policy perspective, this makes it imperative for Delhi to commercialise electric vehicles as quickly as possible.
What does this require?
One of the most misconstrued notions about the electric vehicle (EV) market is that it can be self-defeating in the sense that the source of the electricity generated might remain as fossil fuel. This requires a little more nuance. One interesting study I came across was a case study using British Columbia, where a renewable energy penetration target of 93% is set. Through the course of the study including scenarios making the utility controlled charging of vehicles to supply and demand. It showcased that electrifying the entire road vehicle fleet would require increased generation of up to 60% (relative to without electrification), though levelling the total cost of electricity at an increase of 9%. There are several angles to this study including the use of low-cost generation options such as wind and solar, as well as showcasing that the energy target would reduce carbon abatement costs by up to 30%. Further use of utility controlled charging actually reduces total system capacity up to 7%.
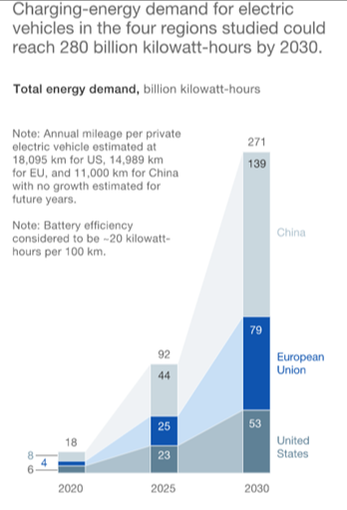
What is required if one were to extend the premise of that study to a global scale however is the necessity of a massive outlay in global infrastructure, not only in terms of charging stations but also increased R&D into battery efficiency. Without these outlays, large penetration of new technologies could have a detrimental impact upon grid operations and issues pertaining to excess generation, lack of flexibilities with the other headache being increased localised peak demands. This brings us to the first requirement, the building up of viable charging infrastructure and broader grid infrastructure that enables this while also maintaining current requirements for managing peak times. Take a look at the below graph which showcases the exponential growth in power generation requirements to over 280bn kilowatt-hours by 2030. The below scenario and assumptions bring us to the second requirement, that is innovation. In particular, the battery efficiency assumptions which are capped at 20 kilowatt-hours per 100km. From an investors perspective, there are two angles to look at here. The first is to find companies that are at the forefront in terms building out infrastructure capacity including incumbents, such as Royal Dutch Shell which recently beat expectations on dividend payout but is also looking to pursue its growing electricity business or traditional utilities businesses with a renewable energy mix. The second angle is to find companies that are actively seeking to increase battery efficiency, this might not necessarily be even the auto manufacturers, such as Tesla (TSLA.NASDAQ), but also companies like LG Chem (051910.KRX), Hefei Guoxuan High-tech Power Energy Co., Ltd (a subsidiary of Guoxuan High-tech, 002074.SHE), Contemporary Amperex Technology (300750.SHE), Samsung SDI (006400.KRX), Microvast (a pre-IPO company headquartered in Texas) to name a few that come to mind.
Source: McKinsey & Co.
Now that we have the infrastructure and battery efficiency covered, it is time to move on to the inputs. Most people think of materials including lithium or copper. What is perhaps more pertinent to look at are niches including red-flags and companies actively seeking to target these. For example, traditional battery technology (i.e. lithium-ion batteries) are cobalt-based. This system consists of a cobalt oxide positive electrode (cathode) and graphite carbon (anode). This in itself creates a constraint of sorts, since 60% of the global supply of Cobalt comes from the Congo, more specifically the Democratic Republic of Congo (DRC), which has been historically unstable and the extractive industries are themselves prone to gross abuses including the use of child labour. Investors could then seek to identify companies like Novonix (NVX.ASX), which is actively seeking to produce and commercialise cathodes that are purely lithium-based without the use of cobalt.
On a global level, it would pay for investors to look towards companies who can dominate a particular niche within the manufacturing ecosystem, including semi-conductor and GreenPower subsets. GreenPower, for those of you unaware, is “a subset of renewable energy and represents those renewable energy resources and technologies that provide the highest environmental benefit. The U.S. voluntary market defines green power as electricity produced from solar, wind, geothermal, biogas, eligible biomass, and low-impact small hydroelectric sources” (Source: EPA).
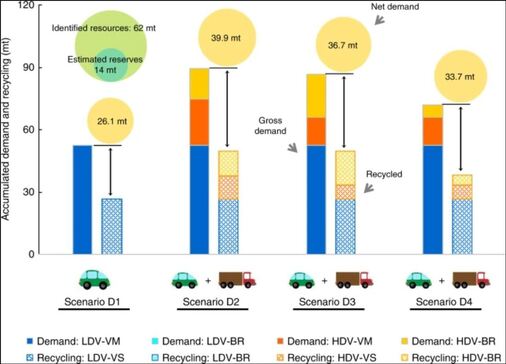
For the more adventurous (and those willing to stomach the volatility), the more traditional primary materials offer some exposure to the electrification trend, including lithium and graphite. I believe that current lithium prices should have considerable upside since most demand-based scenarios are predicated upon an undue focus on light-duty vehicles, with the assumption that the technologies underpinning the EV market will not be able to target the heavier duty large haulage market. One study I came across, by Han et al., showcased that mass electrification of the heavy-duty segment on top of the light-duty would substantially increase lithium demand and impose an immense strain on global lithium supply. A result that is attributed to the large single-vehicle battery capacity required by heavy-duty vehicles and the required increased replacement requirements. Under the above scenario, the net demand (including recycled) goes to about 38.9m metric tonnes, with current proven reserves stacking up at 62m. However, even here investors must remain cognizant of the interconnectedness of this to battery efficiency and broader technological advances taking place (i.e. higher the battery efficiency, the lower the replacement and hence lower demand for lithium).
Source: Han et al.
The majority of transport electrification studies, examining the demand and sustainability of critical metals, have focused on light-duty vehicles. Heavy-duty vehicles have often been excluded from the research scope due to their smaller vehicle stock and slower pace of electrification. This study fills this research gap by evaluating the lithium resource impacts from the electrification of the heavy-duty segment at the global level.
There are many ways to play the electrification of transport aside from the simple headline-hogging automakers. One should take a look at the relevant supply chains and adjacent categories, there are hundreds of possibilities here. There is also geographic segmentation to consider and one must take a look at some of the Asian markets for this or risk missing out. Don’t forget to look at the niche players out there that can target specific red flags too. This is still just the beginning but one thing is for sure, this thematic is going to produce some real returns for the savvy investor over the next decade.
Sources: Han, H., Geng, Y., Tate, J. E., Liu, F., Chen, K., Sun, X., . . . Zhao, F. (2019). Impact of transport electrification on critical metal sustainability with a focus on the heavy-duty segment. Nature Communications, 10, 1-7.