This week we look at the telco sector and how it is benefiting from a surge in demand due to the shift to working and staying at home. We believe the demand for faster connectivity will continue for the foreseeable future regardless of how the Covid-19 situation unfolds. We currently see good value in two companies servicing the sector. Read on to find out more.
Authors: Ron Shamgar
Over the last few weeks we have spoken to several telcos and service providers and the common theme so far is an increase in demand for faster internet, higher bandwidth and business services such as teleconferencing and number porting. With a wide range of ASX stocks to choose from, we have invested in a couple of stocks that are both highly profitable, cashed up and on an upgrade cycle. This week we discuss one of them.
Uniti Wireless (UWL.ASX) is a provider of telecommunications services specialising in fixed wireless, fibre and telco services to both consumers and small/medium sized businesses. UWL competes directly with the NBN and wholesales its fibre network to internet service providers in residential multi dwelling buildings and housing estates. This division of the company generates 55% of group revenues, has very high margins and is cash generative.
Source: Company filings
UWL also provides businesses with connectivity solutions such as 1300 numbers, number porting and phone PBX (Private Branch Exchange, a private telephone network used within a company or organisation) hosting solutions. This division is approximately 45% of group revenues and, although it operates in a more competitive part of the telco market, we believe it will continue to grow organically and through acquisitions.
Source: Company filings
Part of the appeal of UWL is the high quality senior management team and a board of directors with extensive experience in the industry. For instance, CEO Michael Simmons has over 30 years’ experience and was the CEO of both SP Telemedia and Vocus. Similarly, director Vaughan Bowen was the founder of M2 Group which was established 20 years ago and eventually acquired by Vocus. Directors have been continuously buying shares on market and in placements.
We view UWL as a sector consolidator. The company has undergone a series of acquisitions since listing last year and will continue to be acquisitive going forward. The company has over $36m of net cash to deploy. So far management has shown that acquired businesses are growing ahead of original expectations.
Source: Company filings
The company has upgraded profits twice this financial year so far while most other companies have been withdrawing their guidance. At the last quarterly update in April, UWL notes the following key developments:
March 2020 run-rate EBITDA is tracking above the internal forecasts that underpinned the prior upgraded guidance released in February 2020.
All three UWL business units performed above forecast in the March quarter, including revenue, earnings and cash collections.
Increased levels of work-from-home, online learning and domestic internet consumption due to Covid-19 have strengthened underlying demand for UWL’s superfast fibre-to-the-premises (FTTP) services.
UWL’s fibre infrastructure business delivered a record number of net new FTTP connections in March 2020.
Source: Company filings
We estimate UWL will earn over $80m of revenues and about $45m of EBITDA in FY21. The sector is currently trading on EV/EBITDA of close to 10x. UWL is on 9.5x while growing at significantly higher rates and, unlike many of its peers, is debt free. We believe UWL deserves a premium and we value the stock at about the $1.80 level.
Disclaimer: UWL is held in the TAMIM Australia All Cap portfolios.
We have always said that it is important to take time and revisit the basics every now and then. Living and breathing the markets day in, day out can let us lose sight of these basics, not seeing the forest for the trees if you will. It is often the simplest things that remain consistent for a longer time horizon. To crystallise things a little, we would like to go back and explain some things to our 21 year old selves with particular reference to some rules of thumb about how to think about finances and financial independence.
These principles are linked, interwoven and affect one another. The markets are complex organisms and we can’t expect to apply sweeping statements that are independent and stand alone. The basics are exactly that, the basics. They can be built upon and complicated immeasurably.
Principle 1 – High Return = High Risk
The markets are a function of risk, though we often forget this in the world we live in given the unconventional policy shenanigans that have somewhat flipped this on its head . The key is to understand the amount of risk taken and the expected return. The strongest investments (and investors) are those that maximise expected return and systematically reduce risk. For example, if two investments, A and B, have the same expected return, the key will be determining which has a lower risk profile. Investment is an art as much as it is a science, hence this might be a question of belief as much as it is about quantitative analysis.
Risk can also be understood as volatility and that is something that we have to learn to live with. There are certainly times at which the markets can be brutal and, as Charlie Munger says, a 50% drawdown is simply the price of admission. However, keep perspective and remember that, with a few notable exceptions like the Great Depression, the markets have been excessively kind over the past century and a bit. The way to think about volatility is time frame more than anything else. If you are looking at a time horizon of decades (be it talking about intergenerational wealth or those still in the workforce) as opposed to years then volatility and forgoing returns now for the future is not necessarily all that bad. Time in the market, not timing the market. Which brings us to our next point….
Principle 2 – Rule of 72 The Power of Compounding
Einstein called compounding the eighth wonder of the world and nowhere is this more evident than in the “Rule of 72”, used to determine how long it will take for money to double. It is a simple principle, annualised return of 7.2% means that it will take ten years for money to double. Seems rather obvious but looking at your universe in this manner allows you to be more disciplined and the perspective lets us know that there is no need to be in too much of a hurry. Using the same 7.2% return over forty years, 100,000 grows to 1,600,000 assuming that there are no additional investments.
This just gets better with regular contributions, potentially the best way to build wealth over the long haul. It also goes a long way to minimizing what we call sequencing risk, going all in at once and, in the event of sell-off, spending valuable time recovering is a rather unexceptional outcome. Automatic investments allow you to do dollar cost averaging, a fantastic way to maintain a disciplined approach to investing and controlling the emotional aspects associated with volatility.
For those of you that are a little more aggressive and want to go beyond the basics, have a rules based system whereby every percentage drawdown in the market gets you to buy cumulatively more and vice versa. Basically making sure that the amount of “aggression” is a direct and inverse correlation with market sentiment.
Principle 3 – Buy Insurance Hope for the best, plan for the worst
Whether you’re investing or you’re planning for your broader personal finances, it is crucial to understand that the only certainty in life is uncertainty. Unfortunately, the only certainty in the markets is that the markets hate uncertainty. We were reminded of this the hard way recently given the marked sell-off. We won’t be doing that again. Buying contents insurance doesn’t mean that you want to have a burglary or a fire accident but it makes sense to spread risk anyway. Taking out protection on your portfolio may cost you 1% in returns in an “average” year but could save you many times that in the one-off major drawdowns.
Principle 4 – Don’t Borrow (If you can’t repay)
Leverage can be the ninth wonder since it can amplify returns. But debt should only be productive, using it for tactical purposes when it comes to investments or for making property investments is quite different from borrowing for the sake of borrowing. Always assume the worst. For example, if making a property investment what might happen if all of a sudden your tenancies are cut in half or interest rates double? Again, always prepare for the worst and put capital to work like it is a rarity, as though you’re constantly in distress, even when it is freely available.
For equities investors, leverage can be a double-edged sword and the long-term benefits and drawbacks have more to do with emotional stability than about the actual numbers. For most of us (and this author in particular), if the first use of margin calls and leverage was a positive experience then the likelihood of staying in the game and developing bad habits is much easier. On the flipside if it is bad, then you might be irrationally risk averse and gun-shy.
Human beings are fundamentally motivated by two things, fear and greed. At their most base level these are literally just survival instincts, avoid things that will hurt us and acquire as much as we can of the things that make life/survival easier (i.e. food/shelter or the means to acquire them, also known as wealth?). Even the most stringent and genuinely altruistic ESG investor is simply motivated by the fear of what kind of world they think they will have to live in down the line given the current course, that long-term (unselfish) fear is simply outweighing short-term greed. The key is exactly that, finding a balance between the two. It was also very early on that this author learnt the downside of leverage too. If, instead of the -25% decline, you can stomach a -50% drop in a perfectly reasonable portfolio due to unforeseen events, such as those that have recently taken place (assuming a 2x leveraged portfolio), then you will be fine and recover over the long-term. If not, then steady as she goes and don’t bother.
The key here being don’t take risks on what you can’t afford to lose and always plan on the premise that what you borrow has the potential to go to zero and work around that. Plainly, only use leverage for a small proportion of your portfolio.
Principle 5 – Quit Procrastinating!
This one is probably the hardest. We constantly get overloaded with information, cognitive biases and different views on any number of markets and stocks. On a subconscious level, this overload might be an excuse for us to procrastinate and not make decisions. If you decided that you wanted to avail yourself of every possible bit of information and opinion on Apple stock before making any decision to buy then you would probably die never having logged on to your trading platform, let alone held it. There is simply too much information to do so. That is an extreme and hypothetical example (and that is why entire companies exist to distill some of that information) but it illustrates the point. Don’t get paralyzed by information overload.
Budget right, figure out your goals, the parameters within which you wish to achieve them and, as Nike says, just do it. The markets never have certainty, you can’t expect it from them, they are a function of probabilities. Develop a view, use your judgement and rationale and follow through with it. Be nimble if things have changed and willing to accept when (notice we didn’t say if) you get it wrong. In the immortal words of television survivalist Bear Grylls, “Improvise, adapt, overcome.” (We’re more paying attention to the “adapt, overcome” part here, feel free to improvise within your set parameters though.)
Yes, we might lose, but that’s life. Diversification and action is better than procrastination. Don’t get us wrong, we’re not saying be aggressive all the time but understand that even inaction is conversely an action in and of itself. If you have actively made the decision based on LOGIC that it isn’t a particularly good time, ask yourself the question why? And do so with the idea that you’re giving a presentation to a room full of so called financial experts who will question every assumption and everything you say. If you can’t do it then go back to the drawing board.
Time is money! The saying exists for a reason.
Principle 6 – Diversification is Vital
Remember Principle 1 about risk? Diversification is central to managing risk over a long-term time horizon. The key to diversification is managing, over the short-run, volatility risk and, over the long-run, market risk. Volatility risk is self-explanatory but market risk is the potential for a permanent loss in investment and this is exceptionally important on a long-term horizon. Though a full-time investor can afford to be a lot more concentrated given that they are constantly tracking underlying investments but for most of you that actually have a life to be lived, this is crucial. Remember that some of the top companies even a few decades ago, like Kodak, are no longer market darlings. So, no matter how good you think companies are at the moment, there is a potential over the long-term for risk to accrue as markets change and new technologies eat away at incumbents, the point being though the market might be a “voting machine in the short-run over the long-run it is a weighing machine” stay diversified and take move the weights. The obvious lesson here is stay attentive and make adjustments as markets and trends change but we are talking about diversification. There are those in the TAMIM office that believe you should only invest in companies that you are comfortable holding for ten, twenty or even thirty-plus years and this is where diversification becomes important. If Company X goes to zero and is one of ten (evenly weighted) stocks you own then the pain is significantly worse than if it were one of thirty.
However, that said, the marginal benefits of adding additional investments decreases as the numbers get larger and the costs become greater, taking us back to the risk/reward trade-off. If you want to shore up your risk profile then you are going to have to sacrifice some reward. The optimal is probably between 15-30 different strategies or allocations with the older you are, the more likely you are to go towards the higher number.
This is true life in general, not only for investing. It is what makes us human and what distinguishes our species. Asking why?
Everytime you make a new investment or think through an opportunity, keep asking why until it drives you quite literally mad. Just as a child who constantly questions, ask your investment managers why they do certain things and why they make their decisions, ask your local candidate on what your tax money is being spent. Questioning every assumption you’ve made and your entire belief system will make you not only a better investor but a better citizen (within reason, we don’t want hundreds of people spiraling into an existential crisis having read this).
For the more enterprising amongst you, please feel free to raise a ruckus if you go to AGMs, it might be worthwhile every now and then to have management realize that they are merely custodians. We are the owners, thank you sir!
Principle 8 – Emergency Cash Fund
We live in a lucky country, but also a country with some of the highest levels of household debt in the developed world (120% of GDP and likely to go higher). The low interest rate environment can make this seem painful but it is also true that we haven’t had excess amounts of inflation, it might therefore make sense to keep a certain portion of overall wealth in cash (no, not because you’re procrastinating!) for living expenses. The rule of thumb would be at least three months income for below 35s and for every five years after that add on another three months.
Principle 9 – Keep Track of Mega-trends & Mega-themes When Investing for the Long Term
This calls back to the point made in Principle 6 about staying attentive and adjusting. The best way to illustrate this principle might be to give examples. Some thematics that we currently recognise are the following:
Slower Economic Growth across the West.
Demographic Shifts: As the population across the West and even economies like China change, we will see marked shifts in both the spending patterns and stresses on the economy. Understand how this might impact healthcare, inflation, government pension liabilities, productivity growth etc.
Artificial Intelligence: This is arguably the most important over the coming decades. This is seen as having implications across transportation (driverless cars), financial services and retail (dislocations across frontline sectors). Most companies, including tech stocks, are at the forefront of making the requisite investments. But understand that in a dynamic world, there is always the potential for left-field events such as a new entrant with an innovative product gaining market dominance quickly.
Fragile Social Programs & Increased Income Inequality: As we headed into the most recent crisis, we were already encumbered by large amounts of government debt and fiscal liabilities, this is likely to get worse as structural unemployment and technological advancement puts downward pressure on wage growth leading to further income inequality. This has massive implications for investors. On the surface level, ask yourself questions like how this impacts luxury goods? Or gambling? But on a deeper level, this places immense uncertainty around the policy environment and the possibility of future inflation (governments have been known to try and inflate away the value of debt) and populism.
One does want to be careful with these mega-trends though. There will always be massive winners from these mega-trends but they are not easy to pick, let alone pick early on. Just look at one of the dominant mega trends of this millennium, social media. Back in 2006, who would have picked Facebook to so comprehensively and completely eviscerate MySpace? MySpace overtook Google as the most visited website in the US in June 2006, Facebook took over worldwide in April 2008 (May 2009 for the US). And yes, MySpace does still exist. The trend is more mature now but players are still coming, going and being acquired by the incumbents. Think Vine, Snapchat and now TikTok (a lot of those words will mean nothing to those that aren’t at the younger end of their adult lives or are without children). The point here being that picking the ultimate winner in these mega-trends is difficult, it is more interesting to think about how these mega-trends will support or detract from companies that are also not directly involved. Oversimplifying it a bit and looking at something that is playing out in the world today, don’t try to pick the electric car manufacturer that will ultimately be the big winner, pick the company that will be providing the components to half the players for the batteries, the semiconductor metrology manufacturer for the tech companies etc.
Simply put, simplify some of the mega-trends you might see, overlay it with your portfolio and try to get creative around how your portfolio behaves as those mega-trends play out. Make sure you are comfortable within this context.
Principle 10 : Minimise Taxes
First of all, duh. The less you give up in taxes, the more you end up with in your pocket. Following on from compounding, minimising the amount of taxes can make a marked difference in the long-term wealth of individuals and their families. In Australia, it is as simple as things like putting capital growth assets within the superannuation environment and utilising franking credits appropriately. Using credits to defer, reduce or “avoid” income taxes are things that have to be done in a disciplined manner.
With that being said, remember to not use tax incentives to make investment decisions, only the vehicles within which those investments sit. “I’m not selling because I don’t want to pay capital gains tax” is one of the most frustrating pieces of logic we hear all too often. First of all, you’re paying those taxes because you have done well, that is a good thing. More importantly, refusing to sell for this reason when you KNOW there are better companies/opportunities out there to allocate to doesn’t make sense. Taking the short term hit to set yourself up for better long-term growth just seems like the prudent course of action for a genuine long-term investor. Unless you trust your policy makers so much that you believe the status quo will be kept indefinitely. As last year has shown, remember the debate around franking? Keep the purity of investment and make them on their own merits, after which you can undertake the exercise of tax minimisation.
Robert Swift takes a brief look at the year that was 2019 and casts his eye toward 2020. What should we expect to see and where might we find risk appropriate returns?
Equity returns were strong in 2019 with major markets rising between 25 – 30% in US$ terms. This was despite an aura of despair regarding the strength of the global economy at the start of the year. Growth beat Value again and Large beat Small by a little bit.
In major markets the composition of returns was mostly comprised of price/earnings multiple expansion and negligible profits growth. In the United States a total return of 28.8% comprised 1.1% profits growth, 1.8% dividends with the balance provided by an expanded valuation taking the prospective P/E multiple to 18.5x for 2020. Market expectations for 10% profits growth in the United States in 2020 are likely to be downgraded to low single digits. China was one of the few markets where earnings and dividends generated the entire return of 16.8% and the earnings multiple contracted. China on a prospective P/E of 12.1x and Asia as a whole, on 14.4x offer a more sustainable mix of profits and dividends to generate returns in 2020. We are likely to find attractive stocks in these markets in 2020. We especially like smaller companies.
By the way, we recommend, again, that investors do not use GDP forecasts to predict equity returns, nor try to frequently trade asset class exposure up and down.
Despite or because of, such a strong year, we expect 2020 to be less buoyant. With more than a third of the world’s sovereign bond market providing negative yields, the relationships between equities and bonds, and discount rates for profit and dividend growth, remain anything but ‘normal’. In 2020 focus on decent balance sheets and be wary of locking your money away in illiquid assets. The WeWork/Softbank saga and the Woodford Investments fiasco in the UK show that the real risk of illiquid assets should not be calculated based on their price volatility; the true risk of illiquid assets is MUCH higher than liquid assets.
At some point the experiment of zero interest rates for all (ZIRP) will come to an end and someone will be found to be ‘swimming naked’. Debts have risen enormously and not all of these can be honoured or repaid. At this time illiquid assets will suddenly not look so good. Bear in mind just what a large percentage of USA IPOs that are loss making when they list. This is rather strange and reflects very high-risk tolerance by investors for unproven business models. The era of ZIRP has created hidden investment traps for everyone. We use Bucephalus based in Hong Kong to help us identify these.
We believe 2019 was the start of a multi-year re-appraisal of Japan and its problems. They are NOT the same as the problems in the Anglo Saxon West even though the media uses the phrase ‘turning Japanese’ to describe all struggling economies. Japan’s low nominal GDP is actually caused by poor demographics and not poor productivity from labour and capital investment. Australia has the reverse problem. Japan has adopted, quietly, a more thoughtful approach to immigration. Australia has not yet adopted a more thoughtful approach to total factor productivity. Japan’s low nominal GDP growth is irrelevant for the risk premium to be placed on Japanese corporate profits. Japan’s risk premium should be lower – in other words the market should be higher. It will get there.
If the West is “turning Japanese” it is only to the extent that zero interest rates have prevented the necessary clear out of bad capital allocation decisions – Japan had a similar problem for many years with the so called ‘convoy system’ preventing bad companies from going to the wall, or with shareholders not changing management. This attitude looks like changing and much M&A and corporate re-structuring is probably going to continue in Japan as a consequence. As for Europe and its “extend and pretend” attitude to their banking system? It is not going to end well. In that regard they are ‘turning Japanese’; just as Japan changes for the better.
Brexit is now likely to happen in some form or other and the withdrawal (probably reduction) of UK net contributions and the likely shrinking of its trade deficit (removing a much-needed source of demand for the Rest of Europe) may wake up policy makers in the EU? Ironically the EU could be worth joining if it reforms; but it will only reform if the UK leaves. This is a sort of reverse Groucho Marx situation – “I would want to join a club I had just left”?
We invested more in the UK before the election but will wait to see the exit terms, and the EU response, before we consider reducing a large underweight in Europe.
Hong Kong protests are understandable and with luck there will be pressure brought to bear on China to be more ‘democratic’ in its treatment of its outer regions. China is now more reliant on inward capital and global investors can make a difference. We can’t sign off without making the remark that if ESG is going to be effective and not just a ‘parroted phrase’, then much more work needs to be done to define what spheres it reasonably influences; how to measure success or change as a result of its implementation, and whether there can be one universally agreed set of principles. For example, even if China agrees to change as a result of global investor pressure (led by everyone’s most hated administration, the USA!), up pops India (everyone’s favourite emerging market economy but not ours) with its own brand of discrimination which should actually be triggering investment sanctions if ESG is to be more than ‘words’. Don’t get us started on Westpac.
Maybe 2020 is the year that ESG becomes more than a box ticking exercise? We hope so. We don’t manage (yet?) enough assets to make a real difference but do let companies know if we are unhappy with their Governance which we continue to believe is the root of all capital allocation decisions.
Best of luck for 2020 in your investing and we wish to thank everyone with whom we have had contact in 2019 for their interest. Don’t hesitate to get in touch if you wish to discuss any issue with us.
For the first newsletter of 2020 we put forward five key predictions for the calendar year ahead. Each of these will definitely impact the investing world and will have an effect on the Australian economy either directly or indirectly. It is always worth considering what lies ahead.
This week we would like to begin where we ended last year, revisiting a favourite exercise of ours: making predictions. However, a slight adjustment is in order since we would like to do so at the beginning of the year as opposed to the end. So unfortunately, given that we don’t have a little thing called retrospect, they might not be as exact. So here we go…
Prediction 1 – The coronavirus will be forgotten by July
Given the rhetoric that we have all have been seeing in the media over the past month or so this might seem rather optimistic but let us make a case for it.
The novel coronavirus (2019-nCoV) surfaced in Wuhan, China in late 2019, resulting in borderline draconian measures being put in place by Beijing to stop its spread. The affected provinces were quarantined and effectively shut off from the rest of the mainland (it has since spread to most provinces to varying degrees). While many people have drawn comparisons between the current crisis and the SARS outbreak of 2002-2003, there are significant differences, both good and bad.
Check out the interactive map from Johns Hopkins CSSE (screenshot below) to see the spread.
On the positive side, the fatality rate of this coronavirus is considerably lower than SARS which, at its worst, had a fatality rate of around 8.6%. 2019-nCoV, on the other hand, is somewhere closer to 3.5%. Though to what extent these numbers can be trusted given the history of the Chinese state in being particularly creative when it comes to statistics we leave for the readers to judge. Nevertheless, based on current news flow, there does seem to be a lot more openness in terms of disclosure than in previous crises.
On the negative side however, 2019-nCoV could be a lot more contagious than SARS which at its height impacted about 8000 people and killed 800. What will be particularly telling will be to see what is referred to as the R-Naught figure which refers to the contagiousness of the disease itself. For example, if a virus has an R-Naught of 3 it means that every person that has the disease affects three other people in the community and so and so forth. So if the figures that come through are on an exponential basis, then it becomes a bigger problem. Till now the draconian measures implemented by the Chinese government, including mobilising the army to cordon off areas, have meant that the impact area has been largely contained. What is also concerning about this particular strain is the incubation period which means that once infected it takes up to two weeks to actually show symptoms, this also happens to be why the Australian government saw fit to use Christmas Island.
Coming back to the impact on global markets, at the risk of sounding rather callous given the human cost, we would suggest that it is being blown out of proportion (the common cold being rooted in a coronavirus itself). The closest thing that we find analogous is probably the flu season which impacts between 9 and 45 million people in the US alone and kills between 12 000 to 60 000 people every year without a substantive impact upon GDP. Granted, the markets are prepared for it but, given what we know of this particular problem, it hardly warrants a 9% sell-off in the Chinese indices or a 150 basis point sell-off in the ASX. Think about it like a plane crash, the actual underlying impact is rather small but it is an outlier event when compared to the thousands of car-crashes that occur every day whose death toll is substantially higher. It will make an impact in very particular niches given Wuhan’s role in automotive manufacturing or if it spreads more aggressively into other more central provinces but, if contained, it’s impact on top-line growth should be negligible, maybe 20-30 basis points. If it gets bigger sectoral dislocations could occur; for example airlines, oil prices (due to travel restrictions) and tourism. Overall it should not impact global growth all that much, especially if the Chinese government decides to intervene directly and stimulate to meet their target of doubling the economy between 2010 and 2020.
Prediction 2 – A new round of QE will take place
As we suggested last year, the Fed’s intervention in the Repo markets in September is for all intents and purposes QE (even if they refused to name it such). What we see by these actions, and after Q4 of 2018, is their unwillingness to let market corrections take place. Despite the rhetoric that Powell chooses to use about not being in the business of propping up markets, we see a deep-seated aversion to anything that might rock the boat, USS Economy.
The thing to watch in this instance is not necessarily the Fed Funds Rate but rather the balance sheet. We think the odds of trimming it to be extremely low. Rather, they are more likely to let bonds go to expiry since central banks, by their very nature, can go into negative equity and still be functioning. In essence we are emphasising the notion of the Central Bank Put which, for better or worse, is going to mean that the Federal Reserve will let the markets run hot in the absence of inflationary pressures.
That said, we are by no means suggesting that valuations at this particular point in time are reasonable on a historic basis. Indeed, one needs only look at sectors like semiconductors which are extremely procyclical by nature to realize that the current status-quo is well into bubble-like territory (i.e. valuations are no longer being driven by fundamentals). A perfect example of this would be securities like AMD (see below) or even the FAANG stocks to a certain extent, which as of January 2020 have a market capitalization of 4.1 Trillion USD.
Source: Google FInance
Nevertheless, we fundamentally believe that in the absence of any changes to current, seemingly consensus, monetary policy stance around the world, we are unlikely to stop a continued melt-up in the coming twelve months. This comes with the caveat that current valuations also have the flipside of being priced for perfection and, as a result, any negative news is likely to see a disproportionate response in terms of price movements. In other words, volatility will be back again this year and if severe enough on the downside, which is almost certainly going to happen in the lead up to 2020 elections, the Federal Reserve will be forced to intervene directly and with the certainty that they won’t have the opportunity to even disguise it as was the case in September.
Prediction 3 – RBA cuts rates to 0.25%
So Wednesday came and went with the RBA holding rates steady at 0.75% as was expected by the market given better than expected employment figures. However, we do not, unfortunately perhaps, see this holding steady throughout the year. RBA Governor Lowe has already made veiled comments targeted at Canberra about the extent of firepower left on the monetary side of the equation. Perhaps he might be right on this front, since monetary policy can only go so far in impacting the underlying economy. In other words more needs to be done on the fiscal side of the equation, whether it be a more flexible approach to the obsession with getting back to surplus or spending on things like infrastructure. However and perhaps unfortunately, we are cynical that this might be the case given the political equations of our time.
In the absence of any substantial movements on the political front, any perceived weakness in the underlying economy, including a cooling off in the property market, will be met with more rate cuts and, given the headwinds we seem to be facing in the form of health (the coronavirus, granted blown out of proportion) and environmental/rural (bushfires) crises, we can expect that there will be hurdles along the way. Undoubtedly these hurdles will be met with rate cuts going towards the zero-bound. Maybe even our very own QE dare we say?
Again, despite the gloominess that all this might suggest, it is not necessarily all negative for equity markets depending of course on sectoral allocations. Infrastructure, utilities and the like are likely to be beneficiaries to this given their highly leveraged nature. Any government expenditure on longer-term projects going forward should also bode well for these sectors despite the regulatory mess that they seem to be facing in terms of policy clarity. In addition, finding companies with clear catalysts in terms of earnings growth should also allow us to be disproportionately rewarded by the market.
Prediction 4 – Trump wins re-election against either Joe Biden or Bernie Sanders
Funnily enough the sign James Carville famously hung in Bill Clinton’s Little Rock campaign headquarters in order to keep the campaign on message in 1992 is still rather relevant today. It read:
Change vs. more of the same.
The economy, stupid
Don’t forget health care.
It is point number two we would like to focus on here.
Let the circus begin. At the time of this writing, the Iowa caucuses are in progress and New Hampshire is soon to follow with approximately USD 40m spent on the campaigns already. The lead contenders as of the 5th of February are Pete Buttigieg closely followed by Bernie Sanders, Elizabeth Warren and Joe Biden. The caucuses, while remnants of the past and probably outdated in their function, are still fundamental to the American political process. For those of you who are not well-versed in the essential difference between a caucus and a primary, a caucus requires the registered party members to physically go to a meeting at a designated place to nominate their nominees whereas a primary is conducted in a similar manner to an election where the voter goes to polls to cast their ballot. The caucuses are often determined by the loudest and most active party, clearly benefiting candidates like Sanders over more establishment candidates such as Joe Biden.
That said, only six states still use the Caucus format to select their nominees with the rest being primaries. Iowa being a swing state has always been exceptionally adept at choosing the winning candidate and thus is seen as essential to the nominating process, though many have questioned the priority this particular state takes. Nevertheless, it is still a rather good representation of the mid-west which was essential for Trump to take the White House during the 2016 elections, Iowa going to Trump 51% vs. Clinton’s 41%.
One thing is for sure, the top three candidates during the initial primaries will have the momentum behind them in a rather crowded field to go on to national primaries including the all important California and New York. Currently, we would bet that Bernie Sanders and Elizabeth Warren will come out in the lead in early stages but Joe Biden will close the gap following deals with drop-outs or those that don’t have the requisite numbers. Bernie Sanders would appear to be the clear favourite within the party, especially with younger voters, with Joe Biden being seen as the man most likely to be able to beat Trump. Elizabeth Warren would, we assume, still be on the ticket as a running mate for either of those candidates.
All in all and returning to Carville’s second point, whoever the candidate might be, we find it exceptionally hard to believe that a contender could dislodge a sitting President with the economy going so well, even if he doesn’t actually understand how it works. Despite what your opinions about the man himself are, the dynamics of the previous elections mostly remain standing. While Joe Biden as a nominee would have the baggage in the form of his son Hunter and the Ukraine fiasco (depending on which way you lean, the Ukraine situation is baggage for Trump too), Bernie Sanders might be too progressive for most of moderate America unfortunately.
Just as last time, we see an electoral college win for the Tweeter-in-Chief and another loss when it comes to the popular vote.
Prediction 5 – Gold will break above 1700 USD but equities continue to melt-up
As mentioned a number of times last year, we are firm believers in the notion that gold should be looked upon as a hedge to a broader portfolio rather than a growth play. That said, we continue to believe that it has a long trajectory in terms of upward momentum. While we did not see it as particularly attractive then, this year the trends are indicating otherwise.
For one, the key will be a sustained break above 1500 USD and a resistance at that level. We are increasingly seeing a bullish pattern developing in combination with the other relevant factor: the USD. Again, as previously mentioned, the precious metal has an inverse correlation with the USD both for historic and practical reasons. As the Fed continues to lower rates and undertake unconventional policy tools we might see this correlation break. The USD might still have upward momentum given its reserve currency to the world status and weaknesses in the Euro as well as emerging markets but recent trends, including various moves by central banks around the world including the PBOC (China), RBI (India) and Russia, are suggesting that there is going to be increased demand. We predict that by the end of the year gold will reach 1700 USD.
Though the one downside could once again be the coronavirus since Chinese and Lunar New Years have historically created demand for gold since it is a common gift during these events.
Kevin Smith, of Delft Partners and portfolio manager of the TAMIM Asia Small Companies Fund, addresses Japan in the wake of some of the negative news associated with the market. Japan forms an integral part of both the Asia Small Companies and Global High Conviction portfolios and it is important to stay abreast of what is happening in one of the world’s largest economies.
Our October article highlighted that the Japanese equity market is changing with:
Improved governance of companies
Investors reducing exposure to cash in favour of equities
Recent “safe haven” status in the face of global volatility
We would like to reiterate our positive view of Japanese equities with this follow up article and address some of the negative news associated with proposed amendments to the Foreign Exchange and Foreign Trade Act (FEFTA) which are designed to control foreign investments that could threaten Japan’s national security. If the Bill is passed before the end of the extraordinary session of the Diet this month, the new rules would come into force in the first half of 2020. The main source of concern is the proposed 1% threshold (reduced from 10%) above which prior notification is needed for international investors to hold an equity stake in Japanese listed companies in key industries.
By way of background, the listed equity market in Japan has a relatively low percentage owned by foreign investors, currently 29% up from 18% in the year 2000. Some international comparisons are shown in Table One, each country has higher percentages of foreign ownership, the United States having changed dramatically in the past two decades while France and the UK have always maintained relatively high levels.
Table One: International Ownership of Equity Markets in Japan, US, France and UK
Sources: S&P500, ONS, Banque de France, Euronext and Bank of Japan
An example closer to home would be Taiwan that currently stands at 40% foreign ownership which has increased from zero in 1990. Taiwan suffered from a very similar financial bubble to Japan in the same timeframe of late 1980s to early 1990s. Taiwan responded to their financial crisis by allowing direct foreign participation in the equity market for the first time in 1991 when foreign ownership of the Japanese market was at 10%. The opening of the market has seen much larger foreign participation in Taiwan than that of Japan, although the latter is now at least showing signs of catching up.
A key factor in the opening up of Japan has been the reduction of defensive cross shareholdings. During the 1990s cross shareholdings accounted for more than 30% of the market capitalisation and today that number is less than 10%. Excessive cross shareholdings were associated with poor capital efficiency and complacent management in protected companies who were not motivated to deliver strong returns to their shareholders. There was a strong negative correlation between the number of cross shareholdings held in a company and return on equity achieved by that company. Aggregate return on equity for the market in Japan wallowed in low single figures for more than two decades and has only started to approach the double figure level in the past two years.
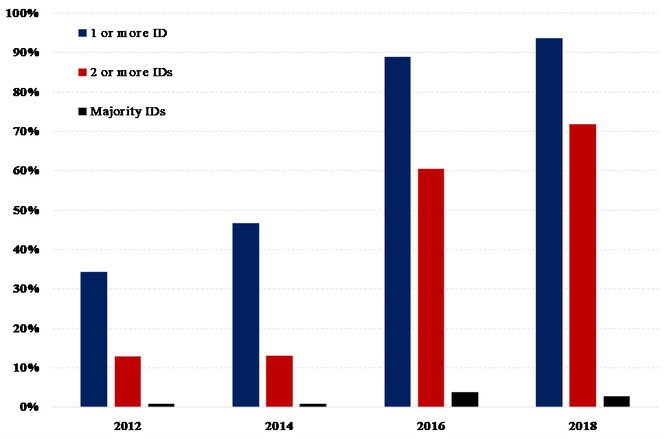
The Corporate Governance Code of 2015 has seen a dramatic reform in corporate leadership, ensuring transparent and fair procedures are used in the appointment and dismissal of senior management. The job for life culture has been eliminated in Japan. The Code recommends that companies appoint at least two independent directors, you can see in Table Two that more than 70% of companies have complied with that requirement, a dramatic change from 2014 when only 12% of companies had two or more independent directors.
Table Two: The Rise of Independent Directors in Japan
Source: Tokyo Stock Exchange
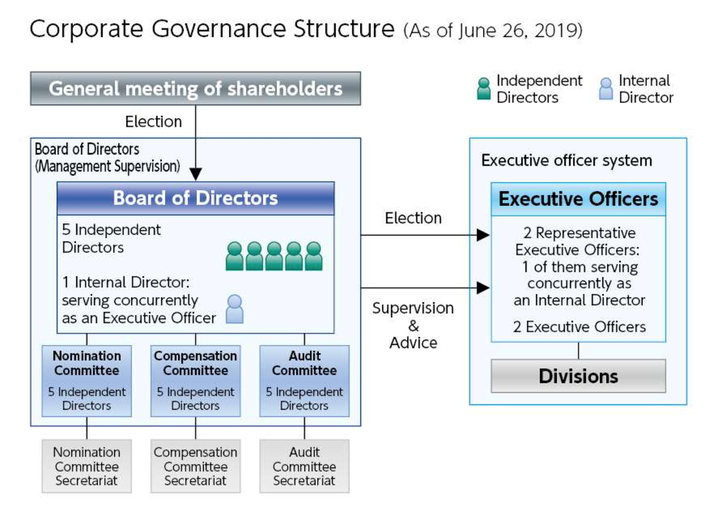
We expect to see big steps taken towards Boards with majority independent directors in the next five to ten years. Medical technology business Hoya Corporation is an example of a company that has made the transition to a majority of independent directors. Hoya Corporation has a structure that should be a model for other companies in Japan with 5 independent directors plus the CEO comprising the Board and all sub-committees are controlled by the five independent directors, see Table Three. Hoya Corporation therefore scores well on our assessment of corporate governance and is included in our concentrated portfolio of global equities. We like their rule that directors must attend at least 75% of meetings in order to qualify for re-election. The Board conducts an annual survey of effectiveness, operates clear rules regarding conflicts of interest and has a strong disclosure policy. Hoya Corporation specifically has a policy of not maintaining cross shareholdings and employs no anti-takeover measures.
Table Three: Board Structure of Hoya Corporation
Source: Hoya Corporation Annual Report 2019
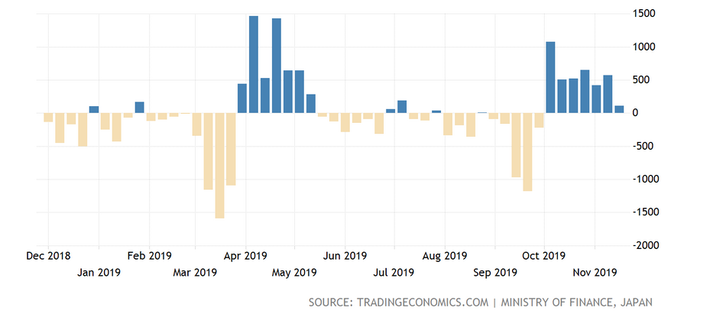
We have seen strong international buying of Japanese equities in recent months, Table Four shows the weekly flows in 2019 with positive numbers apparent in April/May and October/November.
Table Four: International Participation in the Japanese Equity Market
The average level of weekly net buying of Japanese equities by international investors since 2005 is just ¥37 billion which is equivalent to USD 18 billion per annum. In the past two years we have seen weekly outflows as high as USD 20 billion (March 2018) and annual outflows of more than USD 50 billion.
In our October article, we highlighted that a key change in Japan is the rise of activist shareholders, buying significant stakes in companies then demanding changes in strategy, structure and management. A survey by Nikkei found that 139 new stock purchases in the first eight months of 2019 were made with the intent to encourage companies to change how they do business. We suspect that the pace of change has caught the Japanese authorities and companies by surprise, perceived domestically as too much pressure to change too quickly. The existing disclosure rules leave companies wide open to unexpected changes in the shareholder registers which historically didn’t happen in the era of defensive cross shareholdings.
The scale of recent inflows has been impacted by the news surrounding the proposed amendments to FEFTA. We have seen industry bodies challenging the Ministry of Finance regarding the consequences of the changes to FEFTA and the response has been to start to modify and moderate the impact of the Bill. For example, international pension funds and sovereign wealth funds are excluded from the prior notification requirements together with international investors who do not intend to seek board seats. The Ministry of Finance will publish a list of companies to be included in these rules, that list is likely to be limited in scope and not the restraint on investment that was initially feared by industry participants.
In conclusion, we believe that Japan has adopted the correct path of improved corporate governance in recent years, significant progress has been made in a short space of time which has helped to increase the extent of international participation in the Japanese equity market. The proposed amendments to FEFTA are a short-term step backwards, a reaction to rapid change and not a change in the overall direction which should see international ownership of the Japanese equity market rise to the 35-40% level in the next decade.