EML Payments (EML.ASX) provided a nine-month trading update with $43.8m of EBITDA in the nine months to March ‘21. Q4 is seasonally weaker but with $10m of EBITDA delivered in Q1, typically the other seasonally weak quarter, EML was already on track to land at the top end of EBITDA guidance ($50-54m) and most likely beat it (prior to CBI regulatory issue).
We believe a reasonable resolution with the CBI, both in terms of timing and materiality, will be announced in the next few weeks and FY22 remains exposed to several positive trends as well as an encouraging pipeline of new business. We see a recovery in high margin multi-currency card volumes in Europe and gift card mall volumes should underwrite strong FY22 EBITDA growth.
Additionally, the PFS processing synergies should be delivered and the recently announced acquisition of Sentenial (pending final approval) will start contributing to the open banking opportunity. Finally, we have seen Marqeta IPO in the US with a valuation of 49x Gross Profit in 2023, compared to 6x for EML. Our valuation remains in line with previous estimates.
People Infrastructure (PPE.ASX)
People Infrastructure (PPE.ASX) announced two acquisitions, the first a leading staffing business and the second a surveying business in Queensland. EBITDA across both acquisitions is expected at $8.2m and earnings per share accretion of approximately 19%. PPE will pay $31m, funded from cash and debt facility. Management continues to execute well on their strategy and the business is growing both organically and through acquisitions. With a pipeline of possible deals and further $50m in capacity, we see PPE as well positioned.
Empired (EPD.ASX)
Empired (EPD.ASX) has secured a digital services contract with the Department of Innovation and Skills (DIS) in South Australia. The contract is for an initial term of two years. Work is scheduled to commence in July 2021 at an estimated value of $9m and a split across FY22 and FY23 of approximately $5.5m and $3.5m respectively. This contract represents a material win for EPD and demonstrates the progress management is making in executing on its Australian East Coast expansion strategy. We are expecting a strong result in August, showing improvement in all metrics and dividends. [Since this piece was originally written EPD has received a take over bid from Capgemini]
Cardno (CDD.ASX)
Cardno (CDD.ASX) announced a strategic review following the receipt of a number of unsolicited approaches from interested parties looking to acquire the company. The Board has decided to commence this strategic review process with the objective of maximising shareholder value. This process will involve an assessment of Cardno’s strategic options and the alternative strategies available to unlock and enhance value for Cardno shareholders. In other words, the company is in play.
We believe that CDD’s largest private equity owner, Crescent Capital, has decided that it may be time to realise their investment in CDD and Intega (ITG.ASX). We first took our position in CDD at around 30 cents and we forecast cash EPS of 7-8 cents in FY21. Assuming a takeover premium and a conservative multiple of 15x, we expect any takeover offer to be $1.20+. Watch this space!
Intega (ITG.ASX)
Intega (ITG.ASX) as per CDD above, they have announced a similar strategic review which is supported by their largest holder Crescent Capital. This is the result of increased activity and interest in the sector. The Board of ITG will be exploring ownership options for the company.
More importantly, management noted that ITG is performing well and is well positioned to benefit from the strong pipeline of infrastructure investment in both the US and Australia. The business has significant organic and inorganic growth potential, particularly in the US markets, as well as adjacencies.
The Board believes that the business is undervalued by the market and we tend to agree. We bought ITG at around 32 cents and we see cash EPS of 4-5 cents in FY22. We see any takeover premium landing around the 60-70 cents range.
Disclaimer: EML, PPE, EPD, CDD and ITG are all currently held in TAMIM portfolios.
This week we will be talking about two stocks in our Asia Small Companies portfolio. This portfolio focuses on investing in small companies (up to $10bn market cap) predominantly in north Asia due to the increased levels of governance. Asian markets are typically unloved, especially China and Japan, and this opens up a large opportunity to gain exposure to misunderstood companies that have big growth potential. More recently, there have been improving levels of governance across Asia with a greater emphasis on delivering shareholder value.
Author: Adam Wolf
The Opportunity in Chinese Equities
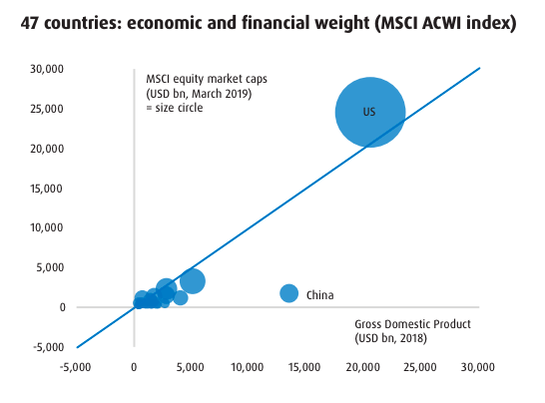
China has been rapidly growing their domestic economy through ongoing urbanisation, which is projected to rise to 70%. As most are probably aware, there have been increased political tensions surrounding China, causing an isolation of China’s economy and increased concerns about political risk when it comes to investing in Chinese companies. Our Asia Small Companies portfolio only invests in Chinese companies that are listed on the Hong Kong Stock Exchange to somewhat mitigate these risks. The negative attention surrounding China has led to cheaper valuations of Chinese companies which is creating a huge opportunity for investors to capitalise. To give some perspective, the US accounts for 25% of the world economy and has a 65% world cap weight compared to China who account for 15% of the world economy but only have a 1% world cap weight.
Source: BMO Global Asset Management, Bloomberg, MSCI, IMF, March 2019
Xinyi Glass (0868.HKG)
Xinyi Glass is a glass manufacturing company headquartered in Hong Kong providing high-quality float glass, automobile glass and energy-saving architectural glass. Xinyi has a sales network covering over 130 countries and regions around the world. Float glass currently represents 67.5% of Xinyi’s revenue with automobile and architectural glass making up the remainder. Xinyi’s share price is up 224% in the past year and expects their net profit to increase by 260-290% due to current glass supply dynamics.
Tightening Global Glass Supply
Source: Bloomberg Finance L.P., NBS, JP Morgan
Driven by a strong rebound in construction demand and limited production growth, the glass industry’s prices and profitability are approaching historic highs with float glass prices up 75% YoY. New capacity addition could be low in 2021 and the glass industry’s margin should remain at close to these historic highs, driving strong earnings growth. The supply of float glass has and will be constrained in 2021 and 2022 because of stronger environmental protection measures. Some production line repairs are unlikely to continue to operate despite the favourable market environment. Xinyi Glass will continue to expand their capacity to capitalise from the higher prices. Xinyi plans to increase its float glass capacity by 26.0% by the end of 2021. They will also look for more acquisition targets in the Chinese market alongside opportunities in overseas markets. Given their capacity expansion, Xinyi Glass is expected to outperform the industry in terms of shipment growth.
The EV Tailwind
Automobile production is starting to gain some traction due to the increased production of electric vehicles. Emissions mandates are putting more pressure on car companies to shift away from combustion engines while the general sentiment towards clean energy has also shifted and this is enticing a race for practical and scalable electrification for auto manufacturers. This is a tailwind for Xinyi’s automobile glass business given their key customers include Volkswagen, Ford and General Motors, all of whom are investing significant capital towards developing electric vehicles.
New Plant in Malaysia
As mentioned before, with the increased isolation of China’s economy, many Chinese companies have chosen to list in Hong Kong as opposed to Beijing as well as establish overseas production plants to maintain and expand their exporting capabilities. Xinyi established a plant in Malacca, Malaysia which spans over 444 000 square metres. This plant is essential for Xinyi increasing both their domestic and international market share. The Malacca plant will feed product into international markets, allowing more of the domestic production in China to stay in the home market.
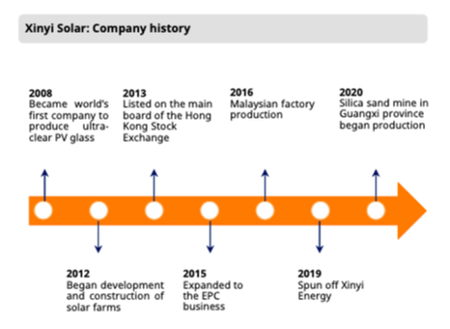
Xinyi Solar
Xinyi Solar Holdings (0968.HKG) is the world’s largest solar glass manufacturer, trading on the HK stock exchange with Xinyi Glass owning 23% of the company. Xinyi Solar has been benefitting from the roaring solar panel industry, projected to reach $223bn by 2026 growing at a CAGR of over 20%. Xinyi Solar recently announced guidance of a 100-120% increase in net profit for the half year ended June 2021, they have significantly expanded their production capacity and are benefiting from the incentive programs in place to reduce emissions thus increasing demand for their solar glass. Xinyi Solar is currently trading at about 10x EV/EBITDA and are paying a 1.64% dividend yield.
Source: Company data, Mirae Asset Daewoo Research
Thesis
Simple, Xinyi Glass has been the biggest benefactor of tightened glass supply and they are ramping up production to fully capitalise. Their half year guidance puts them at an EV/EBITDA ratio of approximately 12.3x (a conservative estimate given that their holdings in Xinyi Solar and Xinyi Energy combined are worth over $33bn HKD), a compelling metric with their 200%+ increase in NPAT. Xinyi also stands to benefit from the shift towards cleaner energy through their automobile glass segment which will see increased demand on the back of electric vehicle production and through their holdings in Xinyi Solar. Management have announced share buy back programs and have already bought 1% of the total shares outstanding since March, showing great confidence in the company and something which has been reflected in the share price.
Lien HWA (1229.TPE)
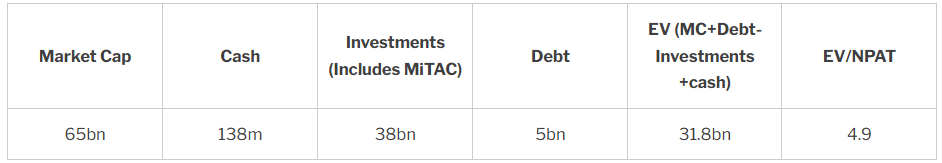
Our next stock is Lien HWA Industrial Corporation, a Taiwan-based company mainly engaged in the processing and distribution of wheaten food products. These wheaten food products include flour, wheat bran and pasta, amongst others. The company operates a number of business operations, including a leasing segment which operates real estate leasing and a development business. While they started off as a flour producer they are now a holding company and the hidden gem is their 73% stake in MiTac, an innovative electronics business that is driving Lien’s profits.A feature we like of the Taiwan stock exchange is that companies must report their sales figures monthly, providing greater transparency to shareholders and giving us more timely information to make investment decisions.
The Hidden Gem: Subsidiary MiTAC
MiTAC is a provider of smart technologies, electronics and cloud services. MiTAC is looking to capitalise on the emerging thematics of IoT, smart cities and autonomous vehicles, something we touched upon in a previous article. To capture these markers MiTAC also provides integrated hardware and software solutions including dashcams, smart cameras and navigation systems to the automotive industry. These products also tie in with their connected car and smart city solutions. MiTAC currently accounts for around 50% of Lien’s earnings, recording $11b TWD of revenue for the first quarter.
Source: MiTAC Investor Presentation
Property Development
Lien HWA Property Development is a subsidiary company, established in 2019 from the real estate & leasing division of Lien HWA Industrial Corp, with management and development of company-owned real estate across Taiwan as its core business. A special unit has been established in conjunction to provide professional services to meet customer demands including real estate leasing, assets enablement and value-added developments. The property development segment further diversifies Lien’s revenue mix and currently accounts for 4% of their revenue. Lien holds around $4bn TWD worth of property.ThesisRIght now there are very few analysts covering Lien. Lien HWA is a misunderstood company and, just like some of the Asian markets in general, it has hidden gems that aren’t being appreciated to the extent they should. Lien HWA may look like a simple flour business but it is actually a flour business with a key stake in an innovative electronics business as well as an established real estate business. Lien HWA presents an extreme value proposition with the growth upside of a tech company targeting emerging thematics. We see MiTAC continuing to drive Lien’s earnings, benefiting from autonomous vehicles and smart cities given their IoT and connectivity offerings. Lien is currently sitting on a 5.8% dividend yield and distributes both a cash and stock dividend.
Note: Figures calculated from the 2020 Annual Report, all denominated in TWD.
Disclaimer: Both stocks are currently held in TAMIM’s Asia Small Companies portfolio.
This week we continue on the thematic of REITS and look at two US based entities one of which, VICI Properties, we feel makes a rather rational investment case for inclusion in portfolios while the other, Digital Realty, is on our watchlist.
VICI Properties (VICI.NYSE)
Author: Sid Ruttala
For those of you familiar with this particular REIT, you may know it as the spinoff from Caesars when that particular company filed for bankruptcy a few years back. Given the unique tax treatment for REITs in the US, the administrators at the time thought it prudent to take the underlying casino assets from Caesars, including iconic assets such as Caesars Palace in Vegas, and put the assets in a REIT structure. Since emerging from bankruptcy in 2017, the trust has made significant headway in not only diversifying the business to now include categories across gaming, hospitality, entertainment and leisure destinations but also strengthening their balance sheet and geographic exposure. The most recent acquisition has been the Venetian (another iconic piece of real estate in Vegas) at a cap rate of 6.5%. The operating segments now comprise both real property and golf courses across Vegas, the Midwest and East coast.
So, why is this company worthy of consideration as an investment proposition? Let’s get to the numbers first. Revenue at TTM (Trailing Twelve Months) currently stands at approximately $1.34bn USD, growing from $900m USD in 2018. Price to book stands at an attractive 1.8 while the PE (again, on a trailing basis) stands at 14x. This in itself stands as an attractive proposition in comparison to some of their peers in the market. While the securities did take a hit during the Covid related sell-off last year, the market seems to have woken up to the fundamentals. Firstly, the nature of the rental contracts ensured that the business continued to get paid while the underlying valuation of the properties continued to grow.
As the economy across their major markets, including the Midwest and East coast, continues to recover we should see the business come back into the spotlight. In addition, the nature of her revenue stream, especially gaming, ensures sustainability through market cycles. Take for example, the last major crisis before Covid, the GFC, from peak to trough from ‘07 to ‘09, the gaming industry overall lost 9% in revenues compared to 11% in broader retail and 18% overall in terms of the S&P500. This indicates the durable nature of her revenue streams. Moreover, the Weighted Average Lease Term across the portfolio stands at stellar 34.5.
From a portfolio allocation perspective, what is attractive about this business is the nature of her revenues. What we are referring to here is the fact that there are built in escalations of an average of 1.5% and a further 94% of the contracts indexed to CPI. This proposition is further enhanced by the fact that 91% of the debt is fixed (as opposed to floating) and 69% unsecured, which should see it protected against any surprise changes to Fed policy.
My Expectations: A great reflation trade and bond substitute that should see more interest from the broader market over the next 24-months. The attractiveness is further enhanced in an inflationary environment (as a protection against loss of purchasing power). Significant growth as it is somewhat insulated, in my view, from the “Amazon effect.” By that we mean that people remain attracted to the physical experience of going to the casino (you also can’t physically play golf online). In addition, the moat comes from the capital intensity and high barriers across most of their revenue stream.
Dividend Yield: 4.14% (historic growth of 9.5% p.a.) and, in our view, there is no reason for this not to remain the case as the trust has a payout ratio of 71% even at this yield, a significantly lower proportion in comparison to her competitors Spirit or Realty Income (an average of 80%).
Digital Realty Trust (DLR.NYSE)
Digital Realty is quite possibly one of the biggest businesses you’ve never heard of. A technology business masquerading as a REIT. It owns and operates nearly 300 data centres globally, operating in every continent apart from Antarctica. To put it simply, they invest into carrier-neutral data centres. It works like this, say you’re NAB (who are in fact a customer) trying to move and compete in a digital world with requirements ranging from online banking to internal ERP (Enterprise Resource Management) systems and handling sensitive information. The requirements can be summed up simply:
Storage capacity;
Expertise to maintain the infrastructure;
Doing so in a secure manner;
Ability to take the data and turn it into actionable insights for strategy purposes;
Digital Realty helped by creating a 5,600 square meter facility based out of Deer Park (this also consolidated their close to 20 smaller existing data centres based out of various commercial properties across the nation). If you have a NAB account or have interacted with the business, all things equal, your information may have just passed through the infrastructure. What is more interesting in my opinion is the long-term nature of the lease and the moat that is built around their revenue stream. Just like most ERP systems, once customers have made the decision to allocate capital, it becomes exceptionally sticky as customers grow more reliant and their requirements increase in complexity. Anyone who has experience with this kind of software/technology knows how exceptionally difficult it becomes to migrate away.
On top of being a traditional REIT, DLR operates a unique value-add model that has two attributes: 1) cash flow; and 2) stickiness of revenue. For the ESG-focused amongst you (which will help it make it more palatable for the institutional flows), the company also has a 100% renewable target. From a strategy perspective, they seem to have taken the old adage “if you can’t beat ‘em, join ‘em” to heart, offering multi-platform solutions working with IBM, Oracle and Equinix (who are also customers, which is rather handy). For the Australian investor familiar with a company we used to own in Megaport (MP1.ASX), the business has a partnership there too. In emerging markets, the go-to partner is Brookfield (Latin America) and Mitsubishi in Japan.
Coming to the numbers, revenue on a TTM stands $4.17bn USD and Net Margin stands at 10%. Price to book at 2.66 and P/E at 111.11. The last number is off putting but it has to be considered in conjunction with the Net Margins as well as the growth potential going forward. Looking back to the thesis around inflation, similar to VICI, over 94% of the debt on the balance sheet is fixed and, more than VICI, this remains unsecured.
My Expectations: This remains an expensive proposition (which is why this no longer owned but rather on our watch list) but, to paraphrase the PM of our Global Mobility strategy, data is the oil of the 21st century. I would go further, oil is rather pro-cyclical but data will be the lifeblood of business going into the 21st century (i.e. oil with attributes of consumer staples). From that perspective, DLR still remains on our watchlist with some of the risk mitigated by the stability of revenues, the fixed nature of the debt on the balance sheet (any increases to CPI is effectively a transfer of wealth from debt holders to bond holders) and de-risked given the unsecured nature of said debt.
The risk remains the high P/E and any changes to the headline rate environment should impact the business. But for the long term investors, this is not a yield story but rather a dividend growth story.
Dividend Yield: 2.98% with the expectation of long-term growth within the high single or double digits given the space it operates in.
Disclaimer: VICI is held in the G-REIT segment of TAMIM’s Listed Property portfolio. DLR, while not currently held, is being monitored.
This week we look at two junior banks that currently sit within select income-oriented individually managed accounts at TAMIM. That is the Bank of Queensland (BOQ.ASX) and Bendigo and Adelaide Bank (BEN.ASX). This is a timely review given the RBA’s flip-flopping around the potential timing of rate hikes.
Author: Sid Ruttala
I personally continue to believe that a rate hike will be 2024 at the very earliest given the emphasis on wage growth as a policy metric. If that is the case then the property market is likely set to continue on its trajectory for a good 24-months yet with that being reflected in an expanding mortgage book across the banks.
Given the above context, why look at these two particular institutions? For one thing, both have a disproportionate exposure to residential mortgages as a percentage of the balance sheet; BEN the highest at 72% and BOQ close at 66%. The only close peer to this metric in the Big 4 is Westpac (WBC.ASX) at 63%.
Bank of Queensland (BOQ.ASX)
BOQ is perhaps one of the most unique models in Australian banking, perhaps even globally. Their owner operated franchise bank model is supposed to help the business deliver better customer service as well as build better flexibility. Whether the bank is able to sustain this in an environment characterised by shrinking physical footprints in favour of online business channels is a question for the future. The bank does seem to have a coherent digital strategy however and time will tell how they manage to integrate the existing footprint of ‘owner managers’ into this context. However, for the longstanding shareholder it has been a rather painful experience to date in comparison to her peers (i.e. the opportunity cost of owning BOQ as opposed to holding one of the Big 4).
Nevertheless, it does seem the business is changing for the better. The most recent indicator of which has been the acquisition of ME Bank at a palatable price tag and which has received approval from the Treasurer. This adds a great compliment to the existing mortgage footprint. It has also maintained strong housing loan growth at 1.6x system. This compares well with its peers with the highest amongst the Big 4 being CBA at 1.2x. Numbers wise, statutory NPAT came in at $154m AUD – up 66% compared to 1H20 – and cash earnings grew at 9% to $165m. Perhaps the most important metric for us however was the fact that the business continued to maintain its NIMs despite the falling cash rate (this was predominantly driven by flexibility in deposit pricing). EPS came in at 35.5c per share (up 3%) and with the addition of ME we should see this number grow 30% by FY22.
On the negative side, some of the positive numbers were made possible entirely as a result of reversing Covid provisioning with the bank releasing $75m AUD from its group provisioning as well as a loan impairment benefit of $20m AUD. Despite this, I remain of the conviction that the bank remains a good buy.
Their continued focus on deposit growth and concentration into the residential housing market looks set to continue on par with the broader property market. In addition, despite the significant loan growth, the continued low interest rate environment effectively ensures credit stress will continue to remain benign.
Red Flags & Risks: This investment is almost entirely predicated upon continued growth in the residential property market. Intense competition in the space also creates an environment ripe for the deterioration of credit quality along with pricing pressure. The additional risk of increased costs following the ME acquisition and integration remains.
My Expectations: There is significant upside in line with the broader property market at least till 2023 when the market should begin to price in the possibility of rate hikes; potentially a share price of $13 AUD by end of 2022. This is effectively exposure to the residential property market without having to go through the process of taking out a mortgage and sustaining a reasonable dividend yield for the hassle of doing so.
Dividend Yield: 4.2% assuming a share price of $8.99 AUD, expecting this to grow on a nominal basis over the next Financial Year.
Bendigo and Adelaide Bank (BEN.ASX)
BEN is another bank with a markedly different business model to the traditional banking houses. They operate a community branch model alongside the traditional corporate branches. While this has helped them gain greater scale than would otherwise be the case, this has unfortunately not been reflected in total returns or ROE (as long standing shareholders are probably well aware). So the question remains, why do I believe BEN.ASX seems attractive at this point in time? Again, it effectively remains a play on headline cash rates and the continued growth of the Australian housing market. Along with my soft spot for the fact that it has a significant footprint within regional Australia and Agribusiness (but that’s neither here nor there).
Looking at the outlook for the next 24-months, with 75% of the bank’s book in the residential housing space and continued expansion of the economy along with low unemployment figures, the bank is in a good position to show some decent results. During the last announcements for 1H21, the headline earnings increased 156% compared to 2H20 and 2% compared to 1H20. Cash earnings per share continued to normalise, though they still remained down in comparison to 1H20 (-6%). Similar to BOQ, we should see some decent revisions upwards given that the bank will release somewhere between $30-40m AUD from Covid-related loan impairment provisions and has seen their NIMs stabilize. However, CET1 stands slightly lower than BOQ and the broader banking system at 9.36% but this isn’t a significant cause for concern.
The bank does have a strategy to streamline the process of loan approval and bring down the cost/income ratio. The strategy of trying to attract and retail to younger customers is interesting and it will be worth watching how their digital offering and metrics compare with their competitors. This has so far paid off across most of the business and agribusiness divisions while the consumer division (which remains the bread butter) has seen some progress (Opex coming down by 1.6% in 1H21).
Red Flags & Risks: Like BOQ (and much of the financial services sector in this country) the business has significant concentration risk towards the housing market (more so in this instance as it has the highest percentage of the balance sheet allocated to the space). We are likely to see continued pressure and deterioration of credit quality as players compete for growth.
My Expectations: Again, this is a valid and more liquid alternative to residential property investment with the advantage of a considerably higher yield and, given that the business currently trades at a PE of 12x earnings, a much better risk-reward. That being said, there is better upside with BOQ.
Dividend Yield: 4.5% assuming a share price of $10.18 AUD.
Final Caveat & Biggest Risk
This is again a play on residential property growth. At this point there is a marked incentive for policy makers to reign in the market, perhaps not through the cash rate mechanism but rather through alternatives (e.g. lending standards).
Disclaimer: Both BOQ and BEN are held in select individually managed accounts (IMAs) run by TAMIM.
Three weeks ago Ron Shamgar was on the business channel Ausbiz discussing a number of companies we own with takeover appeal. One of them was rhipe (RHP.ASX). Last week RHP received a takeover bid at a 35% premium to when TAMIM bought in. This week we explain why we believe RHP is still undervalued and explore two other potential targets we like.
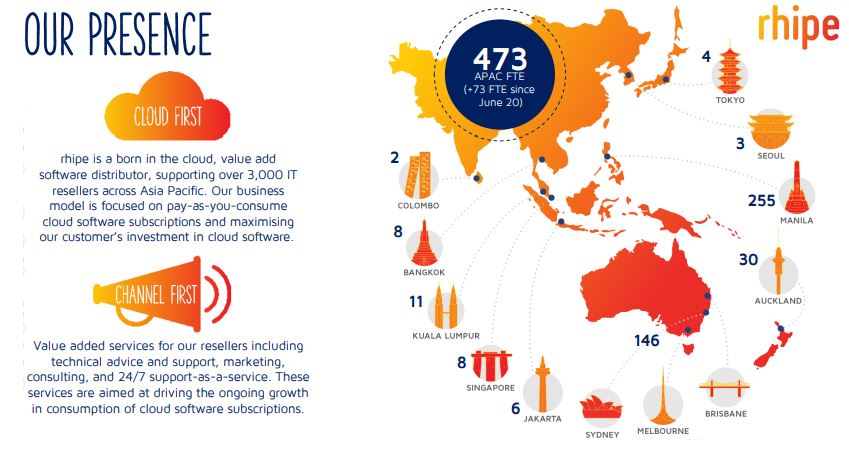
rhipe (RHP.ASX)
rhipe is a software reseller and is a strategic asset with 3,000+ resellers across ten countries in the APAC region. They predominantly sell Microsoft products (70% of sales) which provides other acquirers an opportunity to offer other vendor solutions – think Google, AWS, Symantec etc – to its product range.
Source: RHP 1H FY21 Results Presentation
RHP have been expanding in the APAC region, including a Japan JV in 2019, while also growing their portfolio of vendors to offer more solutions. Additionally, RHP have been focusing on building their own IP so they can offer their own software products as a standalone or in bundles with their resale products.
Authors: Ron Shamgar
Returning to the takeover offer, the bidder, a company called Crayon (CRAYN.OL) – is listed in Stockholm and has a very similar business model to RHP in Europe. CRAYN has already raised the funds for the deal through a bond offering so they are fully funded and ready to go. The due diligence and the Scheme Implementation agreement took only three days to complete once the offer was announced.
CRAYN has made this bid for RHP at a cyclical low given their exposure to South East Asia which has been heavily affected by Covid. This impacted their share price; RHP was trading at around $2.40 pre-Covid and has traded roughly in the $1.50 – $2 range since. As touched upon above, RHP has been investing significantly in Japan and Korea of late. Japan is the largest Microsoft market outside of the US and the upside of the 2019 transaction is yet to impact earnings for RHP.
We estimate significant synergies (approximately $10m p.a.) for CRAYN from the acquisition. RHP is cashed up with $54m on the balance sheet and no debt. Based on FY22 forecasts, the RHP bid values it at 15.5x EV/EBITDA but with synergies the multiple is closer to 11x. Other recent software deals have seen multiples range from 18x for Hansen (HSN.ASX) to 49x for Altium (ALU.ASX).
Given the timing of this acquisition and the strategic value RHP offers, we see a high likelihood of competing bids emerging from either an ASX listed company like Data3 (DTL.ASX) or another global player. The bid (with franking credit) is worth $2.56 but we think a price of $3.00+ is more reasonable.
Watch this space.
Capitol Health (CAJ.ASX)
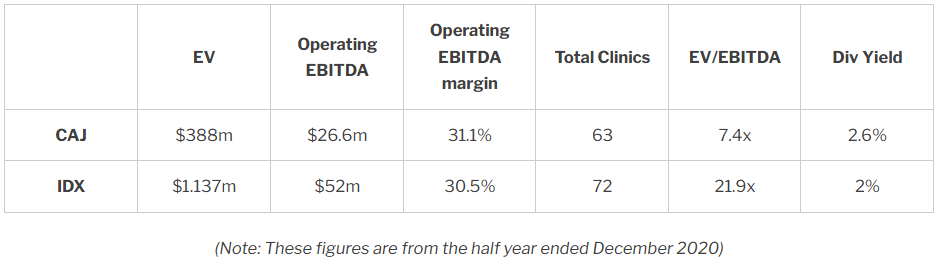
Capitol Health is one of the largest providers of diagnostic imaging and specialist radiology services in Victoria, they currently own and operate 63 radiology businesses around Australia. CAJ is a defensive business with their revenue coming from essential services such as X-rays, MRI’s and ultrasounds. The fact that 77% of their revenue mix is bulk billed is another great defensive indicator, meaning customers pay very little out of their own pocket for Capitol’s services. The newly appointed management team has turned the business around in the last eighteen months with improved margins, organic growth and a strong balance sheet. Their operating EBITDA was up 50% for HY21, improving their operating EBITDA margin from 22% to 31%. CAJ have grown their business by upgrading/expanding their clinics to maximise their revenue potential for each clinic, accretive acquisitions (most recently Direct Radiology) and a focus on customer referrals.
The sector has been consolidating with several deals coming through recently. This includes the likes of Sonic Healthcare (SHL.ASX) buying Canberra Imaging Group at approximately 9x EBITDA and Quadrant selling Qscan to Infratil (IFT.ASX & .NZ). We believe that this corporate action in the sector not only makes Capitol Health look cheap but also makes them an attractive takeover target.
Listed peer Integral Diagnostic (IDX.ASX) is trading on 13.5x EBITDA while CAJ, currently sitting on a market cap of $390m, is trading on 7.5X EBITDA.
The metrics above show how compelling CAJ looks as a takeover target.
Looking at the corporate activity in the sector and the comparison with IDX, we think any takeover premium should see at least a multiple of 12-13x EBITDA and there is also the possibility of CAJ making further acquisitions this year.
Uniti Group (UWL.ASX)
Unita Group is a telco fibre provider to the residential sector and the only competitor of scale to the NBN. We estimate that UWL is currently winning a 25-30% share of all new greenfield developments against the NBN. UWL is currently annualising $130m of EBITDA and has a contracted pipeline of over 250,000 lots to connect fibre over the next 3-4 years.
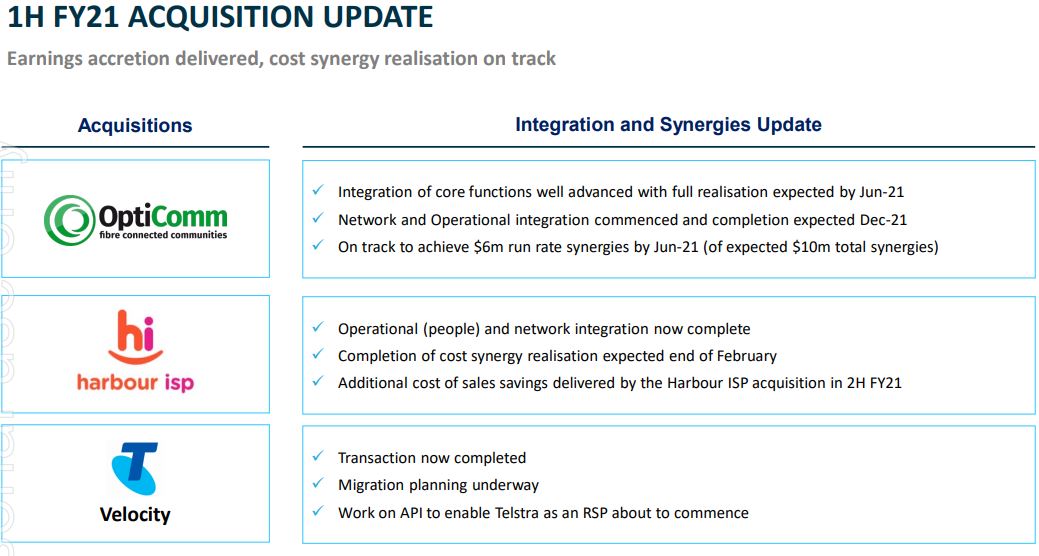
At full rollout, we estimate that the group will have a run rate of $200m EBITDA. We like companies like Uniti as the majority of this EBITDA is recurring, long-life defensive core infrastructure earnings. Their sustainable cash flows also enable UWL to access cheap credit to expand the business through acquisitions, as we have seen through Opticomm and, more recently, Telstra Velocity, Telstra’s fibre business.
UWL are starting to see some structural tailwinds as demand for data consumption and connectivity rises. This has been accelerated by the pandemic and the general shift towards digitisation, something UWL are looking capitalise on through their Communications platform as a service (Cpaas) which is proving to be a very profitable business for UWL, accounting for 47% of their free cash flow. UWL will also benefit from a variety of emerging thematics such as 5G, IoT and data centres (a theme we spoke about the past fortnight). With a strengthened property market UWL will also have an opportunity to win market share from the NBN on the back of their acquisition of Opticomm who have a big presence in the residential market. Also of note is the fact that UWL recently got admitted to the ASX200 index. This usually provides a bit of momentum in the share price as UWL’s stock would be bought by rebalancing index funds.
Source: UWL 1H FY21 Results Investor Presentation
We have seen significant deals for these types of infrastructure assets here in Australia recently. Super Funds are managing so much money that they are running out of places to invest it all and, in order to achieve their 7%+ p.a. returns, infrastructure assets have become a hot commodity. For example, Telstra (TLS.ASX) has sold half of their mobile towers for 28x EBITDA while Sydney Airport only this week received a bid on 25x pre-covid earnings from Qsuper. It was evident again in Aware Super’s takeover battle against UWL for Opticom last year. UWL are currently sitting on a $2.2bn market cap which puts them at about 17x EBITDA, We wouldn’t be surprised to see Aware or someone else come back and bid for UWL in the near term. We estimate that any bid will be $5.00+.
Disclaimer: RHP, CAJ and UWL are all currently held in TAMIM portfolios.


 EML Payments (EML.ASX) provided a nine-month trading update with $43.8m of EBITDA in the nine months to March ‘21. Q4 is seasonally weaker but with $10m of EBITDA delivered in Q1, typically the other seasonally weak quarter, EML was already on track to land at the top end of EBITDA guidance ($50-54m) and most likely beat it (prior to CBI regulatory issue).
 Source: Bloomberg Finance L.P., NBS, JP Morgan