This week we start a new series. One focusing on something many Australian investors place great value in: dividend yield. To start off we look at Origin (ORG.ASX) and AGL Energy (AGL.ASX), both of which have proven to be rather painful experiences for the shareholder in recent years. Which brings us to the question, is it perhaps time to buy? Especially when considering the relative valuations of the businesses in both a historic context and comparison to the broader market.
Origin Energy (ORG.ASX)
The Origin business can be put into two categories, the first is energy retail while the second is generation. Both of these have faced significant headwinds in recent years. On the retailing front, much like the Telcos, the competitive pressures and decreasing cost margins have posed significant threats to the earnings of the sector overall. While Origin has historically managed to grow earnings since the initial demerger from Boral back in the early 2000s, this was primarily through the acquisition of previously state-owned entities and a regulatory environment characterised by privatisation. With the domestic market now consolidated and about 20% of market share, the business faces saturation and a dilemma in growing its top line. The much needed catalyst came in the form of upstream and the arguably more profitable generation. It has developed the Australia Pacific LNG Project (APLNG) – a joint venture between Origin (37.5%), ConocoPhillips (37.5%) and Sinopec (25%) – in the Bowen and Surat basins. Although this remains the likely future driver of growth, spot markets continue to be volatile and, with increasing regulatory intervention and a confrontational attitude given domestic gas shortages, the far more lucrative export business has a way to go.
To sum up the critical points, ORG operates in a complex and competitive environment that 1) has seen diminishing margins across its core retailing business; and 2) in the segment that is key to providing future earnings growth, is seeing volatility and an increasingly hostile policy environment. So with that context in mind, let’s dive into the numbers
Author: Sid Ruttala
Management has confirmed that FY22 is a trough in earnings and should see some recovery. Within the generation business, higher than expected input costs, including coal and gas prices, have hurt the bottom-line (i.e. higher than anticipated fuel costs) wish was compounded by substantially lower wholesale prices (i.e. Covid related). EBIDTA is likely to come in at $450-600m AUD (note the wide range) though FY23 is likely to see a rebound assuming that wholesale prices stabilise. This result is also somewhat mitigated by the APLNG which in fact benefits, as could be expected by higher spot prices, with sales volume coming in slightly higher than expectations although I personally continue to be disappointed at the realised price at $55USD/bbl. Conservative but nevertheless could’ve been much better. The business’ Net Debt/EBITDA, even taking into consideration the APLNG dividends at 3.4x, continues to cause concern (a hangover from the acquisitive phase).
On the positive side, much of the negative has been offset by consistent business customer wins, strong EBIDTA to cash conversion and stable customer account numbers (a vital metric in our opinion). Looking at CAPEX, the business has been delivering with APLNG CAPEX at record lows and a dividend to ORG of approx. $265m AUD.
So, with all that in mind, why do we think this is a buy?
Simply put, the price and defensive attributes of the business make it a great allocation for the portfolio. Firstly, the energy retailing business, despite its low margins, has defensive attributes and scale matters. With a relatively stable market share (i.e. stable customer account numbers), this becomes a cost-out story with future growth predicated on upstream. Moreover, in comparison with its other significant competitors, ORG is (comparatively) not as encumbered with legacy coal assets, which makes it more palatable for institutional investors. Based on current share prices, it implies a dividend yield of 4.4% with further upside assuming payout ratios of more than 50%. If the company should meet its own targets, it implies that shareholders investing now should have locked in a close to 8% yield by 2025.
Red Flags & Risks: The wholesale electricity business continues to see margin pressures and volatility along with further risks in the policy environment. Though much of the noise has subsided, the possibility of export restrictions being placed on local producers cannot be ruled out. We are also likely to see continued impairments across its legacy generation assets.
My Expectations: A patience game and dividend growth story. My expectations are a fair value target of $6.50 AUD per share assuming opex reduction targets are met as well as continued recovery in the wholesale markets, which we see as improving over the medium to longer term.
Dividend Yield: 4.1%, assuming a price 4.37 AUD
AGL Energy (AGL.ASX)
AGL has certainly been on shareholder’s minds in recent years and not for the right reasons. The share price continues to be in free fall and the CEO’s departure in the middle of a critical juncture with the demerger of the business certainly does not help the optics. Like ORG, AGL has been hit across its retail divisions and by downward pressure on wholesale prices. Add to that increased uncertainty around its coal assets and the embattled company has what might be termed a perfect storm. Nevertheless, it has been on our watchlist, not least given the relative valuation (and this is even taking into account the broader discount that the energy sector seems to be trading at across the ASX).
Similar to ORG, AGL’s growth has historically been underpinned by acquisition as opposed to organic (the most recent acquisition being Click Energy). However, with the market stabilising, much will be contingent upon management delivering upon cost reductions and the handling of legacy generation assets. AGL has relied upon low-cost coal to date and, unlike ORG, relies upon those assets for a disproportionate amount of its generation (84% coal based). While the proposed demerger of coal assets from the retail and renewables division should theoretically benefit from a management and strategy perspective, there is a great possibility that it may in fact be value destructive given the risk of duplication.
Continued regulatory and policy uncertainty potentially make it an investment for the more adventurous. Under current estimates, we are likely to continue seeing declines in earnings over the next 24 months (approx. 7% p.a.) and the shake up of the C-Suite at such a critical juncture does not help the situation.
Examining the numbers, underlying EBITDA of $926m, representing a decline of 13% with NPAT down even further by 27%, the disconnect being higher depreciation expense and impairments. On the positive, what has been pleasing is that the business has continued to grow the total number of services to customers by 246,000 to 4.2m and has seen an increasing take up of its broadband and carbon-neutral products. So, having said all that, why do we think it is worth considering as a buy?
Simply put, the price. This is a classic reflation trade as we see stabilisation in the wholesale market coming out of Covid. In addition, and despite the negative numbers which are likely to continue into the immediate future, the market may have overreacted with the share price declining close to 60% over the last twelve months. Within the domestic market we continue to see a space for coal at least in the short-term and, given the current pipeline of renewables, we are likely to see choppy supply-demand numbers. Assuming even the worst case scenario, our fair value estimate stands at $12 AUD per share.
What has been particularly concerning however is the lack of management’s clarity around future strategy and even the payout ratios. They initially announce a 100% of NPAT payout ratio and then reneging by going to 75% and announcing a DRP fully underwritten which effectively raises $300m AUD in equity. Poor form, especially when one considers that they had previously embarked in share buybacks at $19 AUD per share.
Red Flags & Risks: On top of the existing messiness within domestic energy markets, and as mentioned, much of the risk comes from uncertainty around management of the business at such a critical juncture. With coal assets so unloved we could very well see further shareholder dilution with traditional banking institutions unwilling or unable to underwrite further developments.
My Expectations: We will probably see the security bottoming out at $7 AUD per share before consolidating. This implies a P/E of less than 10x and a dividend yield of 9.11%. We are likely to see this stabilise and much will be contingent upon management realising their OPEX reduction targets (not helped by the changes in management). It would, in our view, be unfortunate for the current chairman and interim CEO to continue on in those roles, we would prefer an outsider with a fresh perspective come onboard.Dividend Yield: 8.57% assuming a share price of 7.44 AUD and a normalisation in payout ratios back to 75%.
Final Thoughts – Both ORG and AGL remain cheap, AGL more so. For us, we continue to own ORG with AGL being on the watchlist (we would need to see a clear strategy from management and, more importantly, a leader).
This week we will be writing about two of the heavyweights on the NASDAQ, Amazon (AMZN.NASDAQ) and Alphabet (GOOGL.NASDAQ). While these stocks are always in the headlines, we believe there are parts of these businesses that are stuck in the shadow of their parent company and aren’t getting the attention or credit they deserve and, as such, any value when it comes to the market. GOOGL and AMZN are best known for their search engines and marketplaces but what people may not see is that they are both making transformational advancements in the autonomous vehicle industry.
Author: Adam Wolf
Autonomous Vehicles
Autonomy or automation has been pulled forward several years due to the pandemic and yet it remains an area the media largely ignores, similar to electrification about eighteen months ago. The technology is ready, has been developed and undergone plenty of trials (for those watching the Olympics, autonomous vehicles are being used to transport the athletes within the village). And now there are catalysts for change with, amongst others, labour shortages and efficiency improvements. Additionally, 94% of US car crashes are caused by human error so by removing these mistakes through fully autonomous vehicles, lives can be saved. There are still a lot of boxes to tick before autonomous vehicles are used at scale though. This includes things like road-side infrastructure connectivity (a space we are actively investing in) as well as some minor obstacles such as weather conditions but we believe autonomous vehicles will be a multi-trillion dollar industry and, just as people refused to see motor cars being widespread in the early days of the 1900s, we are seeing a similar situation with autonomous vehicles.
Alphabet (GOOGL.NASDAQ)
Google (we’ll use “Google” for familiarity’s sake) has been a strong performing stock recently (up 50+% YTD). The company makes most of its money from search and display ads and the like but other investments, such as YouTube and cloud tech which are growing at fast rates, are starting to drive profits too. While Google is one of the most covered stocks on the market, this is the same market that still isn’t giving them proper credit for subsidiaries like YouTube. Google at its core is starting to prioritise investments for long term value creation and they are accordingly starting to invest heavily in AI. The segment of Google that we believe is a real hidden gem, obscured by the shadow cast by the behemoth that is Google as a whole, is Waymo.
YouTube
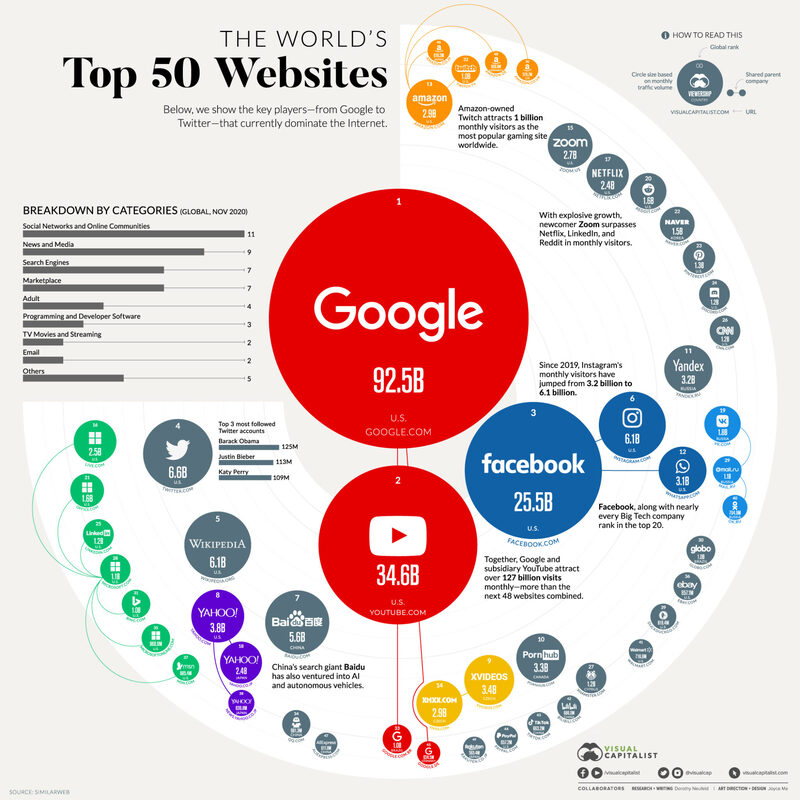
Quickly touching on YouTube, Google bought the company in 2006 for $1.65bn USD. Since then, YouTube has become the second most popular website in the world. That $1.65bn is probably a small figure compared to what YouTube would attract if it were spun off today. YouTube is a unique asset in the sense that their business model is extremely tough to copy and anyone that tries to compete with YouTube can simply be copied or absorbed. Another feature of YouTube is that they can scale their service (add more users) and hardly increase their costs in doing so. The key revenue drivers for YouTube are its premium subscription service and Google Ads. YouTube-displayed ads currently account for around 10% of Google’s revenue.
Source: Visual Capitalist
Waymo
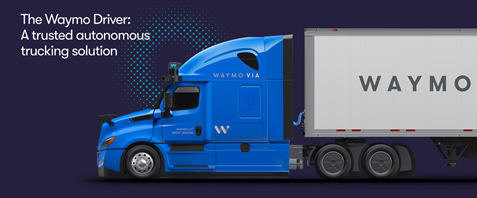
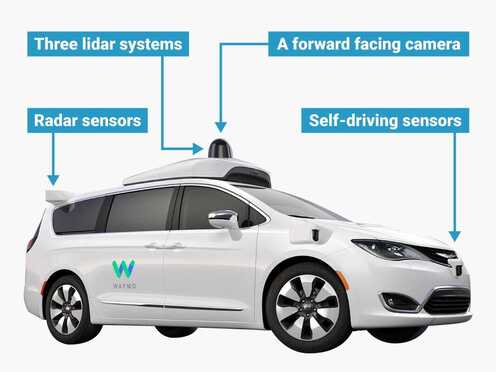
Waymo was first founded in 2009 as “Google’s self driving car project”. Waymo have developed the software that operates autonomous vehicles using, amongst other things, lidar systems and sensors. Since launch they have already achieved Level 4 autonomy. This means they can operate vehicles with full autonomy but with a few restrictions, such as weather and road conditions. Last year they launched Waymo One, a fully driverless ride-hailing service. This is an operation that means anyone in Phoenix with the Waymo app can hail a fully autonomous ride at the tap of a button. Competing with the Ubers and taxis of the world isn’t all Waymo is doing, they currently have a few segments to their business. They aren’t just looking to drive people, they are also looking to grab a piece of the commercial market through trucking, postal services and pizza delivery. Waymo was an early mover in the driverless car space and has made a lot of progress already having tested autonomous vehicles in 25 cities across the US. More recently, Waymo launched Waymo Via which is developing an autonomous trucking solution (directly addressing a pressing issue in the current environment given the US’ truck driver shortage).
Source: Waymo
Waymo recently raised $2.5bn USD to further develop their technology and we think a lot of this will be used to progress Waymo Via. Waymo has also already established partnerships with Volvo, Nissan and Renault to name a few and these partnerships will be used to test how autonomous vehicles will be used in Japan and France.
Source: Business Insider
Context: Aurora
There has recently been news of fellow autonomous tech company Aurora going public via a SPAC deal at a valuation of around $11bn. They are a fair way behind Waymo in terms of their capabilities (e.g. they haven’t reached Level 4 autonomy yet) and they have no existing operations, having only been founded in 2017. These kinds of deals show that the sector is beginning to heat up while also highlighting what Waymo could be worth as a stand-alone company. Given how far behind Aurora is and the extent of Waymo’s existing operations, it is certainly well north of $11bn.
Amazon (AMZN.NASDAQ)
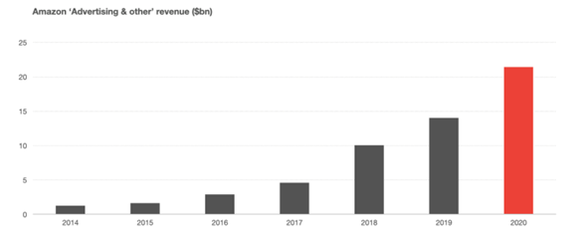
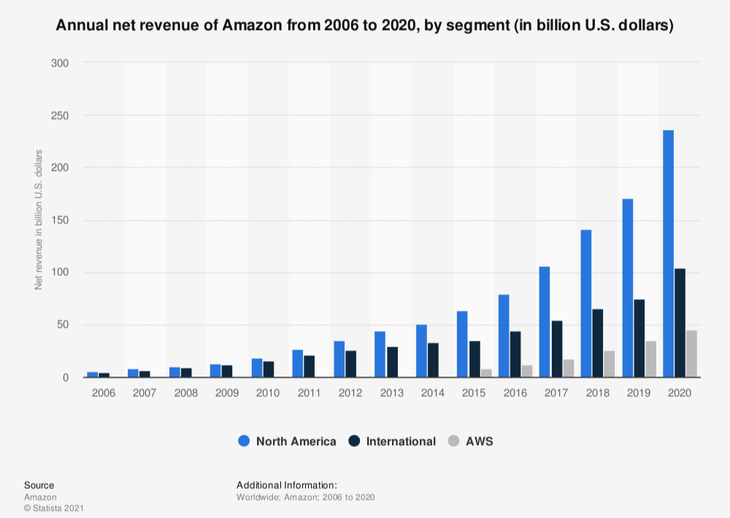
Jeff Bezos recently rocketed off into space but Amazon’s stock price has stayed grounded the past year while the S&P has climbed higher and, over that timeframe, Amazon has continued to grow and innovate. Amazon is essentially a bundle of lots of different businesses with different margins, their profits are being driven by Amazon Web Services (AWS), but they also have other segments that are emerging like their advertising business. Amazon’s ‘Advertising & other’ (see below) revenue segment contains a lot of the revenues generated from their subsidiaries and we believe portions of these investments are misunderstood and aren’t priced in.
Source: Benedict Evans, Feb 2021
Automation
Looking at Amazon, there is a huge opportunity to inject further automation (not entirely in the mobility sense either) into their business model, notably the e-commerce side. It will be a step function change in terms of their cost structure. Logistics is by far Amazon’s biggest expense. Any opportunity they get to automate anything, whether it’s picking within the warehouse, moving a package from warehouse to warehouse with autonomous systems, or anything along that front is going to be a step function change in their operating profit. We think that this development is something that the market is not paying attention to whatsoever. And that’s just one aspect of the business.
AWS
The other big aspect of the business is obviously AWS, their profit centre. AWS is providing on-demand cloud computing platforms and APIs to individuals, companies, and governments, on a metered pay-as-you-go basis They’re not getting credit for this business whatsoever and, in terms of it fitting within our mobility theme, Cloud solutions/technology in general is something that fits perfectly within the first pillar of sharing and connectivity, we consider it the network layer. Cloud infrastructure is critical, particularly as we talk about edge computing, and having vehicle to vehicle, vehicle to infrastructure, basically just low latency connections. As Cloud scales, Amazon is obviously the leader there. All of the Cloud players – Amazon, Microsoft, and Google – have autonomous efforts. They know that autonomy is going to be huge and, simply put, having Cloud in house when you also have autonomy is a significant advantage.
Source: Statista
Zoox
In 2020 Amazon acquired Zoox for approx. $1.3bn USD. Zoox is an autonomous vehicle company looking to reinvent personal transportation. Like Waymo, Zoox will provide mobility as a service in dense urban environments; they will handle the driving, charging, maintenance and upgrades for their fleet of vehicles. Riders will simply pay for the service. This is a key difference between these new autonomous solutions and the Ubers of the world. Amazon is a unique and growing company that uses its vast platform to disrupt any new business it enters; we saw what happened when Amazon bought Whole Foods, Walmart and Target took a big hit in market value. We can see them having the same impact in the autonomous driving industry. Zoox is something Amazon is getting negligible credit for. And that’s understandable. They’re a bit further behind in terms of the competition. But in terms of the opportunity set, it’s a massive one. And that’s not to mention anything else that Amazon has going on whether it’s pharmaceutical or Amazon Go, which is basically automation and something that we believe they’re going to probably license out over time and it will become a very high margin product.
Regulation
A risk that is commonly spoken about regarding the FAANG stocks is the perceived regulatory risk. There has been talk that regulators will step in and break up the Amazon’s into smaller entities, such as spinning off the AWS business, but so far it’s been a losing battle for lawmakers as they haven’t been able to force any of these changes yet. However, if Amazon or Google were to be broken up, we believe they would become more valuable as the market prices the spun off entities properly. It is relatively common for excellent companies with many different segments to be undervalued.
Thesis
Both Google and Amazon are pioneers in their respective fields but we believe these businesses are misunderstood and the market isn’t giving them enough value for their subsidiaries that would be worth a lot more as stand alone businesses. Both AMZN and GOOGL are investing in long term plays that create value for shareholders, e.g. AWS and YouTube, but we think their autonomous vehicle investments, Waymo and Zoox, may be their best ones yet.
Rewinding back to the early 2000s, Amazon was spending hundreds of millions of dollars on capex to build out AWS for years. It was a massive expense, very capital intensive and a huge drag on free cash flow. All the corporates, their potential competitors, thought they were crazy. They didn’t understand it, so they ignored it. And so, for years, they allowed AWS to take a huge lead in a multi hundred billion dollar plus market with literally no competition. Fast forward to today and it’s a business probably worth about a trillion dollars and Amazon is the clear leader of the pack. That’s how we expect these autonomous units to be viewed, big cash drags that are given negative to no value. Today, Google is given no value for Waymo. One day the market will catch up and quickly recognise how transformational it is.
Disclaimer: AMZN & GOOGL are held as a long positions in TAMIM’s Global Mobility portfolio. The TAMIM Global Mobility strategy seeks to to capitalise on the ongoing $7 trillion autonomous and electric vehicle revolution.
Ahead of his webinar next week (register here), Robert Swift takes a brief look at the state of the world and what it means for the investors out there.
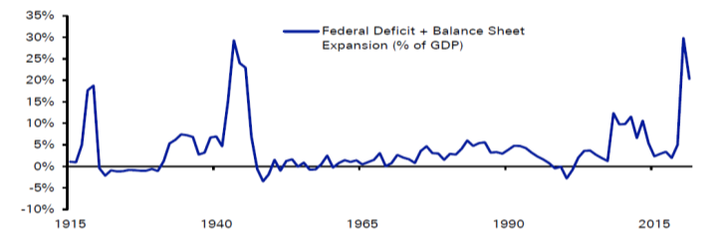
Instead of some precautionary monetary tightening, for which we pleaded, we got an additional stimulative policy aka a large pro cyclical fiscal boost of up to $6 trillion (Yes, TRILLION) some of which may go on productivity enhancing investment. The combination of fiscal and monetary stimulus in the USA is now at a level not seen since WW2.
US fiscal and monetary policy has only been as coordinated during WWII
Source: GFD, Deutsche Bank
Not surprisingly this is having inflationary consequences and these are now getting harder to conceal from the ‘great unwashed’ with hedonic pricing and ‘transitory’ arguments. The more geeky should also concern themselves about how big the output gap actually is in the USA. Large output gaps tend to mean one can be relaxed about inflation in periods of easy money and loose fiscal policy and vice versa. Those in favour of this extraordinary stimulus argue the output gap is large. Recent studies from the Congressional Budget Office would indicate the opposite and that we should be concerned if we don’t change course soon by tightening money. Essentially there is a lot less room to manoeuvre; time is running out if we wish to avoid inflation or stagflation.
Inflation is unlikely to be transitory and we have invested as such. Add in temporary(?) supply chain problems from Covid, permanent supply chain changes from National Industrial Policies (aka a dismantling of the global trade just in time system), and the supply side reductions caused by the “Green Revolution” and now hot weather, wet weather and not enough wet weather, and we will see the commodity complex, both hard and soft, on a strong upward trend. Wages are going up too and so we are looking at quite a well-entrenched bout of inflation and inflationary expectations. This will have consequences for companies with stretched balance sheets, and for those companies who provide goods and services with elasticity of demand and high fixed costs.
Companies can either take the inflation in input prices as a hit on margins and keep retail prices where they are, and/or they can raise retail prices and try to preserve margins. We believe that the latter is more likely. Prepare for persistent inflation. If we’re wrong and it’s the former, prepare for lower returns and profit growth from equities. Neither is particularly great for equity markets and the discount rates that will be applied to future earnings and dividends.
Consequently one needs to invest in companies with quality balance sheets, low elasticity of demand for their products, and not in danger of being targeted for regulation.
The Biden administration has recently introduced a potential 3rd policy tool in its attempt to generate sustainable economic growth, where sustainable means a reduction in wealth inequality, wage growth relative to profit growth, and a reduction in corporate pricing and employment power (monopolies and monopsonies). This policy tool is the use of anti-trust legislation to break up ‘Big Tech’ and more recently an Executive Order directed at the rail roads, and has been accompanied by the appointment of Big Tech critics to the Federal Trade Commission which oversees policy toward protecting consumers.
The FTC is a bipartisan federal agency with a unique dual mission to protect consumers and promote competition
While the USA dithers about monopoly power and is “putting out the (inflation) fire with (fiscal) gasoline”, elsewhere in the world a set of policy makers is acting in a more orthodox manner by moving counter cyclically to reduce the build-up of inflationary expectations consequences; squeeze moral hazard out of its financial system; and prevent monopoly power from building early by applying regulatory pressure. Yes, and ironically, it’s the Chinese who seem to be doing what the “Imperialist Running Dogs” used to do? It is a topsy turvy world when the Chinese adopt the capitalist play book?.
Namely:-
Be countercyclical in monetary and fiscal policy – China 1 USA 0
Let owners of the risk capital be at risk – China 1 USA 0
Prevent state sponsored monopolies and encourage competition such that capitalism serves the consumer – China 1 USA 0
Some of the regulations seem somewhat draconian, capricious and counter-productive and we have been somewhat caught in our portfolios by the severity of the Chinese regulatory crackdown. We own Ali Baba (9988.HKG) and some collateral share price damage has been seen in other large Chinese dual-listed companies such as Ping An (601318.SHA, 2318.HKG). On the other hand we are underweight Tech in our global portfolios; own none of the likely targets of the FTC in the USA and so from a portfolio perspective are underweight this risk. Additionally and crucially, any increase in regulation is typically aimed at large companies and not smaller ones. As at end July, 6 USA stocks constituted about 25% of the market. We won’t get badly hit by any USA legislation against large “Tech”. Our portfolios have a substantial underweight position in the risk factor known as ‘Size’. Small is (once again) beautiful?
We will shortly be running a risk based analysis of the inflation protection properties of the listed infrastructure stock universe. There isn’t a lot of long term data on this and much of the promotion of listed infrastructure as an inflation hedge is opinion. Fair enough, but we’ll do an ex ante risk analysis of the properties of these stocks and publish shortly!
We would also suggest investors consider Asian and Japanese smaller companies. Inexpensive, improving governance, and operating in an environment of prudent macro-economic policy, we believe prospective returns look very good. We have managed a portfolio successfully for four years here and have many more years’ experience than that in Asian and Japanese equity markets.
This week we look at two more REIT’s, this time both US based. The first is a global footprint of industrial and logistics facilities, Prologis (PLD.NYSE), while the second focuses on self storage, Public Storage (PSA.NYSE).
Prologis (PLD.NYSE)
Prologis is one way for investors to gain access to a global footprint of industrial and logistics facilities with a focus on the consumption side of the equation (much like VGP from last week, it increasingly focuses on last-mile delivery). It is to date the largest industrial real estate company in the world, operating 995m square feet and $169bn USD under management. So, why Prologis? First, to give a little context, any portfolio that targets REIT’s and doesn’t have an allocation to this company would be similar to allocating to Australian Financial Services without an allocation towards CBA.
Importantly, despite its valuation premium (i.e. it now trades at a price approximately 30% above its pre-covid high or a P/E of 62x), we feel that management has demonstrated a consistent and enviable track record in not only creating value but also the ability to adapt with changing environments. Starting off in the early 80s with a $50,000 USD line of credit, the team has survived and expanded through market cycles, initially buying retail and commercial property to now becoming the largest industrial and logistics focused real estate company in the world. The geographic footprint now includes North America, Latin America, Europe and, importantly, a fast growing Asian market. As with any stock, we like value-add created in adjacent categories and PLD continues to deliver services through its workforce solutions (i.e. logistics training and recruitment) in addition to a ventures division. Their strategy has paid off to date, annualising an Internal Rate of Return (IRR) of 20% over the past 19 years.
Author: Sid Ruttala
Returning once again to the idea of a reflation trade, there are three components of the balance sheet that are attractive from an investment perspective:
Their focus on e-commerce with Amazon being by far their biggest customer;
the geographic footprint; and
debt composition.
On the first point, this is an attractive way to get exposure to a secular growth story without paying the same multiples (i.e. Amazon multiples). The second, the geographic diversification ensures substantial exposure to higher growth markets, with Asia being on par with the US in nominal value. Finally on the third point, the vast majority of their debt (59%) is Euro and Yen denominated two economic blocs that are likely to be laggards in rate normalisation compared to the US.
With that context, let’s quickly run through the numbers. Revenue on a TTM (Trailing Twelve Month) stands at a stellar $4.49bn USD. They have a 96% occupancy rate and a net income of $1.54bn USD with an annualised growth rate in AUM of about 14% p.a. Over the past decade, Price to Book stands at 2.98.
My Expectations: A great long-term staple for the portfolio, though the price as it currently stands represents a price-sales ratio of 21.98 (much more relevant in a growth context). Our view is to buy over the trailing average and sequence in at circa. 15x for the more conservative or around 17x for the reasonable, more likely given the rate environment. It is nevertheless a hold for me over the long-term (broadly speaking, buy the dips or set and forget).
Dividend Yield: 1.87% with expectations of continued double digit growth (circa. 15% p.a.).
Public Storage (PSA.NYSE)
Much like Prologis, Public Storage represents another story of American entrepreneurship. Simply put, it is in the business of self-storage across the US (where it is the market leader), Canada and Europe. Some of you may have come across the company if you have a penchant for American television and watched the series Storage Wars, where contents of a storage unit are put up for sale, practically sight unseen, via auction for failure to pay rent.
The business started with a simple concept. Allowing consumers to pay for square footage to store belongings and doing so at effectively the same rate as commercial or residential space but with a cost layout low enough to break-even at 35% capacity. Since the initial investment of $50,000 USD in 1972, and through the use of RELP (Real Estate Limited Partnerships), PSA now owns and operates 2500 self-storage facilities across 28 states or 1m square feet in real estate as well as exposure to the European and Canadian markets through equity investments (Shurgard Europe).
So, why do we like it?
This is a rather simple business and, while it may not be headline grabbing, there is a reasonable business case to be made for looking at self-storage as a viable investment given the significantly lower capex required and the demographic shifts occurring. Let’s start with the percentage of the broader population that uses self-storage. In the US, starting at 3% in 1980, the number stands at 9% today. With an increasingly aging population along with immigration within the 30-60 demographic, who remain the primary users for the business, we are likely to see continued organic growth across the sub-industry. Moreover, in comparison to her peers, Public Storage not only has scale across the US market but also brand recognition in what is a relatively consolidated market. To give some context to the actual numbers underlying the business, it has a market leading NOI (Net Operating Income) Margin at 75.9% compared to the nearest competitor, Extra Space, at 71.3%.
Going back to reflation (sensing a theme here?), the firm has continued to take advantage of the low rates of financing its debt at a blended rate of 1.9% with an 80-20 split in USD and EU (we would have preferred to see more Euro) and, more importantly, 86% fixed with maturities of 16.6 years (if we see CPI keep to our expectations then this is a great transfer of wealth mechanism from debt holders to equity holders). Debt stands at $5bn and additional acquisitions and developments continue to be financed with substantial injections from retained free cash flow. 2021 has seen them commit to higher rates of acquisition, $2.1bn USD, and there is over $700m USD in the development pipeline. This second aspect bodes well for solidifying their market leadership and sustaining earnings growth well into the future (in addition to increasing pricing power).
Getting to the numbers, revenue on a TTM (Trailing Twelve Month) stands at a stellar $2.97bn USD with a net income of $1.17bn USD. P/E stands at 46.45 and EPS at $6.88 USD/share.
My Expectations: A great business to own over a longer time horizon, much like PLD. They are operating in a secular growth story and are a reasonable reflation trade. The business’ development pipeline and acquisition binge should be reflected in future earnings growth as well as increased pricing power. There is a premium built in to the current valuation but it is worth paying given their market leadership and demonstrable track record. A long term hold for me.
Dividend Yield: 2.55%
A slightly lower result given the acquisitions over the past 24 months but, going forward, the payout should revise back to 2019 levels. Assuming this to be the case, 3.55% from CY22 onwards and 10% CAGR estimate from there (based on historic context).
Disclaimer: Both stocks are held in the G-REIT segment of TAMIM’s Listed Property portfolio.
This week we look at two more REIT’s, this time both EU based. The first is Frankfurt listed, LEG Immobilien (LEG.FWB), while the second is dual-listed, VGP Group NV (VGP.BR).
LEG Immobilien (LEG.FWB)
LEG Immobilien is a pure-play residential REIT. Created in 1970 as part of a push to develop urban areas and increase small-scale settlements in the state of NRW (North-Rhine Westphalia), it continued to grow its mandate to include the development of fallow land in the 80s and was privatised in 2008 (i.e. bought out by a consortium of private equity investors including Goldman Sachs, Whitehall and Perry Luxco). Since privatisation, the business has expanded and diversified geographically across the West German Federal States to now include close to 145,000 properties with and more than 400,000 tenants. The business listed in 2013.
What has been unique about this particular evolution from state-owned enterprise to private has been the businesses ability to use economies of scale to target particular niches, including smaller-scale developments than would otherwise be impossible as well as value-add services including partnerships with Vodafone for multimedia, B&O for maintenance and various other utilities providers.
Author: Sid Ruttala
So, why do we like this proposition and what exactly is attractive about it? After all, it’s not every day that Australian investors get pitched residential property plays on the other side of the planet. Let us explain it as simply as we can. If we consider the return of investment in property, there are simply two aspects to it in my view; 1) the headline cash rate, which has the multiple impact of determining capital growth as well as debt servicing costs; and 2) rental growth as well as the ability to service said rents. On both of these aspects Germany ticks the boxes, depending on where you look though main cities such as Berlin do tend to have rent controls.
On the first point, the fantastic thing about having a single bloc currency is the asymmetry that is created. The ECB, by having to cater to a diverse economy, is somewhat curtailed in its ability to normalise rates than would otherwise be the case. For example, the headline interest rate targets would have to take into account inflation and inflation expectations across the EU (as opposed to any single national polity), so should we see a better recovery rate across Germany (as has been the case) especially in comparison to the southern states then we are not likely to see this reflected in the monetary policy (and hence cost of capital). Importantly, Germany is able to maintain a current account surplus due to her exports being more attractive than would otherwise be the case in the absence of a single currency (i.e. a free floating Deutsche Mark would arguably be a lot higher in relation to say the Italian Lira). This helps with regards to the second aspect of what matters to the property investor, rental yields and the ability of tenants to service said rent (given that close to 20% of the workforce is employed in the manufacturing industry and 47% of the nation’s output is export dominated). Germany also remains one of the few outliers among the OECD to pass increases to the minimum wage during the depth of Covid-19, despite push-back. This helps given that residential plays such as LEG Immobilien focuses on the mid-tier and lower socioeconomic stratas for tenants.
With that context out of the way, let’s get down to the numbers for LEG. In short, revenue at TTM (Trailing Twelve Months) currently stands at approximately €2.08bn, WALE of 7.5 years, LVR of 37.7% with a market cap of €8.3bn. In terms of medium term catalysts, 75% of the current portfolio, or 25,000 additional units, are set to come off rent control with significant upside when compared with market values. Over the next five years the theoretical upside to this is about 38% of the current base. Importantly for the cynics amongst, the nature of the business ensures that outsized events such as a pandemic don’t materially impact the business with vacancies only slightly increasing (the German social safety net and subsidies ensure that the business gets paid).
Sticking with our reflation thematic, the business has issued €823m in debt to add to its war chest for growth. This was done at an attractive 0.40% p.a. coupon with a duration of 8 years. Importantly, the debt is senior unsecured convertible notes. The strike being €155.25 (or a about 20% premium to the last traded price), this represents about 5% of the float.
My Expectations: A great reflation trade and bond substitute. In the absence of inflation (just in case I’m wrong), there are significant escalations already built in through the expiration of rent-control terms. Significantly, in the absence of inflation, the continued low yields across the EU and the negative yields on the 10-year Bund should see capital growth. If I am right on inflation, then it can act as a hedge given the unique circumstances of the German residential property market and the low fixed debt servicing costs.
Dividend Yield: 3% (historic growth of 11.8% p.a.) and, in our view, there is no reason for this to be at risk. The trust has a payout ratio of 70%.
VGP Group NV (VGP.BR)
VGP Group is another mid-cap REIT we remain quite bullish on given their existing partnerships and the space they operate in. Simply put, it is an owner, developer and operator of prime logistics/light industrial parks. Many of the readership, we feel certain, have at the very least heard of the tremendous strain that has been put across supply chains globally as a result of Covid-19. It has created a clear catalyst for rethinking supply chains and re-localising infrastructure. VGP’s geographic footprint is pan-Europe, including the Baltics, Germany, Spain and Italy. Their clients are almost entirely made up of blue chip companies such as Volkswagen, Amazon, Nagel and DHL with the advent and maturity of online retail acting as a tailwind.
For the more ESG oriented amongst you, the business has a 0-emissions target by 2025 (i.e. this includes both Scope 1 and Scope 2). For those of you not so worried, it should nevertheless make financial sense given the appetite and institutional flows that such a strategy warrants (hence a stronger multiple).
Looking at the numbers quickly, 99.6% occupancy with a WAULT (Weighted Average Unexpired Lease Term) of around 8.3 years (a more apt metric to use with regards to multi-tenant industrial assets). Moreover, what is rather more interesting in our view are the significant catalysts in terms of a 88.6% pre-let development pipeline and a strategy to focus on last-mile delivery (and the additional value add services that would bring to the table). Management certainly seems to be aggressive in its outlook, with the land bank reaching all-time highs at a 21% p.a. CAGR over the past five years and 22.2% p.a. CAGR in gross lettable space. Importantly, the development side of the business remains attractive with the JV model allowing the business, in conjunction with Allianz Real Estate, to develop and manage the assets while de-risking by having the JV partner buy out the assets at market value over a sequential period. To date, the company has spent €1.97bn in Capex with net cash inflow from divestments over the period equating to €1.57bn. To explain this more succinctly, they have the opportunity to grow their own portfolio over the longer term horizon while also taking part in larger scale developments than would otherwise be the case.
Risk wise, net gearing stands at a conservative 25.2% and EBIDTA stands at a stellar €407.33m, an attractive proposition given their market capitalisation of €3.7bn. On the negative side however, operating profit came in at €370m though this represents a substantial upside by about €167m from the corresponding calendar year. It was primarily driven by property revaluations and seemingly hides the increases in administration expenses (something we will certainly keep a keen eye on going forward).
My Expectations: Similar to Digital Realty (as we mentioned last week), this is a growth play more than a traditional REIT play. VGP is trading at a reasonable (in my view) premium given the categories and markets they operate in. Their footprint is predominantly western europe and significant growth is coming from their exposure to e-commerce as well as last mile delivery. A higher risk proposition than the likes of LEG or VICI, which we also wrote about last week, but a well run operation nevertheless.
Dividend Yield: 2.5%
Expecting double digit growth on a nominal basis over a five year time horizon given significant tailwinds both in the overall space and their specific development pipeline.
Disclaimer: Both stocks are held in the G-REIT segment of TAMIM’s Listed Property portfolio.


 VGP Group is another mid-cap REIT we remain quite bullish on given their existing partnerships and the space they operate in. Simply put, it is an owner, developer and operator of prime logistics/light industrial parks. Many of the readership, we feel certain, have at the very least heard of the tremendous strain that has been put across supply chains globally as a result of Covid-19. It has created a clear catalyst for rethinking supply chains and re-localising infrastructure. VGP’s geographic footprint is pan-Europe, including the Baltics, Germany, Spain and Italy. Their clients are almost entirely made up of blue chip companies such as Volkswagen, Amazon, Nagel and DHL with the advent and maturity of online retail acting as a tailwind.