This week we take a look at the factors contributing to the global food shortage and why prices will likely remain elevated for the foreseeable future.
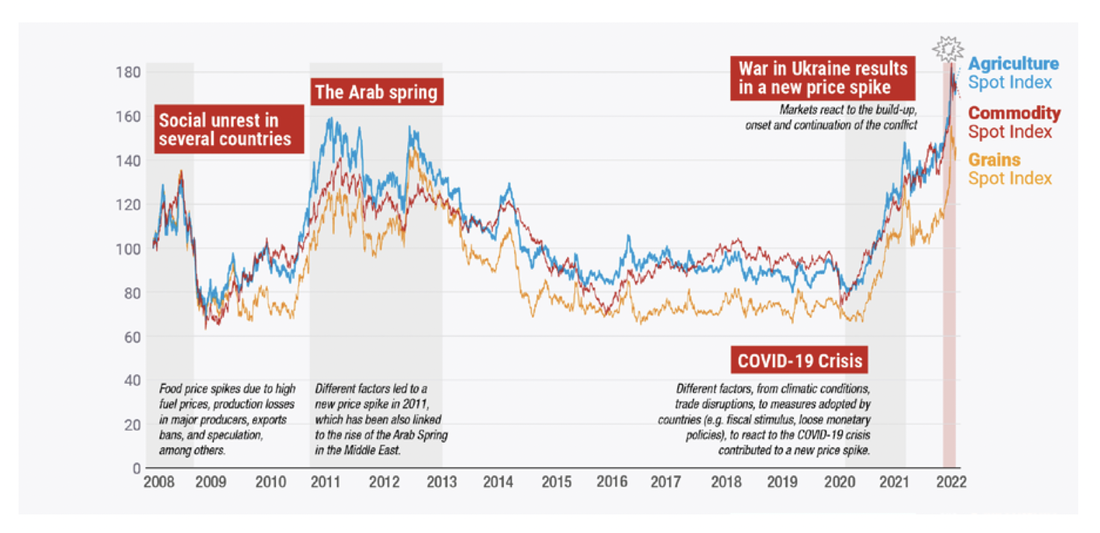
The Food and Agriculture Organization of the United Nations (FAO) Food Price Index – a global benchmark for food prices – is up 22.8% above the same corresponding month in 2021 due to a global agriculture supply shortage.
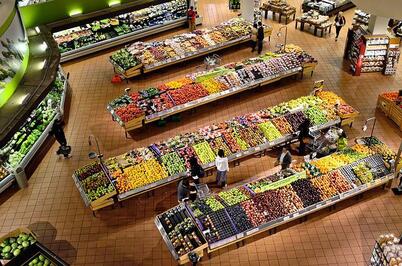
But you don’t need us to tell you that. A short stroll through the local fresh food section will give you a fair indication of the havoc. $12 lettuces. $17 green beans. $10 for a punnet of strawberries!
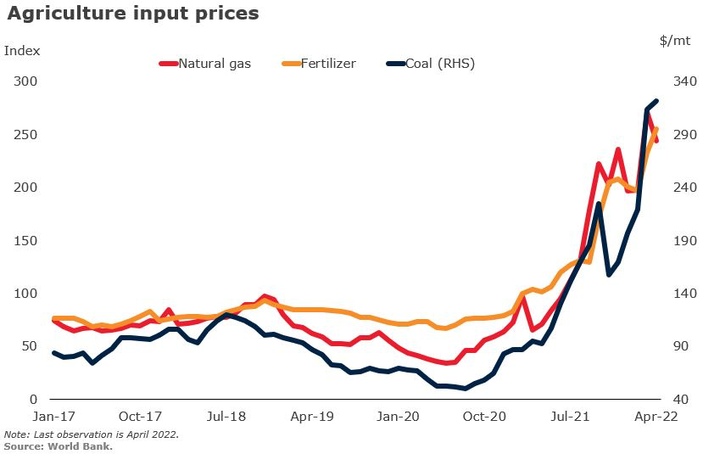
Food prices have been on the rise since late 2020, largely due to supply-side factors. Output by farmers has been hindered by the rising cost and availability of key inputs such as fertilisers and chemicals. This has been caused by a sharp increase in global energy prices that has made some fertiliser production uneconomical in addition to adding to fuel costs. The impacts are more pronounced in developing regions. In North America, fertiliser accounts for 10% of inputs costs, whereas in West Africa this increases to 56%.
Supply had been also been impacted by an unusual combination of weather events. La Niña reduced yields in the Southern Hemisphere leading to drier conditions. Flooding in China impacted rice harvests while heat waves in India limited wheat output. Add in pandemic-induced shipping bottlenecks in addition to labour constraints and the scene was set for a global supply shortage and thus more expensive food.
Then Russia invaded Ukraine, making a bad situation worse.
The two warring nations provide 28% of the world’s wheat and 69% of the global sunflower oil supply. Concerns over Russia blocking grain exports out of the Black Sea led to a price spike. Bans on Russia and Belarus, which account for 20% of fertiliser exports, have only worsened supply issues. Further sanctions by the EU and US on oil and gas have had a similar impact. With food security front and centre, nations such as India, Argentina and Malaysia have withheld exports to bolster domestic supply. The shortages have created a vicious cycle, with the United Nations estimating that 1.7bn people could fall into hunger and poverty.
Is the food shortage turning a corner?
The positive news is that prices look to be turning a corner. In May the FAO Food Price Index fell, albeit modestly, for the second consecutive month. Prices for fertiliser are off 30% while shipping rates and energy prices are also beginning to cool down. Certain food commodity prices, like fish and meat, remain elevated. But overall the old adage – the cure for higher prices is higher prices – is starting to take effect.
On Friday Russia withdrew from Snake Island, reopening shipping lanes for grain exports out of Ukraine. While only a small concession, this will put downwards pressure on wheat and other commodity prices.
Markets are also beginning to price a correction. The BetaShares Global Agriculture Companies ETF (FOOD.ASX) has fallen 18% in the past three months. Moreover, most futures curves are in backwardation (when the future price is lower than the current price), implying that abnormal food prices should revert over time.
Interestingly, this hasn’t quelled investor interest. Salmon producer Tassal Group (TGR.ASX) received a takeover bid last week. Fortescue Metals (FMG.ASX) founder Andrew Forrest also purchased a 17.4% stake in cattle and beef producer Australian Agricultural Company (AAC.ASX).
Agriculture is a cyclical industry, prone to peaks and troughs. It’s hard to imagine conditions getting any worse, but that doesn’t mean they won’t persist. Despite energy prices moderating, it will take time for decreases to flow through. Moreover, future-proofing supply chains will be a longer-term project given it takes two to five years to develop new fertiliser plants and oil refineries. Reducing dependency on Russia will also be no easy (or cheap) task. While markets are pricing in falling agriculture prices, it’s likely they will remain above historical levels for the time being.
Disclaimer: Tassal Group (TGR.ASX) and Fortescue Metals (FMG.ASX) are both currently held in TAMIM portfolios.
Inflation is at highs not seen in decades with Australians facing soaring prices for everything from fuel to energy, construction and food. So, what about Consumer Staples?
To combat cost of living pressures, curb inflation and wind back its pandemic related monetary support, the RBA lifted the cash rate for a third month in a row on Tuesday.
This latest 50 basis point rise takes the cash rate target to 1.35%, following a 25bps rise in May – the Reserve Bank’s first rate rise in eleven years – and a further 50bps lift in June.
The RBA concedes that there’s no quick fix to reining in inflation and it could take some time to get back down to the 2-3% target band from the 5.1% annual inflation rate seen in the March quarter.
RBA governor Philip Lowe says inflation could reach 7% by the end of the year before easing early next year. That said, Lowe also stated (last year) that interest rates would be maintained at ultra-low levels until at least 2024. So, it’s really all quite unknown.
What we do know is that higher food prices are hitting hip pockets at the supermarket.
The impact of the east coast flooding, combined with rising transport and fertiliser costs — due to the war in Ukraine and high fuel and labour costs, can be seen on supermarket shelves across the country.
And while we know this is bad news for shoppers, what does it mean for retailers?
When it comes to discretionary spending, rising inflation and subsequent interest rate rises have resulted in a pullback of spending — clearly negative for restaurants, cafes, and retailers of higher priced goods and services.
On the other hand, Consumer Staples — and supermarkets in particular — are known to benefit in times of high inflation.
As consumers stay in and eat at home, supermarkets including Woolworths (WOW.ASX) and Coles (COL.ASX) – which take two-third of Australia’s grocery sales – as well as Metcash (MTS.ASX; supplier to IGA, Foodworks and Drakes Supermarket) are experiencing increased sales.
Each of these businesses reported solid results for the last quarter thanks to higher in-home consumption and rising food inflation.
As they dominate such a large share of the market, these retailers have no trouble passing on higher costs from manufacturers, who are facing higher production costs themselves.
Further, since these supermarkets are not as affected by higher costs they can better compete on price as compared to their smaller competitors.
Coles and Woolworths have raised prices in response to “rising supply chain cost pressures”, according to research by UBS. Woolworths lifted prices by 4.3% in the March quarter, compared to 1.4% in the previous quarter. At Coles, food prices were 3.2% higher in the three months to 30 March after rising 1% in the December quarter.
Coles reported that March quarter sales at its Supermarkets division saw a near +4% jump from last year. Woolworths, meanwhile, saw a +4.4% jump in food sales from a year earlier.
As for Metcash, it says nearly two-thirds of its suppliers have raised prices. But with the company recording record sales growth over the full year to 30 April (revenue up +6.4%, including particularly strong sales in the more recent quarter), it appears that those costs have also been passed on to shoppers.
Other Consumer Staples businesses, including large manufacturers of food, beverages and household items, also tend to do well in times of high inflation. This includes primary producers and agricultural businesses such as GrainCorp (GNC.ASX), Elders (ELD.ASX), and Costa Group (CGC.ASX). These names have each proved to be robust performers in recent months amid the wider market pain.
And while their share prices have suffered in recent months, JB Hi-Fi (JBH.ASX) and Wesfarmers (WES.ASX), with its Bunnings and Kmart stores, could also perform relatively well in this ongoing inflationary environment. While they are, strictly speaking, Consumer Discretionary businesses, their everyday electronics and home improvement products can more or less be considered staples.
Wesfarmers CEO Rob Scott pointed to Kmart’s significant economies of scale and sourcing capabilities, viewing “inflation as an opportunity”, in which, “we are seeking to minimise cost pressures, deliver productivity improvements, while also competing for the share of wallet for more value-conscious consumers.”
It is in times like these that Consumer Staples should prove their worth in investors’ portfolios. And, as a defensive sector, dividends tend to be more sustainable and earnings less cyclical.
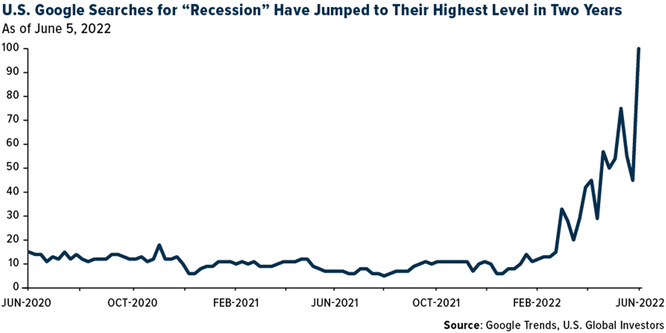
Recession. If you feel like this word is everywhere at the moment and everyone is talking about it, you would be right. Google searches for the term have spiked and every finance program and publication is covering it. So, let’s take a look.
So, what exactly is a recession?
There is no single definition of recession. The most common definition used in the media and textbooks is a ‘technical recession’, in which there have been two consecutive quarters of negative growth in real gross domestic product (GDP).
This is a somewhat arbitrary and abstract definition with the oxymoron of “negative growth” thrown in for fun. What tends to happen during a recession is the more important factor to consider.
Let’s start with what “real GDP” is. Real GDP is an inflation-adjusted measure that reflects the value of all goods and services produced by an economy in a given period of time. Two consecutive quarters in which real GDP decreases reflects an economy going backwards by producing fewer goods and services than before. Following this through, if fewer goods and services are being produced then this generally implies there is reduced demand for them. If businesses are experiencing less demand and therefore producing/supplying less, they require less labour to do so. This manifests in workers receiving fewer hours or being laid off and therefore higher underemployment and unemployment. This is a key characteristic of recessions alongside depressed levels of household spending and business investment.
What causes recessions?
Recessions have many different causes. For example, the 1974-75 recession was caused by, among other things, the global oil price shock which saw prices approximately quadruple. This resulted in significant increases in the cost of production, leading to increased prices and reduced consumer demand which fed back to reduced output.
Crude Oil Nominal Price (USD)
The 1991-92 recession (the recession Australia famously “had to have” and our last technical recession) was caused by high interest rates which were put in place to reduce speculative behaviour in the commercial property market and address high levels of inflation. Elevated interest rates (cash rate of 17.5% in 1990) flowed through to increased mortgage and business loan repayments which reduced consumer disposable income and business investment. This led to reduced demand in the economy for goods and services and thus reduced output.
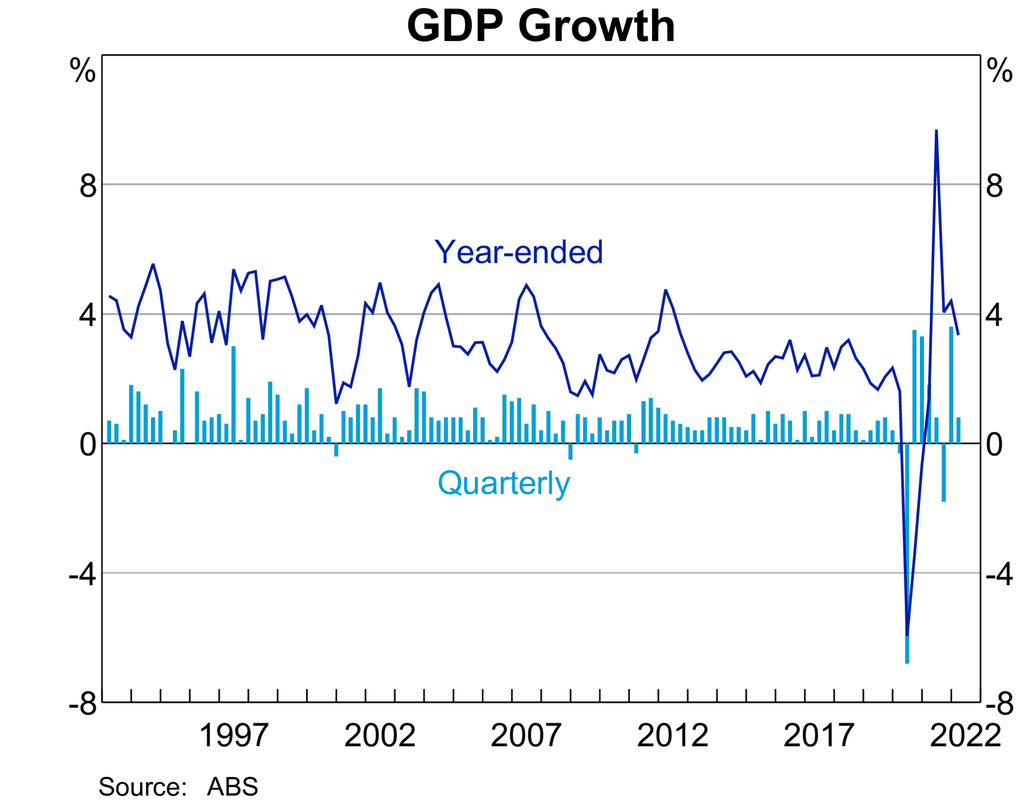
Finally, if we go by gross GDP, the most recent recession was caused by the arrival of Covid-19; gross GDP falling -0.3% and -7.0% respectively in the March and June 2020 quarters. Management of the public health crisis resulted in governments mandating suspension of large swathes of the economy for prolonged periods of time which prevented them from producing goods and services, leading to a reduction in output. In fact, the June 2020 quarter falling by -7% is the largest quarterly decline since records have been kept.
How long do they typically last?
Over time in Australia recessions have tended to last for shorter periods of time and be less severe as can be seen in the charts below. Many factors have contributed to this and the Australian economy’s increased resilience, including; avoiding recession during the Asian Financial Crisis of the late 90s; the tech wreck of the early 2000s and of course the Global Financial Crisis of 2008. Some of these factors include floating of the dollar (1983); banking sector reform; labour market reform and more transparent conduct of monetary policy.
Note the dates above.
How do they affect the share market?
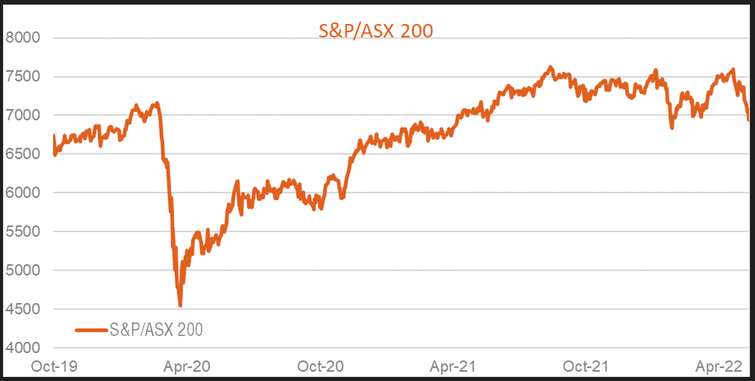
There is no sugar coating it, recessions are negative for the share market. Reduced demand leads to reduced profits and profitability. In turn this results in a decrease in share prices. As this tends to be economy wide, recessions are usually associated with bear markets, a term used to describe a decline in a share market index of at least 20% or more from its most recent peak.
Of course, within the overall decline there can be opportunities which see individual companies experience increasing share prices. The most important takeaway from the below charts tracking the share market across various recessions since 1875 is that it has always recovered to a new high subsequently. EVERY. SINGLE. TIME. Recessions are temporary; the wealth creating effect of the market is enduring.
So, are we headed for recession in 2022/2023?
The short answer? We don’t know and neither does anyone else for that matter. The pandemic resulted in disruptions to supply chains as manufacturing and transportation around the world was affected by differing government policies and restrictions in addition to workforce issues resulting from illness and/or fear of the virus.
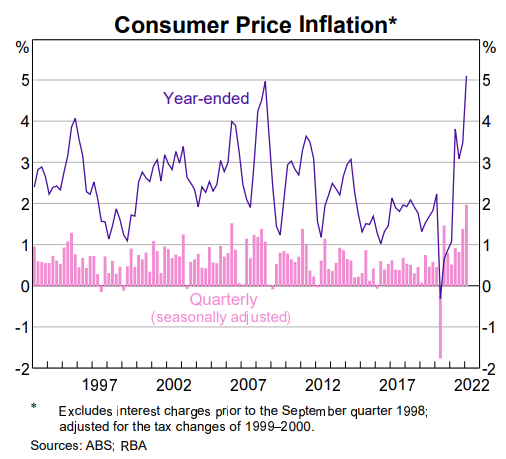
This had the expected effect of reducing the supply of goods and services. Simultaneously governments, particularly in the western world, unleashed a torrent of short-term direct stimulus which in many cases fully replaced (and them some) the income of workers affected by closure of parts of the economy. Longer term stimulus was also enacted, think the Home Builder Grant. The twin effects of reduced supply and increased demand have resulted in inflation not seen in decades (see below).
This has been exacerbated by the war in Ukraine which has led to higher energy prices. Central banks likely assumed that as the pandemic came under control, supply would normalise to meet demand and inflation would slow down. This has not proven to be the case and central banks around the world are now “behind the curve” in controlling inflation (USA 2% target vs 8% currently and Aust. 2-3% target vs 5% currently) resulting in them increasing interest rates aggressively. A war that affects global energy and food prices was the last thing needed. As mentioned above, high interest rates were partly the cause of the early 1990s recession and an oil price shock the cause of the 1970s recession. The fear is that history will repeat. Central banks are hopeful they can increase rates enough to dampen demand and reduce inflation without causing a recession (i.e. a soft landing).
Will they succeed? Only time will tell but history suggests they have their work cut out for them.
This week we look into the efficacy of the RBA raising interest rates to combat inflation and the subsequent impact on Australian property prices.
Australia’s penchant for property is about to be tested as the Reserve Bank of Australia (RBA) embarks on raising interest for the first time since 2009. In a rare interview with the national broadcaster, Governor Philip Lowe said the RBA would expedite the cash rate back to a normalised level of 2.5% to tame inflation. This came after the RBA shocked the market when it raised the cash rate by 50bps to 0.85% in June.
The notable shift in rhetoric from Lowe and the RBA is in stark contrast to the commentary given in October where it was implied rates wouldn’t rise until 2024. Now it seems the RBA will be unrelenting in its pursuit of demand destruction to bring inflation under control.
“…we will do what is necessary, we are not going to let inflation persist at these very high rates”
- Philip Lowe, June 22
All else equal, rising rates typically result in lower house prices. The ability of households and businesses to service existing or acquire new debt falls, leading to a reduction in demand for property.
ANZ expects national prices to fall 5% in 2022 and a further 10% in 2023. CBA forecasts prices to fall 18% in both Sydney and Melbourne over the next eighteen months, with a 15% national decline. Given property prices increased 25% since the onset of the pandemic, both estimates leave the vast majority of households better off.
A blunt instrument
However, the market believes further rises will be needed given the strength of households. Australians have more than $200bn in extra savings stashed away while the income-to-savings ratio is nearly double pre-pandemic levels. Per the Financial Stability Review, just 5% of loans have a loan-to-value ratio of more than 75%, compared to 25% before the pandemic. Subsequently, the market is expecting a 3.72% cash rate by year-end to bring inflation back.
It’s highly improbable the cash rate reaches that number by year-end. But even if it did, its impact would be diminished. 30% of households don’t have a mortgage at all. Of the 37% with mortgages, around 40% remain on fixed-rate loans. Most of these will roll off in the next eighteen months but that still leaves a sizeable chunk of the population with little incentive to curb spending. In fact, households with strong balance sheets may capitalise on the price dip, entrenching housing inequality.
One offsetting segment is the 31% of households that rent. With supply restricted and borrowing costs on the rise, it’s likely this segment will feel the heat most.
The other big issue is that much of the inflation problem is largely supply, not demand-driven. Sure, the pandemic brought forward some discretionary spending. But rising oil and energy prices, Russia’s invasion of Ukraine, supply chain bottlenecks and a global food shortage are all outside of the RBA’s direct control.
Get the hint
Lowe is acutely aware of the strong economic backdrop. Part of his recent uptick in public appearances is to paint a dim outlook to the public and discourage excess consumption without needing to actually change rates. If Lowe can shock the market into thinking the RBA will raise rates aggressively, this will curb spending and give the RBA some wiggle room to slow future increases.
The RBA has been somewhat successful so far, with the latest Westpac-MI consumer confidence survey indicating that sentiment had reached its third-lowest point since 1994. The only two times confidence had gone lower were in the Global Financial Crisis and at the start of the pandemic. Meanwhile, construction activity has begun to fall, a lead indicator of economic confidence.
While the majority of households are well-equipped to weather rises, newer buyers could be in for a shock. APRA’s latest data indicated that 24 per cent of new mortgages had a debt-to-income ratio of six times or more, which is considered risky by the banking regulator. Most took out these loans on the basis that interest rates wouldn’t increase until 2024. One mitigating factor may be unemployment, which is at a record low level of 3.9%. As long as borrowers remain employed, defaulting on home loans is usually the option of last resort.
Where to from here?
Given the resilience of households, Lowe will keep his foot on the pedal for time being. A Goldilocks scenario would entail households getting the hint, demand falling enough to offset the supply-side challenges and inflation returning towards the RBA’s desired upper bound of 3%. In this case, Lowe likely won’t need to raise rates by 2.5% and house prices fall around 10%.
The more likely outcome is that between now and 2.5% Lowe pauses to assess the impact of cash rate rises on the economy. If arrears and unemployment remain low but inflation is still persistent, he likely sends the cash rate to 2.5% and inflicts a ~15% correction in home values in line with ANZ’s forecast.
Should inflation still persist, the risk of a more material housing downturn emerges. Lowe may be forced to increase the cash rate as unemployment rises, thus sending Australia’s economy into a recession. However, by this point, the elevated inflation numbers will be cycled. This means the supply-side challenges like energy and food shortages would need to worsen further for inflation to remain elevated.
Overall, for the overwhelming majority of households, the initial interest rate rises will be manageable. Normalising the cash rate will also be beneficial in the long run, as it will give the RBA ammunition to support the economy in future downturns. The elephant in room is how much demand destruction is required to rein in inflation and if the RBA needs to go beyond its stated neutral rate of 2.5% to achieve this.
This week we continue to look at investing in needs and not wants, highlighting two stocks in our portfolios. Following the volatility in markets this year we have been extensively reviewing our portfolios and looking for companies that have steady earnings, inflationary protection and a service/product that is a necessity and is immune to the central banks attack on consumer spending.
Williams Companies (WMB.NYSE)
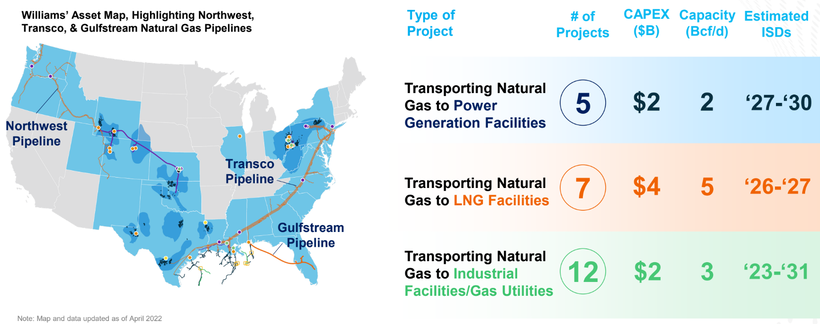
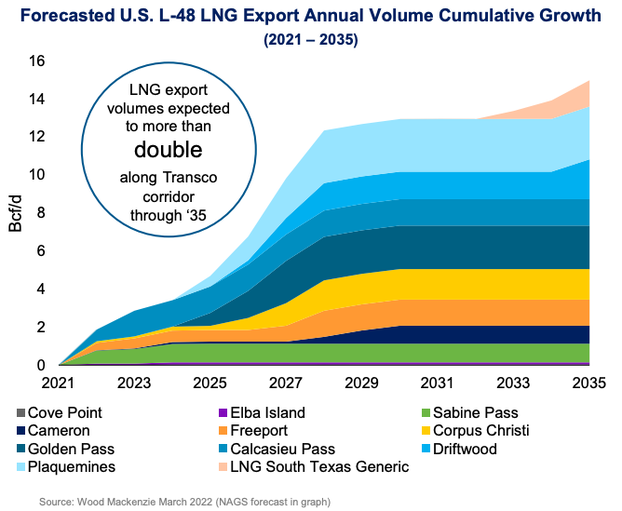
The Williams Companies, Inc., is an American energy company based in Tulsa, Oklahoma. Its core business is natural gas processing and transportation, with additional petroleum and electricity generation assets. Williams Companies is one of the largest natural gas-focused midstream companies in the United States, handling 30% of the gas used in the nation. The company is embarking on a number of projects meant to increase its capacity to supply gas to LNG producers and power plants along the East Coast. This will allow the company to continue their recent track record of steady cash flow growth.
Source: WMB company filings
The continuing conflict in Ukraine has put energy in the spotlight and, as much as society wants to move away from fossil fuels, we are finally starting to accept how critical oil and gas are going to remain during the transition period (regardless of where you stand on this being due to a short-sighted bungling of this transition over the past decade or so or not). As it currently stands, the pipelines that transport oil and gas are essential pieces of infrastructure. Without them homes would struggle to keep the lights on.
The company’s flagship pipeline system is the Transcontinental Gas Pipe Line (Transco), which is one of the major suppliers of natural gas to the highly populated Northeast. The Williams Companies has begun a $1.4bn capital spending program in order to expand the capacity of the Transco pipeline system to satisfy demand.
Williams are in a unique position to capitalise on the dire energy situation that New England currently finds itself in. New England have closed down their nuclear power plants and have limited access to LNG. Due to the treacherous winter they face, solar panels are made redundant by snowfall and the icy cold conditions only increase the demand for the warmth that LNG provides households.
Last winter the region, which has limited ability to bring natural gas via pipeline from neighbouring states in the prolific Appalachian Basin, burned the most oil to generate electricity in over a decade. If the Northeast continues to consume more oil to produce power, emissions are likely to rise. More urgently, virtually every attempt to expand the region’s natural gas pipeline infrastructure has been delayed, blocked, or abandoned. The book Shorting the Grid by Meredith Angwin discusses this issue in great detail.
Source: WMB company filings
Williams are set to increase their EBITDA by +38% this year and are currently sitting on a dividend yield of 5.3%. The barriers to entry are high and the demand for Williams’ infrastructure is rising. The rise of ESG has deterred spending for further development of oil & gas resources and without companies investing in new supply we will continue to see energy shortages. William’s ticks all our boxes when looking for stocks that people need. It has a monopoly over the northeast pipelines, high barriers to entry with regulatory authorities unwilling to approve new pipelines and delivers a service that we need now more than ever.
Singapore Exchange Ltd (S68.SGX)
Headquartered in Singapore, about 40% of companies and over 80% of bonds listed on the exchange originate outside Singapore. Singapore’s stock exchange is arguably Asia’s most international and connected exchange. The SGX comprises of 673 listed companies with a total market capitalisation of US$658bn. SGX famously tried to takeover the ASX back in 2014 and there were also rumours that the SGX was in talks with the London Stock Exchange regarding a transaction.
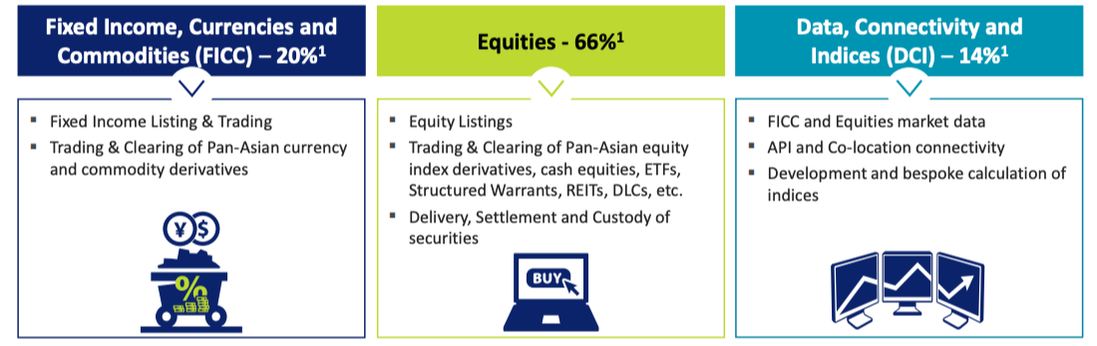
The Singapore stock exchange has three main businesses:
Fixed income, currencies and commodities
Equities
Data connectivity and indices
Source: S68 company filings
Singapore Exchange is somewhat of a hidden gem among the “needs not wants” crowd. They have a monopoly in one of the biggest financial hubs in the world, their revenues are stable and they provide an essential service. How else is everyone going to panic sell all their shares right now? Most wouldn’t categorise a stock exchange as an infrastructure-like holding, however we view it as a piece of systemically important financial infrastructure. Without exchanges markets will fail.
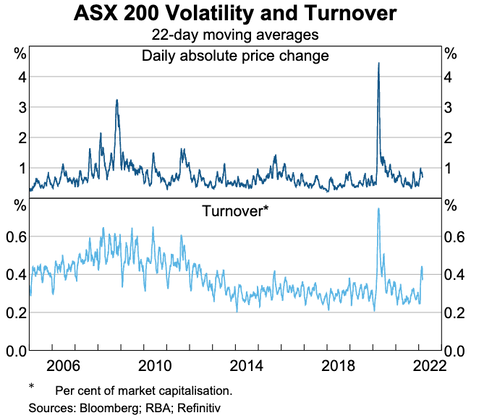
With markets taking a tumble, one might reasonably assume that owning an exchange would be a huge loser. The IPO market is a contributor, yes, but it only makes up 5% of the equity segment’s revenues. Trading and clearing make up most of the revenue for S68’s equities segment. With a Daily Average Trading Value (DAV) of S$1.4bn, S68’s average clearing fees for Cash Equities (includes ordinary shares, REITs and business trusts) was 2.73 basis points (Annual Report 2021). When markets are volatile we often see a spike in trading, this was evident in March 2020 with the initial pandemic crash. Just this week we saw the ASX fall in excess of -4% on the 14th of June, this saw a 70% increase in trading volume on the previous trading day. It’s simple, more trading = more fees.
Source: ABS
S68 should also be a beneficiary of higher interest rates, their Treasury income has suffered under lower rates. S68 reported a S$12bn float from collateral posted by derivative traders. These balances are invested in bank deposits, meaning interest income. The majority of this is going to derivative clearing members but a portion is retained by SGX. In FY21 this brought in S$72m of interest income, representing 13% of FY21 operating profit. On the back of big rate rises from central banks around the world, this income will grow substantially.
Singapore Exchange has been able to maintain its expense guidance for FY22 despite inflationary pressures. Their EBITDA margins are high at 57% and they have a 5-year CAGR of 4.9%, seeing steady growth in revenues.
There are a number of potential tailwinds for S68 moving forward. Companies in China will be eyeing listings in Singapore to hedge political risks. If some of these companies are forced to delist from US exchanges the SGX is a logical destination with ongoing concerns over Hong Kong’s autonomy going forward. Commodities and forex derivative volumes are rising as demand for risk management instruments (hedging) surges, this will only be exacerbated through central bank rate hikes. On the other side, building a stock exchange obviously has significant barriers to entry and is a highly regulated space, it’ll be tough for a genuine competitor to spring up. S68 is one of few stocks to hold up so far this year, up approx. +3% YTD.
Disclaimer: Williams Companies (WMB.NYSE) and Singapore Exchange (S68.SGX) are both currently held in the TAMIM Fund: Global High Conviction portfolio.