Robert Swift presents 4 short videos on the impact of the withdrawal from Zero Interest Rate Policies on financial stocks, infrastructure, geographic segments and asset allocation. As global central backs commence the process of normalising rates we will see the investment landscape change, Robert provides his thoughts on how best to navigate global investment markets.
This week Guy Carson, manager of the TAMIM Australian Equity All Cap Value IMA, takes a look at the recent RBA decision to yet again leave rates as they are. Have they made the right call? Should they have made a change?
The RBA’s Conundrum Guy Carson
Earlier this week the RBA remained on hold for the 7th consecutive month. However, when we look at economists’ forecasts for the remainder of the year there is significant divergence. Some believe that the economy needs further stimulus whilst others believe we are through the worst and will eventually follow the US Federal Reserve in raising rates. The interesting thing is that both cases have some merit when looking at the overall data and it’s only when we delve down to a state level that we can really understand why.
Firstly, let’s examine the rational for a rate cut. The RBA has a dual mandate to maintain full employment and the stability of the currency. The stability of the currency is seen as achieving an inflation target of 2-3%. As can be seen from the chart below, the Consumer Price Index fell below this targeted band in June 2015 and has remained there ever since.
Source: ABS
So currently the RBA is not achieving its price stability target. What about full employment? After seeing the unemployment rate improve from 2015 through to mid last year, we are now starting to see job growth slow. In fact the unemployment rate since the last RBA cut in August last year has gone from 5.7% to 5.9%, which isn’t exactly what they would have wanted. In addition the underlying quality of the jobs created in recent times has been poor with a large shift towards part-time employment meaning that underemployment has risen as well:
Source: ABS
Adding to this weak employment picture, wage growth is at record lows and this indicates that plenty of “slack” remains in the labour force. The Wage Price Index (WPI) is currently running at 1.9% year on year and has fallen steadily since 2012:
Source: ABS
It’s not until you look under the headline unemployment rate that you will notice some significant divergence in trends between states:
Source: ABS
If we look at the period of improvement in the unemployment rate from 2015 through to mid last year, it was largely driven by New South Wales and Victoria (as well as South Australia improving from a very high level). New South Wales currently has the lowest unemployment rate in the country at 5.2% which is near recent lows. Victoria has seen its unemployment rate tick up slightly to 6.1% but this is slightly misleading given the state has been the primary driver of job growth in the last year. The below chart looks at net jobs growth in each state over the last year and Victoria has represented a staggering 98% of the Australian total. The unemployment rate in the state has been impacted by high migration and it should be no surprise that people are moving to Melbourne given it’s the only place with jobs growth. Immigration tends to be pro-cyclical, i.e. people will move to where the jobs are.
Source: RBA
On the other end of the spectrum, a few of the states are struggling. In terms of job growth, Queensland has gone backwards by 38.6k in the last 12 months. Western Australia, whilst having stabilised in recent months has seen a worrying longer term trend in unemployment from a low of 3.5% in 2012 to 6.0% currently.
There are two major reasons for the divergence between states and that has been the end of the mining construction boom and the transition to the residential construction boom (we wrote about this extensively in our 2017 Outlook). Essentially in an attempt to see off a recession in the face of a significant fall in mining investment, the RBA has cut interest rates from 4.75% to 1.50%. This has led to is an unprecedented construction boom in housing, particularly along the East Coast and most notably in apartments.
The chart below looks at building approvals for apartments across New South Wales, Victoria, Queensland and WA (data is rolling annual). This is a leading indicator of construction activity and we can see all four states have recently reached all-time highs.
Source: ABS
Western Australia saw building approvals peak in June 2015 and hence is dealing with the end of a residential construction boom now as well as the ongoing falls in mining investment. The major concern now is Queensland where the annual number has rolled over, and on the volatile monthly basis it looks disastrous, as can be seen in the chart here:
Source: ABS
This is a significant headwind that the Queensland economy faces over the next 12-18 months. It is likely going to put further pressure on the current employment situation. So you could argue that Queensland is in need of further stimulus.
Moving across to Western Australia and whilst the employment situation has improved slightly in recent months, unemployment still remains elevated and households are struggling. We have talked previously about how mortgage arrears for the banks in WA on a 90 day basis have moved up significantly over the last 12 months (again, see our 2017 Outlook). We can now see, via Moody’s, that 30 day arrears are shooting higher for the entire country. This is being driven by the 2013 vintage of loans which is not overly surprising given it corresponds with the mining investment peak of 2012. This vintage is the purple line in the chart below.
Further evidence of household stress can be seen in the Retail Sales data where WA has seen very little growth since the beginning of 2016. Quite clearly WA households could use a further interest rate cut.
Source: ABS
Overall, there are arguments for both directions in rates. WA and Queensland are both in need of stimulus; an interest cut rate can easily be justified in both states. Meanwhile, the unemployment rate in New South Wales is sitting near decade lows at 5.1% and Victoria is recording strong jobs growth. Both of these states are in the midst of a record residential construction boom and have large infrastructure projects in progress or due to start. One could argue that interest rate rises would be more appropriate for these states.
The conundrum the RBA faces is that interest rates are a blunt tool. To provide stimulus to WA and Queensland, they need to provide stimulus to the rest of the country, there isn’t a way of differentiating.
Thankfully there is a solution but unfortunately it relies on a functional political system. Too often in recent years, central banks have been the only port of call for stimulus globally. Monetary stimulus (interest rate cuts and quantitative easing) has been the dominant force whilst fiscal stimulus (government spending) has been non-existent. On a global basis, there is hope that this might change, a big part of the Trump rally is based upon expectations of increased infrastructure spend in the US (whether Trump lives up to these expectations is another story altogether). Unfortunately in Australia, we have a government fixated on reducing its deficit and focused on the corporate tax rates. These tax cuts are more likely to just flow through to corporate profits and are unlikely to lead to the job gains and wage increases that the government is trumpeting.
Looking at the above state of play, we believe targeted fiscal stimulus in the form of infrastructure spending into Western Australia and Queensland would be the best option for the Australian economy. This would take pressure off the RBA, improve job prospects in those areas and potentially slow interstate migration to Victoria and New South Wales. The current government should be considering some sort of action, after all the WA voters recently showed their thinking on the matter by overwhelmingly going against the incumbent Liberal government. This (in addition with the rise of One Nation in Queensland) is a function of an unpleasant economic reality. It is similar to the trends seen globally which have seen the UK leave the EU, Donald Trump’s rise to power in the US and the popularity of Marine Le Pen in France. If things don’t improve, people will vote for change.
Robert Swift and Roger McIntosh compare local and international banks. Does it make sense to own the behemoths that dominate the Australian market? Are you unknowingly doubling down on exposure to the Australian property market?
Australian vs. Global banks – Which should I own? Robert Swift & Roger McIntosh
For Australian investors, the banking sector, particularly the four major banks, form a significant part of their investment strategy and exposure to Australian economic activity. However, only investing in Australian banks even with the franked dividend income, is definitely a suboptimal approach to investing.
Let’s compare Australian banks with global competitors in terms of valuation, capital sufficiency, and business positioning or resilience.
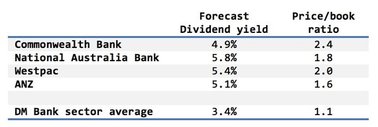
Australian banks have high dividend yields and low variability of EPS growth compared to global competitors. This would usually make them attractive. Although we like dividends as proof of cash flow, it appears to us that Australian banks are overdistributing earnings as dividends, and not sufficiently acknowledging the risk in their loan books. In other words, their EPS resilience is somewhat masked by ‘highly managed’ bad debt recognition.
In terms of capital sufficiency, the Australian banks are average. It appears to be a form of financial arbitrage to us that the Australian banks pay out franked dividends and then raise capital in the markets to meet regulatory capital ratios. If management wanted to avoid this ‘distribute capital and then raise capital’ merry go round they would cut the ordinary dividends and wouldn’t need to raise capital since the capital buffers would be built by retained earnings. However, there would be an outcry from investors desperate for dividend income. When companies are hooked on dividend amounts which they shouldn’t be paying, it strikes us as risky.
Price/book ratios may be a better guide to valuation given the latitude which all banks have in their EPS reports? In the table below we show the Australian banks look expensive on this measure compared to other developed market banks.
Source: Thomson Reuters
Australian banks tend to copy and follow each other’s business strategies and this is clearly shown in the very high correlation of the bank’s total returns with each, not offering investors a reasonable level of asset diversification. They rushed into expensive wealth management platforms and ‘fund management’ (multi-manager offerings) and all now appear to be exiting simultaneously? They all rushed into mortgage lending in NSW, Victoria and Queensland and are now being told by APRA, their regulator, to ‘cool it’. Further, to increased limits around mortgage lending, the regulator has now indicated they are reviewing further changes to the risk weightings the banks use (for details on this, please see The Lazy Dog blog post). None have cracked Asia; none have cracked investment banking as have the USA majors.
You can see the result of this ‘tack and cover’ strategy in the table below. This compares the price behaviour of the Australian banks to each other where a figure near 1 means they are al the same and a figure of -1 means they are all different.
Correlation figures of 0.8 or higher show very close similarity in asset returns. Investing in Australian banks is essentially investing in one big bank. This is not ideal for your portfolio.
Correlation of monthly total returns for 5 years ending 31/3/2017
Source: Thomson Reuters
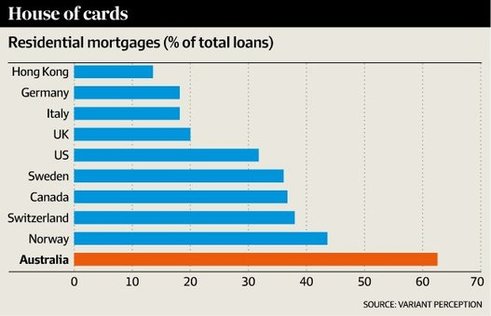
Investing in non-Australian banks, particularly those with broad, global operations, offers a much broader and diverse source of business activity and economic exposure which in turn provides broader net cashflow and alternative revenue sources. The analysis suggests that the market is aware that the largest source of revenue for Australian banks arises from net interest income, primarily domestic loans and credit to personal and business customers. They are all the same and their fortunes will wax and wane together. No diversification here at all. Own the Australian banks and you own their residential property exposure and your own home as well. Potentially a large part of your wealth and income is focused on one asset class – Australian residential property.
Source: AFR
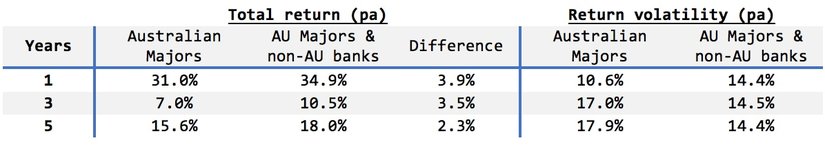
Benefits of diversifying are clearly demonstrated in an analysis of the differences in return and risk outcomes of a strategy that holds equal exposure to the four major Australian banks and an equal-weighted portfolio of the four majors and the banks held in our High Conviction Strategy. Currently, these are JPMorgan Chase (US), Sumitomo Mitsui Financial Group (JP), BNP Paribas (FR) and Bank of Montreal (CA). These banks provide a great combination of exposure to global banking and to different types of regional economic activity. They are far more diversified with their loan books.
AUD annualised gross total return and volatility for periods ending 31/3/2017
Source: Thomson Reuters
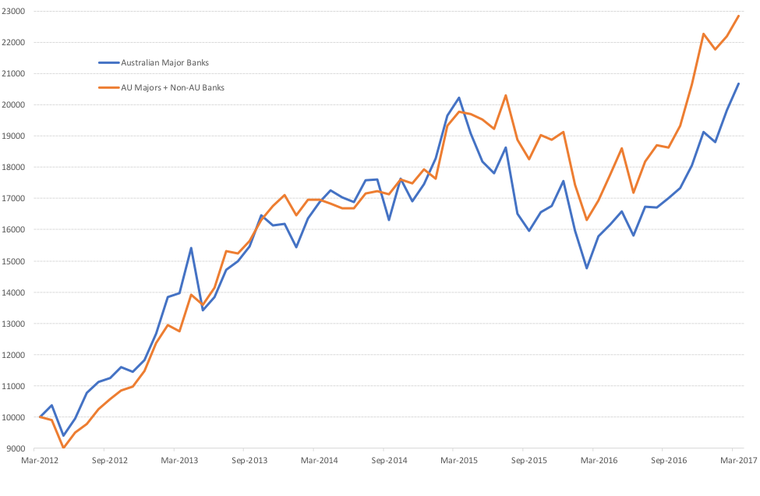
There is definitely a benefit in terms of higher returns and reduced variability of returns by adding exposure to non-Australian banks. This can also be seen in the growth in $10,000 invested in each strategy over the last 5 years.
Australian banks are not badly managed. They are not bad businesses. They pay seemingly attractive dividends. They are however very similar to each other and are currently over exposed to Australian residential loan risk. They are possibly paying out too much in equity dividends. A small increase in loan loss provisioning could wipe out in share price terms, the extra tax credits from their dividends. Consequently, there are meaningful benefits by investing outside Australia and its banks.
Scott Maddock reviews the current interest rate environment and the outlook for rates. Given the view that rates will increase but that they will do so at a slower rate than most expect, Scott discusses three portfolio holdings that he believes will continue to deliver strong and sustainable dividend yields.
We take a look at the “shopping list” of qualities our small cap team look for in making an investment. They run through each and provide a stock example to illustrate their point.
High Quality – A Shopping List
Summary:
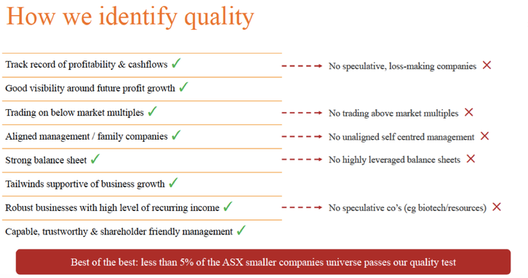
Within our team we are focused upon investing in under-valued, high quality smaller companies. We are often asked how we define high quality so in this article we present our shopping list of attributes we look for in high quality businesses which we can invest in for the long term to generate superior returns for our clients.
Profitability & cash flows:
The first deal breaker for us in the high quality search is whether a company is profitable and cash flow positive. In our minds profitability and positive cash flow generation are both core to what a business should be about, and thus we are not willing to speculate on loss-making companies which are aiming to more than cover their costs in the future. And it is not just the short term risks we are aware of: loss-making companies carry longer term risks far beyond the headline losses in our opinion. If a business is loss-making it often indicates an “empire building” mindset in management, poor strategic choices, structural problems with the business model, and cost mismanagement issues. This is obviously not always the case but in our experience the hit rate with these issues is high, and we are not willing to risk shareholders’ funds where these risks are high.
When looking at profitability we are interested in comparing a company’s reported earnings with its reported cash flows. In our experience, it is common to come across companies where their reported earnings are significantly higher than their reported cash flows. The difference is usually explained by the company’s accounting choices. For example, we recently did some work on a retirement village owner and operator which looks very cheap on statutory earnings at around 8x this year’s earnings. However, when we analysed the company’s accounts it became apparent that much of this year’s earnings are coming from expected property revaluations and thus the company’s cash flows, and the profitability of the underlying business, are likely to be significantly lower. We decided the stock was expensive as a result. We are looking for the contrary scenario whereby reported earnings are below reported cash flows reflecting conservative accounting strategies. Companies which fall into this category tend to be led by management teams focused upon under-promising and over-delivering. STOCK EXAMPLE:Fiducian (ASX:FID) is a good example of a highly profitable stock in the TAMIM small cap portfolio which tends to report higher cash flows than statutory net profit reflecting its highly experienced and conservative management team. In its recent half yearly report operating cash flows was $3.6m versus a statutory net profit of $3.4m.
Visible organic growth drivers:
Next on our shopping list is companies which have clear and visible organic growth drivers which management can articulate.
We often come across businesses which are focused upon capturing a macro theme or trend. When we read through their presentations we generally find many inspiring charts highlighting the enormous growth potential of this macro trend/theme. However, after reading such presentations we are often left wondering what the company actually does and why it will benefit from these macro drivers. This is not what we are looking for.
We are looking for companies which have clear strategies in place to grow their businesses independent of macro trends. We’ll discuss business tailwinds later in this article (these are also on our high quality list) but we need to see clear organic growth strategies from management. And we also need to understand exactly what a company’s growth strategies mean in terms of day to day business activities.
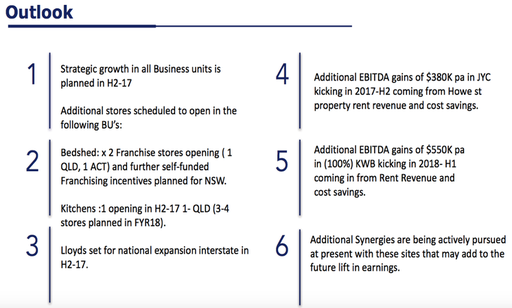
STOCK EXAMPLE:Joyce Corp (ASX:JYC) is an example from the TAMIM small cap portfolio of a stock with clear growth drivers looking forward. The following slide from the company’s recent half yearly presentation highlights 6 clear and visible earnings growth drivers in the year ahead – a big tick on our high quality list:
Source: JYC company filings
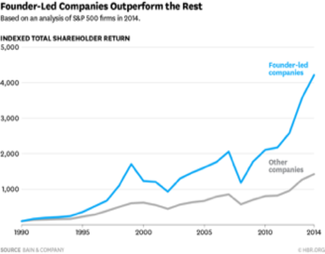
Aligned management & family companies:
We have previously written of our preference for companies in which management are personally invested, of which family/founder companies are a great example. Having “skin in the game” is a highly effective means of ensuring management are thinking of shareholders’ best interests at all times. The evidence is compelling:
STOCK EXAMPLE: Dental product supplier SDI (ASX:SDI) commenced operations in founder Jeffrey Cheetham’s garage, producing amalgam fillings and selling the products direct to dentists. By 1975, the company had operations in New Zealand, United States and Greece. Following a decade of national and international success, the company listed on the ASX in 1985. A strong focus on research and development has seen SDI develop an extensive portfolio of innovative restorative and cosmetic dental products including fillings, cements, tooth whitening products and associated dental equipment, with market leading positions in various geographies. We believe the company’s long term successes have been largely driven by the founder’s passion for and stake in the business.
Strong balance sheet:
There are many reasons why we like companies with strong balance sheets including:
Lower financial risks – Companies with net cash surpluses don’t need to pay interest and are thus far less exposed to financial risks in the event of a business slowdown, rising interest rates, etc.
More earnings to distribute as dividends – Management of debt free companies only need to think of equity holders since there are no debt holders ahead of them in the queue waiting to be paid. This means shareholders are well placed to receive attractive dividends payouts, and it also means management thinking is all about shareholders which in our experience is a good thing.
Greater flexibility to expand when opportunities arise – Companies with strong balance sheets are well placed to make opportunistic investments when the opportunities present themselves. This is a significant advantage in our opinion since it is often hard to predict when acquisition opportunities are likely to arise.
STOCK EXAMPLE: A powerful example of a company with a strong balance sheet within the TAMIM small cap portfolio is Reverse Corp (ASX:REF). As at 31st December 2016 the company held $7.42m in net cash versus its current market cap of $8.6m. The market is currently valuing the company’s reverse calling and online contact lens businesses at a lowly $1.2m. We believe these two businesses are worth far more than this, and the company has the benefit of an extremely strong balance sheet which can be used to build the online contact lens business whilst paying very high fully franked dividends to shareholders.
Business tailwinds:
In addition to the organic business drivers already mentioned, we like to invest in companies with industry tailwinds behind them. In our experience, being in the right industry at the right time often makes it easier for a company to exceed the market’s earnings expectations.
STOCK EXAMPLE: Paragon Healthcare (ASX:PGC) is a standout example within the portfolio. Paragon is a leading provider of medical equipment, devices and consumables to the healthcare market, and provides excellent exposure to the ageing population thematic. We believe the company’s organic growth drivers will be complemented and supplemented by this powerful tailwind in the years to come.
We spend a lot of time getting to know management in order to tick this final box on all our investments. We believe high quality management are even more important when investing in smaller companies than larger companies because each strategic decision tends to carry a higher relative weight in a smaller business.
As a result, we will only invest in businesses with management who are:
Capable – We are looking for management teams who know the ins and outs of their business and industry. When talking with management we want to come away interested and inspired by what they are doing, not confused and bored.
Trustworthy – We view this one as a deal-breaker. We need to be able to trust what management are saying at all times. This includes all financial accounts.
Shareholder friendly – By this we mean management who will always act in shareholders’ best interests. For example, given the choice of making an expensive acquisition for the sake of empire building or paying shareholders a healthy dividend, we would aim to be invested with the management team which chooses the latter option.
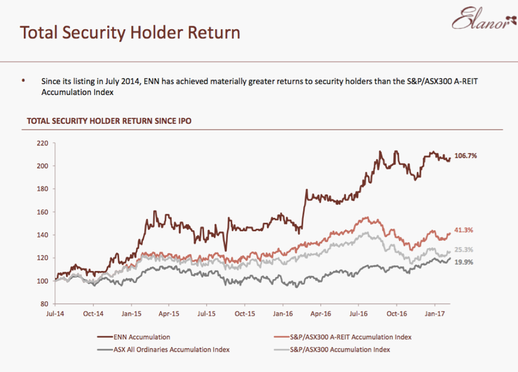
STOCK EXAMPLE:Elanor Investors (ASX:ENN) is an example of TAMIM small cap stock with highly capable, trustworthy and shareholder friendly management who are very conscious of total shareholder returns as per this slide from the recent half yearly results presentation:
Source: ENN company filings
Conclusion:
It’s a long shopping list and we are very picky. However, we believe ticking all these high quality boxes at the right valuation is why our clients invest with us. The lower the hit rate, the more repeatable and sustainable the process in our opinion. We will remain disciplined in our search for under-valued high quality smaller companies looking forward.