The team at DMX, managers of the TAMIM Australian Equity Small Cap IMA, take a look forward to 2017.
2017 Outlook: Value well placed to shine
Summary:
As passionate value investors we believe buying under-valued and largely unknown smaller companies is a sensible long term investment strategy, and a key driver behind the significant out-performance of the All Ords since launch 21 months ago. We view the current valuation differential between value and growth stocks, as well as the global macro backdrop, as particularly supportive of value stocks in the year ahead. We believe our investors are well placed to benefit.
Value Investing at an Extreme:
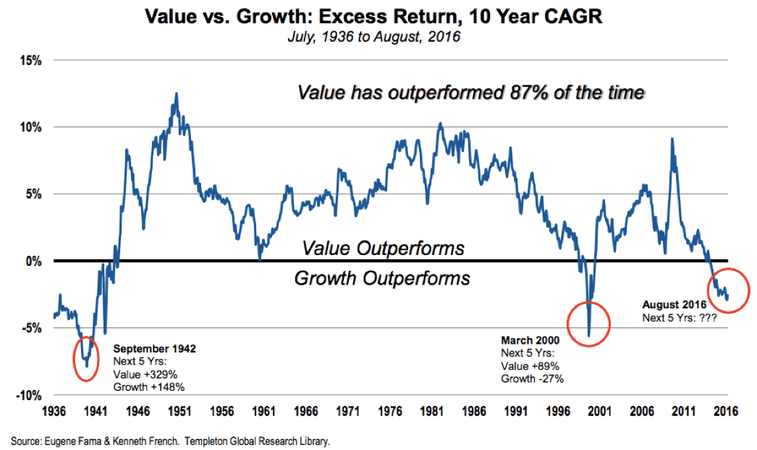
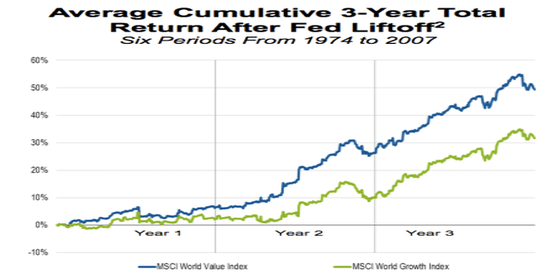
As a starting point let’s look at the very long term performance data regarding value versus growth investing. Value investing as a strategy has out-performed growth investing 87% of the time over the past 80 years as shown by the most recent Templeton analysis using 80 years of data:
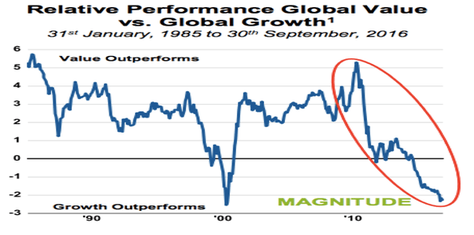
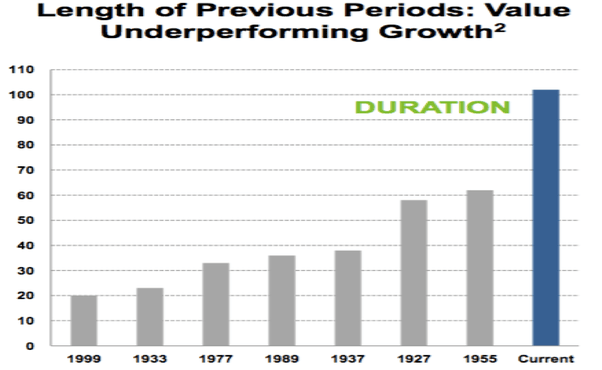
However, value investing has dramatically under-performed growth investing since the global financial crisis, and the recent under-performance of value versus growth has been extreme:
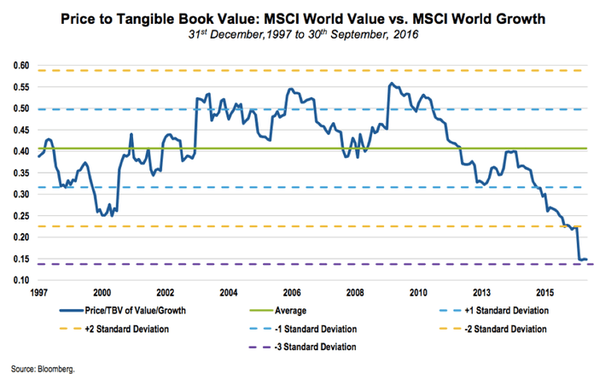
As a result, the valuation gap between value and growth stocks is currently at a long term extreme:
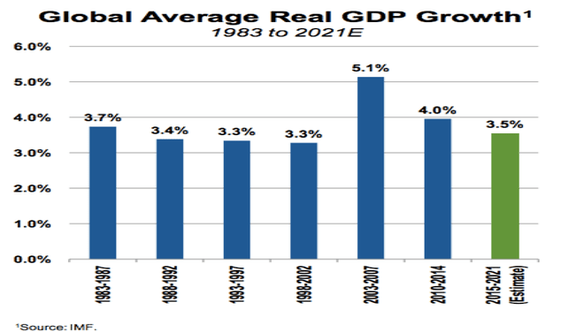
At a time when global economic growth is relatively stable/normal:
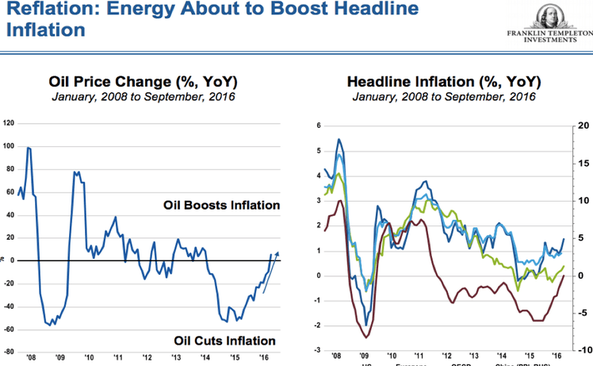
Inflation has started trending upwards (source: Templeton):
And interest rate risk is now clearly on the upside as highlighted on numerous recent occasions by the Fed. Historically, a rising interest rate environment has dramatic implications for value investing as growth stock valuations tend to suffer in the face of a higher discount rate which forces investors towards the cheaper end of the investment spectrum:
The unusually long period of growth out-performance versus value looks to have ended, which bodes well for value investing as a strategy looking forward. We view the current market environment as ideally suited to a disciplined and focused value strategy.
Source: Templeton
Conclusion:
We remain committed value investors in our underlying smaller companies’ fund and believe the outlook for value investing as a strategy is particularly attractive at this stage. With interest rate and inflation risk now clearly on the upside, investors are likely to focus more on underlying valuations looking forward. The outstanding out-performance of the All Ords over the past 21 months has been achieved despite the value investing headwinds evident throughout this period. We look forward to a period with value investing tailwinds behind us.
This week the team at DMX, managers on the TAMIM Australian Equity Small Cap IMA, review some of their portfolio holdings following AGM season. They discuss their positions in Fiducian, Konekt, SDI, Pioneer, Paragon & Joyce Corporation.
Small Cap AGM Season Review
November saw some significant news flow and material share price movements across the portfolio. Key positive contributors to the November results included ASX:KKT and ASX:FID, while ASX:SDI and ASX:ENN were key negative contributors.
Our cash levels remain elevated at month end which is a function of exiting/reducing several positions during the month, and in part to provide funding for some opportunities we have committed to in December.
Annual General Meeting season for ASX listed companies continued through November. Below we comment on AGM highlights and trading updates from a selection of our previously discussed positions.
Paragon Care Limited (ASX:PGC) Paragon Care Limited (ASX:PGC), a leading provider of consumables and equipment to hospitals and aged care facilities, advised that it had enjoyed a strong start to FY17.
Strong growth was being delivered across key financial metrics. In the first quarter of FY17, the company’s EBITDA on a like for like basis was 12% up over the prior corresponding quarter.PGC reaffirmed expectations of strong earnings growth for FY17, with FY17 being the first full year of earnings capture from it 2015 acquisitions. Paragon is targeting strong growth in FY17 across all key metrics.
PGC also provided medium term ‘targets’ for revenue of $250m and EBITDA of $37.5m, to be driven by strong double digit organic growth and value accretive M&A transactions. This would represent a significant step up from FY17 expectations(Revenue: ~$120m, EBITDA: ~$17m).
Fiducian Group Limited (ASX:FID)
Fiducian Group Limited (ASX:FID), the financial planning and funds management group, advised that it has significant capacity and strategies in place for further growth in its traditional revenue base. It expects its funds under administration to continue to grow and, in particular, benefit from recent financial planning acquisitions.FID advised that its unaudited profit for the first quarter of FY17 is ahead of budget, and funds under administration have grown since June as a result of both good inflows and funds performance.
Medium term growth for FID will be delivered by:
Growing funds under advice organically and through strategic acquisitions of financial planning businesses;
Expanding its platform administration servicesto IFAs and capture of market share where value accretive;
Building its SMSF services and continuing to deliver superior investment performance through its funds and attracting IFAs.
Konekt Limited (ASX:KKT)
Konekt Limited (ASX:KKT) advised it had commenced the first four months of the year strongly, with revenue more than 35% ahead of the prior corresponding period (which only had marginal acquired revenue included). KKT had previously advised that it expected FY17 revenue of between $50m – $53m driven by both organic growth and the full year impact of acquisitions completed in the year. KKT now upgrade this to a range of $51m – $53.5m.Despite a significant investment in a range of business improvement initiatives in the first half of FY17, KKT expects to hold its EBITDA margin for the first half at around its FY16 level (10%). On the back of these first half investments, KKT expect a strong improvement in margins in the second half, such that full year EBITDA is expected to be in the range of 10.5%- 11.5%.
We attended the KKT AGM, and noted that the company was very confident of further growth. The CEO, Damian Banks, advised that “more upside remains available to us and we have a strong company leadership group building our business”.
Pioneer Credit Limited (ASX:PNC)
Pioneer Credit Limited (ASX:PNC) advised at its AGM that it was excited about the way in which FY17 had commenced, and that another year of high quality growth was underway.
PNC has approximately 85% of its forecast investment of $50m for the year under contract, and about 40% of its expected investment for the following year also contracted – a significant improvement in visibility on prior years. PNC reiterated its guidance for the full year of statutory NPAT of at least $10.5m.
PNC continues to work towards the launch of a range of new financial products, with the launch of a white label credit card nearing finalisation. The expansion of PNC’s new venture focused on funding, Pioneer Credit Connect, is taking shape as can be seen from its new website: http://www.pioneercreditconnect.com.au/.
SDI Limited (ASX:SDI)
Prior to its AGM, dental products manufacturer SDI Limited (ASX:SDI) reported that not-withstanding good sales growth, it was on track to report a lower first half profit than the previous year.A key reason for the disappointing fall in profit was surprisingly strong sales growth in the UK (+18% on PCP) resulting in relatively lower gross margins due to the weakness of the pound. Currency translation and tax timing issues also are expected to impact after tax profit – unfortunately this was not clearly disclosed to the market by SDI in its trading update, and its share price fell materially.
The core investment thesis for SDI remains unchanged: it is a growing, vertically integrated global dental manufacturer with quality IP, high margins and a strong pipeline of new products.
However, the episode certainly highlights (again) the need for improved market communication from SDI, and re-focuses the market on the currency risk inherent in the business and the resultant impact on profit.
Joyce Corporation Limited (ASX: JYC)
Investment company Joyce Corporation Limited (ASX:JYC) noted at its AGM a strong start to the year, maintaining a relatively high rate of revenue growth for the first quarter.
Total written sales across the JYC businesses (including franchisee sales), is expected to be within the range of $180m- $200m in FY17. “At this early stage it appearsto be tracking toward the higher end of this range.” This represents an upgrade on the previously advised level of $170m.
In FY17, JYC will benefit from the earnings contribution from its Lloyds business (~$1.4m EBITDA), and (from January 2017) savings of $380k p.a. when it moves into its new wholly owned property, and we expect its FY17 NPAT to exceed $3m (FY16: $1.9m; +58%). The company continues to hold a large cash balance and property assets and is on a +7% dividend yield.
JYC remains very cheap, but suffers from poor liquidity, complicated accounting and poor market awareness. With its strong balance sheet, JYC has the capacity to acquire a further business with EBITDA of up to $1.5m without taking on any operational debt. A fourth business would further diversify revenues and put JYC on target for an NPAT (after minorities) of north of $4m.
As we head into 2016, the team at TAMIM thought we should put our heads together and come up with 7 strange yet quite plausible scenarios that the world could encounter through the next 12 months. Robert Swift, head of TAMIM’s Global Equity Strategies puts the following 7 not so outlandish idea’s forward…
US Election results in an isolationist President (no – not Donald Trump) who pulls back significantly from Asia, Europe & the Middle East. US defence expenditures balloon as other countries seek to demonstrate strength and the US seeks to send a signal to China and Russia. As a result US corporate tax rates are increased ubiquitously to pay for this spending.
China’s attempts to boost regional infrastructure and invest in hard assets overseas meets with increased protectionism and a reluctance to sell “the family silver” to the Chinese. China refuses to merely invest in overseas government bonds since they have no inflation protection unlike real assets. Interest rates in deficit countries rise dramatically despite limited inflation as lack of buying reduces clearing prices. China effectively declares a “buyers’ strike” on continued high levels of bond issuance by certain countries.
Saudi Arabia and Qatar endure deep recessions caused by a reduction in public spending made necessary by the continued decline in the oil price. Migrant workers are forced to leave and voluntarily embark to Europe causing further political repercussions.
The Euro becomes untenable as unemployment rises further but instead of allowing a break up, the ECB argues for enforcing capital controls under article 66 of the Treaty of the functioning of the European Union. European equities and bonds slump.
Emerging market countries running deficits debate imposing capital controls or a transaction tax on inward and outward financial capital. Foreign Direct Investment remains exempt. P/E multiples of Multi-National Companies rise dramatically since they become the only viable way to invest financial capital in certain Emerging economies.
China A shares included in major global benchmarks resulting a stabilisation of Chinese share markets.
Abenomics declared a failure and Japan opens its doors to large scale, targeted immigration in an effort to reduce its dependency ratio and improve public finances. Japan’s stock market rises dramatically as consumer spending rises, debt ratios improve, and new service sector industries are created which drives GDP forward.
After a strong run, SDI has recently been sold off following the company’s recent profit guidance. We view the issues impacting SDI’s profit to be short term in nature and view the long term investment thesis intact.
In August we wrote about SDI as an “emerging global leader” in its dental product markets. After a strong run, the stock has recently been sold off following the company’s recent profit guidance. However, we view the issues impacting SDI’s profit to be short term in nature, and view the long term investment thesis as remaining intact. In this update, we discuss the implications of recent newsflow and reaffirm our investment rationale for the company.
Stock Picking – SDI (SDI.AX)
Recent SDI Newsflow In advance of its recent Annual General Meeting in late November, SDI released a trading update for the first six months of FY16. While management reaffirmed their FY17 sales guidance of 10% growth for non-amalgam sales and flat amalgam sales, they also provided profit guidance for the first half of $2-2.5m which will be down from $3m achieved in the first half of FY16. The market was disappointed by the profit guidance which management explained reflected in part some material currency moves.We view short term currency impacts as normal for a company growing its international revenue base en-route to becoming a global market leader, however we question if the currency exposure could have been better managed by the company. The market obviously under-estimated currency as a short term risk to profit, given the selling that followed.
While acknowledging that currency movements will impact a business that exports 90% of its sales, we cannot defend the way management communicated the reasons at play behind this lower earnings guidance. Rather than providing the details expected to keep public markets properly informed, management opted to provide minimal information and clarity. As a result, it was not a surprise to see the stock sell off quite significantly. Ironically, it is this poor market communication which forms part of our investment thesis looking forward.
Our Investment Thesis Reaffirmed There is no fundamental change in our investment thesis. We view SDI as an emerging global leader in a defensive growth market which is well placed to grow consistently at 3-4% p.a. with minimal correlation to the global economy. As the chart below shows, the company has experienced strong growth in Europe and Brazil in FY16 which has been partially offset by US weakness.
Our investment thesis very much depends upon the continuation of two structural transitions the company is currently going through:
1. A shift away from amalgam product sales towards non-amalgam product sales – this remains very much on track with continuing strong growth momentum in glass ionomers and whitening product (non-amalgam) sales momentum in local currency,
2. A (gradual) shift away from a private family company way of managing and communicating towards publicly listed market standards – this is arguably the slowest moving part of the investment thesis as evidenced by the company’s disappointing handling of this earnings downgrade announcement.
The company continues to be profitable, and has a strong balance sheet with a net cash surplus which leaves it well positioned to fund future growth.
We view the current share price as under-valuing SDI given the significant potential earnings growth we believe lies ahead in the coming years. The SDI business model benefits from excellent operational leverage so shareholders are well placed to benefit from strong future non-amalgam revenue growth. As a result, we remain confident that the current share price provides ample margin of safety.
The stock had arguably attracted some shorter term investors in the recent rally. One investor recently said to us that “SDI had become the poster child of smaller company value investors, some of whom joined the bandwagon late”. We view the recent sell-off as an opportunity to re-focus the shareholder base on the company’s long term objectives. The recent passing of SDI stock from impatient to patient investors can only be a good thing for long term shareholders.
Some Messages for Management from a Long Term Shareholder Please communicate clearly and if possible ahead of time. Your long term and supportive shareholders are likely to look through minor short term disruptions like this if you communicate openly and in advance, and not surprise them with poorly communicated disclosures. In the event there is an unforeseen event, it is always best to open up and give the market a frank, honest and detailed account of what has happened. Investors will pay a premium for high quality management, and high quality management communicates well.
Please provide details on the evolution of underlying earnings when there are numerous factors at play – ie. it is often more meaningful to strip out any one-off factors when appropriate to provide a clear picture of how the business is actually evolving. For example, when providing guidance, it may have been prudent to strip out or at least explicitly explain the one-off effects of currency translation or other abnormal items.
Beyond this, we appreciate Management’s focus on positioning the company for long term growth. The process of unlocking the value in the business is an exciting opportunity for your long term shareholders.
Our Investment Process at Play
As value investors, we view short term weakness as an opportunity when the long term investment thesis remains intact, like now.
We view recent SDI share price weakness as good news for our investors since it provides the opportunity to purchase more stock at an attractive valuation with a significant margin of safety.
SDI remains a core long term holding for DMX and the TAMIM Australian Equity Small Cap poortfolio. We look forward to a long-term partnership with SDI and believe our investors will benefit.
This week the team at CBG, the fund underlying the TAMIM Australian Equity Growth & Income Individually Managed Accounts (IMA), take an in depth look at their investment thesis for Vocus Communications Ltd (VOC.AX).
This week the team at CBG, the fund underlying the TAMIM Australian Equity Growth & Income Individually Managed Accounts (IMA), takes an in depth look at their investment thesis for Vocus Communications Ltd (VOC.AX)
Stock Picking – Vocus Communications Ltd (VOC.AX)
Company Profile:
In February 2016 Vocus merged with M2 to become a full-service vertically integrated telecommunications company that sells to consumers, businesses and government customers across Australia and New Zealand. In essence the merger brought infrastructure together with infrastructure. The purchase of NextGen in June 2016 further built out the infrastructure footprint.M2 was established in 1999 and developed, manufactured and distributed digital messaging systems for small businesses. Through a series of acquisitions and organic growth, the company became a national reseller of broadband, fixed voice, mobile, energy and insurance services to predominantly consumer and small businesses.
Vocus was in launched in 2008 and provided IP transit wholesale services to the Australia and New Zealand telecommunications markets. Through a series of acquisitions and organic growth, Vocus expanded to provide fibre, ethernet, internet, data centre and voice services to corporate, government and wholesale customers.Initial investment view: This is a challenger telco story. VOC has grown organically and by acquisition to become Australia’s fourth largest telco. It now has scale and backhaul assets to compete on a level footing with the other majors and an efficient and lower than peer cost base which will boost its competitiveness.
The NBN will be an industry changing event whereby incumbents with their own networks will lose their competitive advantage. For consumers, NBN will provide the network and Retail Service Providers (RSPs) will sell on the basis of price and quality of customer service. This will be advantageous for challengers with lower costs to serve. While TLS is still likely to dominate the space, we expect them to cede some market share.
Broker estimates have EBITDA growing at a 3-year Compound Annual Growth Rate (CAGR) of 14% and EPS at 18% highlighting strongly ahead of market growth expectations. Even halving the expected growth rate would see VOC still grow ahead of market.
Despite the growth outlook, VOC trades in line with the market. VOC is now trading on 9.8x FY17F consensus EBITDA (8.1x FY18F) and 15.4x FY17F consensus EPS (13.0x FY18F) and offers a 3.3% yield.
Post the recent pull back, it looks to be cheap vs its own history and peers, especially factoring in the growth outlook. For comparison, the All Industrials ex financials is trading on 11.0x and 10.3x FY17 and FY18 EBITDA respectively (source: UBS) and 19.6x FY17 EPS (17.7x FY18F EPS), with 10% EPS growth.
While results in the short term are likely to be messy given the transactions undertaken over FY16, and risks remain over integration, we believe the core business is solid and VOC will be a strong competitor in a highly competitive market.
What is the industry outlook?
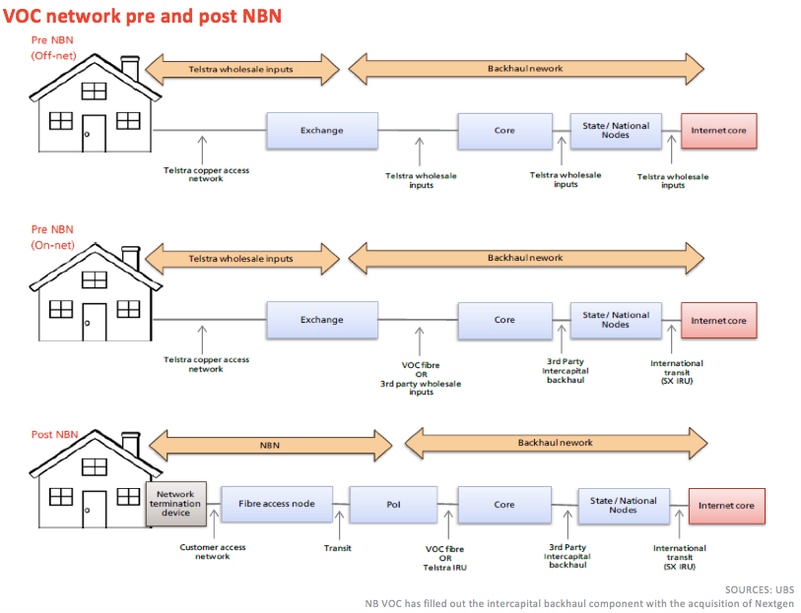
The telco sector is highly dependent on the regulatory environment and technological change. The rollout of the NBN in particular is set to change the industry landscape.
NBN will assume control of the ‘last mile’. This essentially removes the ability of existing RSP’s to differentiate on cost structure on the access network i.e.: i) the incumbent (TLS) loses ownership of the Customer Access Network (in return for NBN cash payments), ii) RSP’s with significant DSLAM infrastructure (e.g. TPM / IIN) will see costs rise from a ULL cost of c$15-$17 today to c$43 per user under NBN, and iii) even infrastructure-light RSP’s (e.g. VOC) will no longer receive scale discounts for last mile network access.
This suggests a more level playing field will exist post NBN with respect to network access. Of course RSP’s will also seek to differentiate via fixed operating costs, bundled content, differentiated offerings, service levels etc. This gives challenger Telcos like VOC a viable platform for growth.
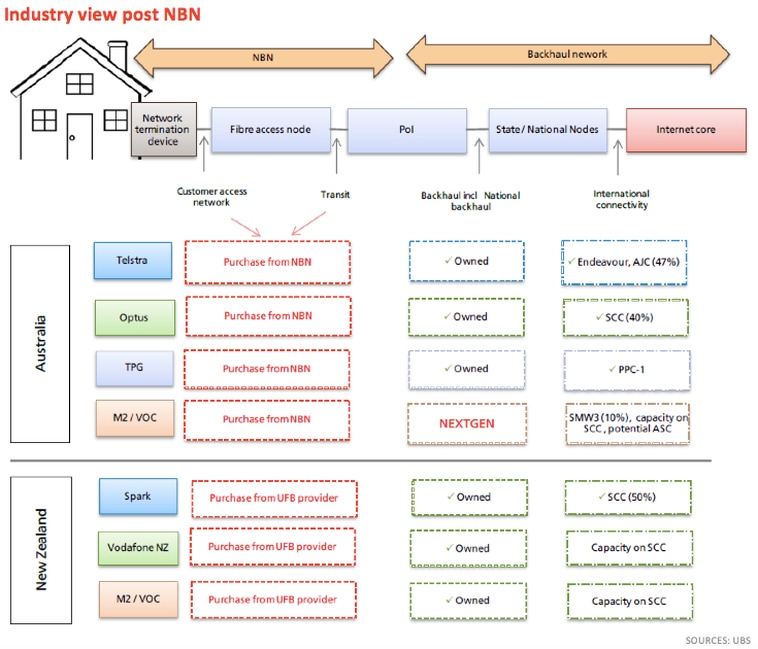
The Figure below from UBS illustrates the level of vertical integration in both Australia and NZ. It’s clear that players are now on a level playing field.
As NBNCo now assumes control of last mile network access: 1) Marginal cost curves lift materially for both the incumbent TLS, and RSPs which have been sweating DSLAM investments, 2) Industry competition may increase as cost curve differentials between RSPs narrow (at least for the customer access network), and 3) Decline of legacy revenue pools such as voice will accelerate.
One way falling industry returns are likely to manifest is via lower fixed margins: for both the previous owner of the last mile – TLS (compensated via government NBN payments), and for players with large ‘on-net’ subscriber bases (e.g. TPM / Optus). Margins will likely remain relatively more stable for resellers (VOC):
TLS: fixed data margins sit at 41% today (DSL + NBN), and voice at 54%. At its Oct-15 investor day, TLS flagged it could feasibly see fixed margins dip to c20% in the long-term as a pure reseller, as it loses ownership of the last mile.
TPM: TPM’s subscriber base is split c1,338k on-net, and 329k off-net. Based on revised ACCC pricing, on-net costs sit at $14.68 ULL, and $1.63 LSS today. These costs sit well below NBNCo’s average ARPU (and hence the average cost paid by RSP’s to NBNCo) of $43.
VOC: VOC’s all-in off-net cost is likely at a meaningful discount to regulated prices given VOC is TLS’ largest wholesale customer (UBS estimates c$40). While the comparable all-in cost on NBN (A$43) is above VOC’s costs today, the blended NBN ARPU is also higher which should result in MTU’s $ gross margins remaining constant. Also, there is the potential that the all-in NBN cost declines.
What are VOC’s market shares?VOC has a relatively small share of the residential telco, business telco, and energy markets today. VOC’s competitive position in each product market is summarised below:
Voice: Nationally there are c10m fixed line services (retail and wholesale) in operation, relative to total VOC voice services of c800k. We estimate VOC has c10% share of the business voice market and c5% share of the residential voice market. Voice is a market in decline.
Data: Currently there are 6.4m residential and small business fixed data subscribers in Australia. VOC has 520k data services, implying c8.3% market share.
Mobile: There are c30m mobile handset and mobile broadband services nationally. VOC has 167k mobile services, implying 0.6% market share.
Energymarket: There are 15.1m residential and business gas and electricity subscribers nationally (4.7m gas, 10.5m electricity), VOC has 141k energy services implying 0.9% share.
Bull points:
Significant cost synergies to be generated from transactions – VOC has guided to A$13-15m from Amcom acquisition to be realised by end FY17 and A$40m to be realised by the merger with M2 by end FY18 driving a base of earnings growth.
Better network quality means reduced customer churn – Gross consumer churn ratio of 2.6% per month is higher than competitors due to its younger customer demographic and sales-centric model, which usually attracts a greater mix of high-churn customers. However, post-merger, the consumer division can provide faster broadband speeds improving customer experience and therefore could see a reduction in churn levels. We estimate a 1% reduction in consumer churn would add 5k SIOs per month, $2.5m revenue. Lower churn would also see total customer acquisition costs decline. Finally, every customer brought on-net also saves A$15-17 per sub providing further upside (assuming 5% of 520k customers means A$5m pa) until NBN strands the assets. This is not included in the merger synergies outlined above.
Increased penetration of on-net buildings – Over the last few years the company has been building out its fibre network but is now undertaking more in-building marketing to sell additional fibre services within its current fibre footprint. Further penetration within Vocus’ existing fibre footprint would incur minimal costs and so could lead to material margin expansion. Each additional customer has been estimated by the market to have a GM of 80%+ leading to large expected EBITDA margin improvement in this business (ie 500-600bps between FY16 and FY20). With lower capex requirements and strong margin improvement from incremental customers, FCF growth should accelerate. Indeed the Independents Expert report had Vocus’ margins improving from c34% in FY15 to 46% by FY21 in its DCF analysis. There is significant scope for increased utilisation with the network at 16% utilisation at FY15. This is likely the biggest value driver for the business with management looking to increase utilisation by 5-6ppts pa. They can leverage this underutilised asset (plus the asset can grow from the current 4000 buildings to up to 10000 buildings) to sell into the SME market.
Large opportunity to grow in the SME market – Vocus has historically focused on corporate and government customers, while M2 mostly targeted the SME market. Now Vocus now has access to a significantly strengthened sales force to target the SME market with fibre assets. Indeed VOC is increasing its sales team by 35% in FY17 to capitalise on this opportunity (to 147). There is significant potential for the company to take share in the $2.9bn CBD SME market. DB estimates Vocus taking a further 10% share over the next four years in that market equates to an additional ~$300m of revenue.
Potential for NBN-led market-share gains – As the NBN is progressively rolled out, customers will be required to sign up to new contracts and hence there is an opportunity for Vocus to take market share. Vocus improved its NBN market share by 80bps between Dec-15 and June-16, and management has an internal target to increase its share from 6% to 10% of incremental customers by Dec 16 and noted recently that consumer business has 15% market share of new additions vs 7% total market share.
Strong earnings outlook – market has Vocus delivering an EPS CAGR of 21% for FY16-FY19. In a recent trading update they noted corporate & wholesale has exceeded new sales targets in 1Q17, active NBN consumer base has increased by 21.7% since June-16 (+15k vs base of 86k) and VOC’s average $ margin on NBN is consistent with DSL bundles. Management informally comfortable with consensus for FY17.
Key downside risks include:
Merger synergies not being achieved – see this as a low likelihood given recent confirmation of expectations at the result
Competition driving down ARPUs or market share – this is a risk but VOC is better insulated and confirmed recently that VOC’s average $ margin on NBN is consistent with DSL bundles
Poor management of costs leading to margin compression – always a risk but these guys have done many integrations and have executed well to date.
Value-destructive acquisitions – acquisitions are off the table for the short to medium term
Unfavourable ACCC rulings on access charges
Adverse changes in NBN access and usage charges – it is more than less likely that the CVC is reduced rather than increased.
VOC has been sold off heavily recently for any one of a number of potential reasons including:
Heightened NBN concerns which have hit the sector broadly stemming from TPG’s lower than expected FY17 earnings guidance. These concerns centre around margin degradation (as noted previously, less of a concern for VOC given reseller model) and increased competition
Limited visibility into the shape of FY17/FY18 growth (especially with reduced KPI disclosures at FY16 result)
Lacklustre delivered FY16 organic EBITDA growth (per UBS who estimated it to be c6% though the figure is masked by divestments in the period),
Concerns over the pace of decline in voice revenue.
Conservatism around integration risk / synergies.
Resignation of CFO Rick Correll. This has led to speculation in relation to the cultural fit of the organisations as he was from Vocus while the CEO, Geoff Horth was from M2. There has been some churn in the management ranks given the number of transactions undertaken over recent periods.
Selling by James Spenceley of 76% of his holding. Conversely other directors including Vaughan Bowen, Rhoda Phillippo, Michael Simmons and Craig Farrow have increased their holdings modestly.