Small Cap Reporting Season Preview – Part 1

As is traditional, with reporting season fast approaching TAMIM have asked our mangers to provide a quick preview of what they expect and hope to see over this always interesting period. This week the Small Cap team review Zenitas Healthcare, Fiducian Group and Pioneer Credit.

Zenitas Healthcare (ZNT.ASX)

​ZNT EBITDA guidance: $6.6m
TAESC estimate: $6.75m
ZNT’s share price weakness of late has been a key contributor to the fund’s recent underperformance. We have written previously about our thesis for investing in ZNT.

This recent interview with Justin Walters, ZNT CEO, provides an up-to-date summary of the ZNT strategy and opportunity.

As noted in this interview, ZNT has, as of late June, re-affirmed its previous EBITDA guidance and we would expect to see ZNT report in August an EBITDA profit in excess of $6.6m.

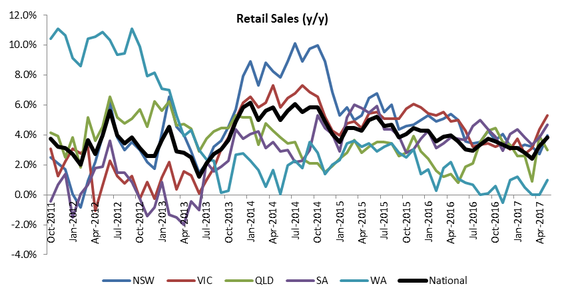
More importantly, the outlook for FY18 would appear positive, with 14 new clinics set to open early in FY18 which are expected to contribute to FY18 earnings, together with other organic growth initiatives that ZNT are pursuing. ZNT’s management are confident of capturing further market share, in a market that is growing at ~5% annually.

We see the current share price weakness as a reflection of the market’s impatience regarding delays in ZNT announcing an earnings accretive acquisition, rather than a sell down based on any fundamental aspect. That reaffirmation of guidance and positive industry and company outlook suggests that the thesis for investing in ZNT remains very much intact.

We have recently met with ZNT’s CEO and understand that a number of potential acquisitions are being progressed, and we are confident that these will add further scale to ZNT’s GP and homecare footprint* (ZNT already owns the largest network of allied healthcare/physiotherapy clinics in Australia). Irrespective of any acquisitions, the company continues to grow organically.

With a market cap at 30 June 2017 of $42m, cash of $9.7m (31 March 2017), undrawn debt funding for acquisitions of $10m and reaffirmed FY17 EBITDA of $6.6m, we continue to see ZNT as a highly compelling and undervalued investment, with material upside.

An increasing focus on 1) the benefits of community/home care as opposed to high cost hospital care, and 2) the potential for integrative health care to assist in the management of chronic disease will support the ongoing growth of ZNT.

*on 3 July 2017 ZNT announced an investment into an established homecare company with a large presence (800+ staff) across the east coast of Australia.

Fiducian Group (FID.ASX)

FID guidance: “expect double-digit earnings growth”
TAESC NPAT (underlying) estimate: $8.5m (22% EPS growth)
Diversified wealth management group FID does not provide earnings guidance; however, it has outlined a double-digit target for earnings growth. FID has achieved double digit annual EPS growth in 13 out of 17 years since it listed on the ASX.

FID appears to be positioned well for a strong full year result:

  •  As at 30 April 2017, FID’s total funds under administration, advice and management (FUMAA) was $5.6b versus $4.7b at 30 June 2016 – an 18% increase over 10 months, with 2 of the strongest months of the financial year for inflows remaining.
  • As at 31 May 2017, FID’s reported funds under management was $1.8b, up from $1.47b at 30 June 2016 (23% increase for year to date).
  • In the second half of the financial year FID has acquired $52m in funds under advice through the acquisition of 2 financial planning networks.

FID’s operating model benefits from significant operating leverage, so these positive developments in relation to FID’s asset management base are supportive of strong earnings growth. In its half year result, FID noted the reduction of its Cost to Income ratio as a result of the scalability of operations.  FID’s reported operating cash flows as at 31 March 2017 are strongly up on the same period for last year.

For the first half of FY17, FID delivered EPS growth of 22% with underlying NPAT of $4m. Based on a continuation of strong asset flows in the second half, FID is on track to deliver underlying NPAT for FY17 of approximately $8.5m (~22% increase).

Pioneer Credit (PNC.ASX)

PNC NPAT guidance: $10.5m
TAESC estimate: $10.5m
​Financial services company Pioneer Credit re-affirmed its FY17 guidance and provided FY18 guidance in early April.

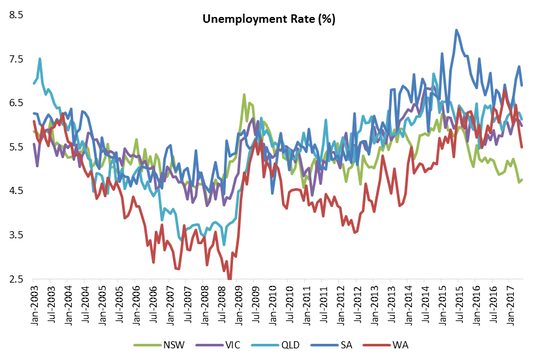
Since then, we understand that collections have remained steady and average payment terms are steady, underpinned by low unemployment rates across Australia and New Zealand.

Pioneer continues to build out its analytics focus, with a team of 12 now working on more sophisticated analysis, new business initiatives and predictive modelling.

PNC has also been busy recruiting staff for its anticipated growth, and while labor intensive, its success rate in recruiting staff has been improving.  PNC’s staff retention is assisted by a strong culture installed by its impressive management team.

Due to the significant investment in training, it takes 5 months before new staff are profitable. All head count increases in back office, finance, risk, analytics, have been factored into Management’s forecasts.

We understand that Management remain comfortable with its disclosed forecasts. Despite a strong share price performance in recent months, PNC’s FY18 guidance of EPS of ~27 cents puts it on a multiple of under 9x, yielding 6% fully franked based on a 50% payout ratio.  We believe this remains compelling for a business with a very strong management team, which is growing earnings at a double digit rate.

Note: All three stocks mentioned here are currently held in the TAMIM Australian Equity Small Cap IMA portfolio.

Being early is the same as being wrong… or is it?

This week Robert Swift examines one of the more costly mistakes of the TAMIM Global Equity High Conviction portfolio so far this year. We still believe the investment thesis for Macy’s to hold but this experience underlines the significance of timing on short-term returns in investing.
Macy’s – too early or just plain wrong?
Robert Swift
Contrarian investing is a great approach as long as you don’t forget that other investors are selling the stock because they think they know more than you. Sometimes they do. A stock you think attractive is cheap for a good reason and the cheapness is an illusion. You’re the ‘patsy at the table’ that other investors want to offload their stock on. Consequently, since we don’t want to be wrong too often, we try to identify cheap stocks with a catalyst – “cheapness AND change”.

Anyone can see that a stock is cheap by using publicly available information on P/E, Price to Sales, or Price to Book. This is not really forward looking analysis at all but a simple exercise in sifting stocks based on historical data. What is harder is to identify the reason for the earnings, the price earnings multiples, and the share price to rise. Cheapness alone is not enough for us. There has to be some change to attract other buyers and for the company’s management to convince us and other investors that they can deploy capital into more profitable projects and return the company to even modest growth. It’s the combination of cheapness and change that works well in a value approach.

We categorise the catalysts in 3 dimensions:

  1. Management change,
  2. Strategic change often with balance sheet change, (disposals and/or acquisitions) &
  3. External/Regulatory change.

Most often one or more of these is the catalyst that drives a share back to favour and the share price higher. It is a well-known ‘problem’ to be too early when you buy cheap stocks. It is a ‘problem’ because the investment can take time to come to fruition since other investors have to change their mind and start to buy the stock. Having seen it underperform for so long it is often hard for them to do so rapidly. This time delay is an opportunity cost (there may be much more fun going on in other stocks elsewhere where the crowd is gathered) and it is important to be paid to wait in the form of an above average dividend yield. Timing the entry point perfectly is hard, but even if we invest a little ahead of the catalyst being evident, we don’t mind waiting a while partly because the dividend yield pays us to be patient. Never forget that a significant part of the total return from equity investing is the dividend yield and not just the share price appreciation!

A stock which possessed cheapness and, we thought, catalysts for change was (and still is) Macy’s (M.NYSE). This is a department store which trades under the brand Macy’s and Saks 5th Avenue. It has not been easy for the company but we see both internal and external catalysts.

Unfortunately, we invested both at a higher price and sometime ago at the beginning of 2017. Six months later the price is lower and while we have collected some dividends, we are ‘underwater’.

So what has gone ‘wrong’ and why are we holding on?
This retail industry is certainly a tricky place to invest right now. You’re either forced to pay sky-high valuations for the stocks like Amazon (>1860 earnings) or Ulta Beauty (35x earnings) that are working on momentum alone or to take chances with potential value traps like Macy’s, Target, or Kroger, all of which have near single-digit valuations, but also don’t seem to have many growth prospects in the near term. Some former glamour retail stocks are at the brink – such as Sears, Abercrombie & Fitch,

What do we see in Macy’s?
The retail ecosystem (landlords and retailers) is now, finally, responding to the Amazon and Alibaba category killers. The weaker players such as Sears have been driven to the precipice but survivors will have more market share available, less competition, and the benefits of having managed against a tough backdrop which means a tight cost structure.

Macy’s will survive and should prosper – at these stock prices we are now getting paid 7% in the form of a dividend yield to wait for the changes made by new management to have an effect on profitability, business strategy and the share price. We also anticipate mall owners to respond to the internet by driving more foot traffic through their doors. This morning we saw this story about a Shanghai mall from the local press.

We are generally underweight consumer cyclicals and believe that the consumer is over-leveraged in the UK, the USA and Australia and doesn’t have much spare income at all. We also watched Amazon and Alibaba roll out their business on the internet; saw the demise of Barnes and Noble the USA bookseller which was the first to be hit by Amazon’s internet book sales, and so waited for the retail carnage to continue driving down stock prices everywhere.

Then early this year we decided to enter the retail industry and purchased Macy’s for the model gobal high conviction portfolio.

Why will Macy’s survive and prosper? What on earth were we thinking?!
Asset value – about half of retail space is freehold and worth considerably more than stated in the report and accounts. The credit card business alone is possibly worth several billion $ since it generates about $700m pa. The value of the company in the stock market is currently about $7bn. It is very likely that the net asset value of the real estate is 3x that.

We think the market is effectively ascribing negative value to the retail and credit card operations and has a jaundiced view of the real estate value. It is a classic contrarian value opportunity and we anticipate that even a stabilisation in store sales will see a rapid reappraisal of the company.

Sales and cash generation – sales per quarter are equivalent to almost the market capitalisation of the business. Put another way the company is valued at about 25% of its annual sales. Cost reductions will flow through to the net income line as long as management can stabilise the revenue numbers once the store disposals are completed. We think they can.

Change is evident in Management action:
Cost cutting and refocusing – New management is cutting unprofitable or marginally profitable stores. Real estate disposals generated over $650m last year which is equivalent to 10% of the market capitalisation. A venture with Brookfield (albeit on a small portion of the asset base) has been signed to optimise the real estate portfolio. Meanwhile total sales fell only about 3%. It’s not the sales at any price margin that are important but making profitable sales that matter. We think it obvious that total sales will fall as the company rolls out a closure programme and news flow on this does not concern us.

New management has a positive attitude to shareholders and has continued with share purchases from the considerable free cash flow.

Reinvesting to grow again – The company is driving foot traffic to stores with new formats such as Spas (Blue Mercury) and discount offerings (Backstage) and digitising (belatedly) their retail offering (check out www.macys.com).

Macy’s online sales are growing in double digits so it’s not like Amazon is the only successful online destination! We believe that general retailers have forgotten that impulse buying is important as is the consequent need to bring foot traffic through the door. The food retailers are currently better at this. Tastings and samplings, price discounts on a seasonal basis, and recipe ideas, all help to create excitement. Why for example do Myers in Australia not hold lunchtime “fashion shows” in their stores to showcase this seasons’ looks and to create additional visits? If you travel and want to see how a UK department store is adapting its space to meet a changing market then go to Fortnum and Masons in Piccadilly in London. The 3rd floor has been transformed from menswear (which is offered in overabundance in other local outlets) to a cocktail bar.

A destination for a quiet drink perhaps while some shopping is done? We did a bit of digging and it transpires it is quite profitable AND popular as a starting point for an evening out.
Macy’s is trying to generate more visitors with its Backstage format and value shoppers are able to shop for discounted clothes and help Macy’s improve stock turn. We anticipate more concepts being rolled out.

External change is occurring – All USA malls are adapting to the online impact (finally) so the 50% of leased space that Macy’s have is likely to piggy back that. Macy’s has stores in over 70% of malls categorised as A grade so since these will survive and fight back…Macy’s should do alright. We would be concerned if they were predominantly in B and C grade malls.

The metrics to measure management success are no longer total sales growth or like for like sales growth, but sales per employee and free cash flow to pay dividends and invest in digital platform.

Lacklustre sales growth on a like for like basis is spooking some investors but it shouldn’t be the metric to define success. We continue to judge the transition as being successful if we see the following continue:

  1. Continued asset disposals producing net gains to the profit and loss statement, thereby maintaining the strength of the balance sheet and proving the conservative carrying value of the real estate in the books.
  2. Free cash generation net of continued investment in the digital platform
  3. Sales per employee continuing to rise

The Lendlease Income Opportunity

Following on from our previous discussion of income versus capital as a source of portfolio return Scott Maddock and the team at CBG, of the TAMIM Australian Equity Income IMA, look at Lendlease (LLC.ASX).
The Lendlease income opportunity
Scott Maddock

LLC is a leading development, construction and investment management business, operating in 9 countries. We believe the company is positively leveraged to global economic activity. Operationally the company has been on a path of continuous improvement since their last major construction losses in 2004. Delivering a strong operational track record, generating 14% ROE. We expect LLC to have net cash within 18 months (5% gearing currently).

The current dividend does not seem high at first glance; however, LLC has a history of paying excess cash to shareholders – notably following the sale of a major Shopping Centre development for $1.3bn in the UK in 2014. We feel LLC will have the opportunity to deliver more cash to shareholders as current projects mature.

The Australian housing cycle is a fixation for most of us and we assume all our readers have a strong view regarding the near-term path of housing prices. We feel it’s clear that as housing construction activity peaks in Sydney and Melbourne this year, that housing prices will also peak. This process is assisted by controls on bank lending – both internal and those imposed by the bank regulator, APRA.
In this context, many would say LLC is a risky investment – and that’s true to an extent – contracting and construction businesses have inherent risks which we do consider. However, the housing cycle is less of a risk than you would think at first glance;

  • LLC’s exposure to Australian apartment earnings peaks this year at only 20% of group earnings.
  • Developments are 80-90% (and higher) pre-sold and most purchasers (especially from overseas) are holding a significant unrealised profit. This suggests there will be a low final payment default rate as buildings are completed.
  • Even during the GFC both LLC and Mirvac Group observed less than a 3% default rate, recently defaults are running at less than 1%.
  • Lend Lease’s apartment construction business includes projects in the UK and USA, further diversifying the sources of likely cash flow.

In summary, our investment thesis is that LLC has invested ahead of the economic cycle, has significant pre-sold revenue for work in progress, with buyers having paid 10% deposits and sitting on capital gains – therefore significant defaults or losses for LLC are unlikely. We expect that as most projects are finalized during the next twelve months (see table) we will see significant cash generated. Since LLC has relatively low levels of debt, cash should be available to increase dividends or potentially allow a capital return.


Source: Lend Lease company filings

Source: Lend Lease company filings
Just as importantly LLC earnings will benefit from growth in construction activity in Australia – particularly in road-building and related infrastructure. The company has also been increasing capital employed offshore. Capital allocated internationally is expected to increase from 23% of total to 30-50% as LLC apply their expertise in Urban Renewal projects around the world.

We believe valuation remains attractive vs. history and global peers, on a 12x forward PE vs 17x for similar global listed construction companies. LLC is likely to deliver more cash to shareholders along with a positive share price return.

At 5 July 2017

Mid-year Australian Update – Have we turned the corner?

This week Guy Carson provides a mid-year-update to his 2017 Outlook for the Australian economy. Have things been playing out as expected in the two-speed economy or is there more yet to come?
Mid-year Australian Update – Have we turned the corner?
Guy Carson
At the start of the year, in our 2017 Outlook, we wrote about our concerns over the two speed nature of the Australian economy. Our fears seem to be largely playing out through the first quarter as GDP came in at a very soft +0.3% q/q and +1.7% y/y.  However, as the year has progressed a few things have surprised us, primarily the strength of the Australian job market and as a result the recent rebound in consumer activity. The strength of the Western Australian job market in particular has been a significant surprise. Given this new information at hand, it seems worthwhile to revisit our views.

The change of course for the Australian economy seems to have started around March when the employment data took a significant turn for the better. Over the three months starting March we saw employment gains of 60k, 46k and 42k. For a steady unemployment rate a figure of around 15k is needed to keep pace with population growth. As a result the unemployment rate has fallen from 5.9% to 5.5%. The biggest improver somewhat surprisingly has been Western Australia where the unemployment rate has fallen from 6.5% to 5.5%. The other main improver is New South Wales which continues to have the lowest unemployment in the country.

Source: ABS
With lower unemployment, we have started to see an improvement in retail sales over the last two months. After a steady decline since 2014, national retail sales have rebounded significantly in the last two months up 1.6%. Western Australian continues to lag the other states but there is some sign of life.

Source: ABS

These are positive turnarounds, more people with jobs leads to increased consumer spending and increased economic activity. Whilst GDP is a near impossible number to predict, we can say the foundations are there for a rebound in the June quarter. Hence the question we get is have we turned the corner? Are we out of the woods yet again?

At this point, we are not confident that these positive signs will be maintained. Yes, near term economic signals are positive but for us three key structural challenges remain. These challenges are:

  1. Record low wage growth.
  2. Record high household debt.
  3. An unprecedented building boom that appears to be softening.

Despite the strength in the labour market over the last three months, we are yet to see signs of wage pressures. In fact wage growth has declined steadily in Australia since 2012 and is currently running at its lowest level on record at 1.9% year on year. During this period we did see a significant decline in unemployment in 2015 but even this did little to stop the wage trend. The current bounce in the employment numbers would therefore, in our opinion, need to last significantly longer to have an impact.

Source: ABS
​Low wage growth is a major problem. This is particularly true when combined with record household debt. Recently the cost of that debt has started to rise. Due to the intervention of regulators, the banks have announced significant interest rate hikes for interest only loans (due to come into effect this month). The intention of these hikes is to get property investors to switch from interest only to principal and interest. The net effect will be slightly increased total payments. A small increase on a large amount can have a big impact and, as we have written about previously, Australian household debt to GDP levels are currently the second highest in the world (according to the Bank of International Settlements) and above the peak that the likes of Ireland and Spain saw before the GFC.

Source: Bank of International Settlements

A majority of this debt sits against residential property which has been a key driver of the Australian economy in recent years. In response to the end of the mining construction boom, the RBA began to cut interest rates in 2011. All up they have cut rates from 4.75% to 1.50% and have seen off a recession we most likely would have had otherwise.

The interest rate cuts have enabled households to borrow more. In turn this has led to house price increases and higher house prices have led to greater incentive to build. The residential construction industry has as a result boomed, primarily across the East Coast and primarily in apartments. The RBA has effectively replaced a mining boom with a property boom.

There is a considerable amount of research around about the impact of residential construction booms. The Bank of International Settlements has warned against cutting interest rates to boost asset prices and the consequences that it can have. Regular readers of ours will also know about Edward E. Leamer’s paper “Housing IS the business cycle” where he paints residential construction as the major cause of economic recessions. One of the key points that Leamer makes is that “house prices are very inflexible downward, and when demand softens as it has in 2005 and 2006 [in the US], we get very little price adjustment but a huge volume drop. For GDP and for employment, it’s the volume that matters.“ So whilst most of the commentary and focus remains on Sydney and Melbourne house prices, we would suggest that people need to be more focused on the volume and here we are starting to see potential signs of a decline in construction activity.

The chart below looks at residential building approvals, commencements and completions on a national level. From this data we can see that building approvals act as an excellent indicator of building activity and they are showing signs of rolling over. If we were to see a continued decline in approvals from here we will start to get very nervous. Typically commencements follow approvals closely and completions tend to peak 6-9 months thereafter.

Whilst the decline is a on a national level, there are certain areas that are leading the fall. The below chart looks at apartment approvals on a rolling annual basis. There are two interesting things to note. Firstly all of the four states that experienced booms are off their peaks, and secondly there is real pain set to come for apartment developers in Queensland.

Source: ABS

With the residential construction boom potentially coming to an end, there will be a growth hole to fill. The RBA cut interest rates by 3.25% to fill the hole from the mining boom, but now with interest rates at 1.5% they have significantly less fire power. Which begs the question of how the RBA would deal with a prolonged slowdown?

The counter argument to our assessment of the residential boom is that due to record immigration levels, current building levels are rational and must be maintained. We take a slightly different view and would suggest that immigration may have a component that is pro-cyclical, i.e. people will move to where there is work. On that basis, it’s the building work drawing people here and not the people moving here that is forcing the building work. On this point we would highlight that Iceland, Ireland and Spain all had record immigration in 2007 and we probably don’t need to remind people what happened in 2008. For Australia, whilst immigration has remained high over the last decade or so, there are three clear surges. These surges occur with both stages of the mining boom (pre GFC and post) as well as the recent residential construction boom.

In summary, the last few months has seen renewed energy from the Australian consumer and that could provide some short term relief to sectors such as retail and financials. However, when we invest we take a longer term view and believe the risks to the downside outweigh the upside for these sectors. As a result, we continue to focus our efforts on finding companies with structural tailwinds, global earnings and strong value propositions. These companies should be able to grow and prosper despite an uncertain domestic economic environment.

New financial year – Asset allocation update

Robert Swift provides an update on his stance on asset allocation having just ticked over into the new financial year.

An update from our asset allocation models.

One of the most important decisions is how to allocate your money across different asset classes – property, bonds, equities, or cash. This is because a combination of these assets will be less volatile than simply holding equities, and the returns, although lower, will be safer and reduce the chances of a nasty surprise to your pension pot.

Summer in the Northern hemisphere often brings with it dull markets – the “sell in May and go away” expression is routinely trotted out for a good reason! Fewer investors at work, fewer company announcements and a long break for politicians, makes for a lack of news flow.

In the absence of news, markets tend to drift lower. Will it be the same this year?

We first wrote on asset allocation four months ago and thought it was time to revisit the landscape using our asset allocation models.

Our conclusions then were:
Equities – overweight especially Value
Bonds – underweight especially net debtor countries such as Australia, Turkey, Spain
Property – residential is overpriced and liable to be taxed by governments keen to spend more of your money. Be careful of yield hunting.

How did we do?

We did ok and you would have made money following the recommendation.

Most European equity markets have drifted a little over the last month, after a strong few months, but the US has continued upwards, as has Japan and a number of Emerging markets like China. We have held a strong Value bias in equities for a few months now and have been wrong in this regard.

​Growth styles, and the ‘sexy six’ have performed exceptionally well. We aren’t changing our view on this and still recommend a Value tilt in an overweight equities position.

Our Tactical Asset Allocation model continues to like equities overall, and still prefers them to Bonds.

Other asset classes to consider currently are:

Overweight Equities

  • Prefer Value style, with dividends and high free cashflow yield
  • Prefer Financials, Cheap Tech, Telecoms

Underweight Advanced Economy Government bonds.

Equal weight Emerging Market bonds (China, Asian & Middle East issuers) but avoid South Africa & Brazil

Underweight commodities especially oil

Underweight residential property (including Australian banks). Prefer industrial and retail in Asia

Given the inexorable rise in debt (see the chart above) over the last decade, and the decline in interest payable on it, as a consequence of central bank intervention in fixed income markets, the question you have to ask yourself with bonds is: – “Why should I lend money to governments at 2-3% when there is so much debt already outstanding?”

We wouldn’t! We might at 6%.

Looking at the charts below it appears to us that the only value in bond markets is to be found in certain emerging market bonds. These are bonds issued by net creditor emerging market countries and they still offer returns of 5-6% (LH Scale on left chart) which is a reasonable return. Avoid bonds with negative yields and those issued by governments which are heavily indebted already. (Right Hand chart)

Central bankers and politicians are the greatest larcenists of all time and will use inflation to erode your purchasing power. The chart above tracks cumulative inflation over the last 100+ years. Most has occurred since the rapid issuance of government debt for ‘welfare states’ and the constant temptation to monetise this and reduce the liabilities aka your savings!

Inflation hurts bonds more than equities where companies can, usually, pass on cost price increases and whose asset values rise in line with inflation.

Near term risks and what to watch

Purchasing Managers Indices – widely followed data as an indication of near term economic activity – have recently showed slowing activity. If this continues over the Summer this may see medium and long term interest rates move down and bond prices move up.

After a good first half of the year we may well see some pause or setback in equities, but they continue to be the preferred major asset class for now, given that we are currently in a broad synchronised global upswing in global economic activity.

Within equities, across the regions we continue to prefer Europe which is exhibiting its best growth since the financial crisis in 2008. Emerging markets are also now looking attractive both in terms of valuation and price action. The USA is the market where we continue to struggle to find value in stocks. The rally there has been very narrow there in the top hot tech stocks – Apple, Facebook, Google, Amazon – when you strip those out – the US market advance has not been widespread.

From the chart above you can see that Value stock returns have fallen relative to Growth stocks.

Value stocks have been disappointing for sure this year but we continue to believe that the focus on just a few big stocks in major indices has been excessive. Meanwhile some very good companies such as Daimler, Glaxo SmithKline, China Mobile, Legal & General, JP Morgan, Itochu are on modest PE ratings and with dividend yields in excess of 4%, will find favour.

The market may be a voting machine in the short run, but it’s a weighing machine in the long run. Now is the time to favour companies paying sustainable dividends, with asset backing. Now is the time to ensure your portfolio is set to take advantage of these coming market changes!