This week we take a look at the Brisbane property market. Is there an opportunity to be had or should we continue to flee the sinking ship?
With the Australian cash rate at a record low, over the last 8 years we have seen a boom in property prices across the East Coast. Over this period, residential property prices have risen by roughly 100% across Sydney and Melbourne, creating what many speculate to be a property “bubble” – pricing out millennials and leaving little room for new investment. However at TAMIM we believe this provides a unique investment opportunity, especially in the Brisbane apartment market. In order to understand why, it’s important to first take a look at a brief history of the Perth property market.
Perth
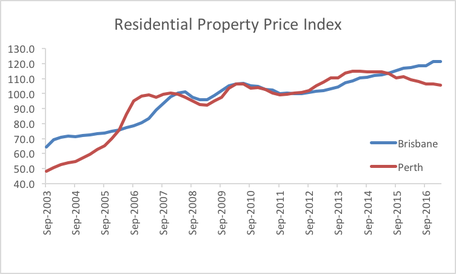
The Australian mining boom started around 2005 and continued into 2015. During this period, there was a large influx of migrants into WA, with the number of full-time employed persons increasing from 718,300 in December 2004 to 976,700 in December 2013. The period from 2013-2016 saw the estimated resident population of WA grow at a rate almost double that of Australia’s (28.4% and 18.4% respectively). A rapid influx of workers resulted in an increased demand for residential property, triggering a Perth housing boom. Perth’s Residential Property Price Index (RPPI) – an indicator of price changes in all residential dwellings – skyrocketed during the mining boom, from 48.3 in September 2003 to 98.4 in December 2006. However once the boom was over around 2014, the RPPI started to track downwards from its December 2014 peak of 114.5 to its present value of 105.5 (chart below).
Source: ABS
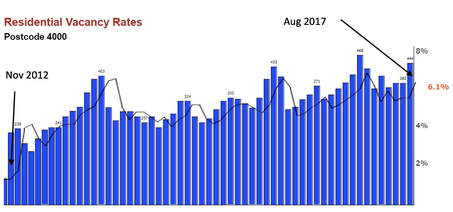
As people emigrated, the end result was an oversupply in the property market, which saw a decrease in prices and drastic increase in residential rental vacancies from approximately 2% in January 2012 to 4.6% in August 2017.
Source: SQM Research
Brisbane
We believe a similar situation has already started to unfold in the Brisbane apartment market. Similar to Perth, the Brisbane economy is heavily influenced by the mining and resources sector. In November 2016 approximately 20% of the Brisbane workforce were employed by the resources sector. Despite the imminent end of the mining boom, there are an estimated 5,200 apartments under construction in Brisbane CBD alone due for completion over the next 5 years, with another 3800 approved for construction. Major developments such as the Queen’s Wharf Precinct are adding 2,000 apartments to the residential market. Vacancy rates in Brisbane CBD have increased from roughly 2% in January 2013 to 6.1% in August 2017. Combined with relatively lower estimated resident population increases when compared to other capital cities such as Sydney and Melbourne over the past few years, all signs indicate that a stagnating demand and increasing supply have resulted in a supply glut in the apartment market.
Source: SQM Research
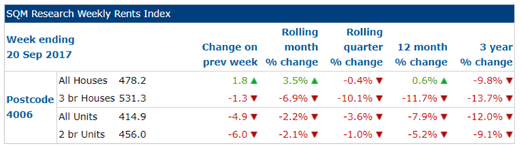
This trend is starting to emerge as some inner Brisbane suburbs such as Fortitude Valley (postcode 4006) have already started to suffer a fall in median unit prices. From July 2016 to June 2017, the median unit sales price for units had decreased roughly 7.78% from $450,000 to $415,000 (Source: RP Data). 64% of this decline had occurred by December 2016, as vacancy rates rose to over 6.5%. Furthermore since 2015, suburbs sharing the 4006 postcode have seen a staggering amount of apartment completions – over 2000 completions excluding the stage 1 completion of a 650 apartment complex and stage 1 completion of a 922 apartment complex. During this period, apartment rental incomes have plummeted as can be seen below.
Source: SQM Research
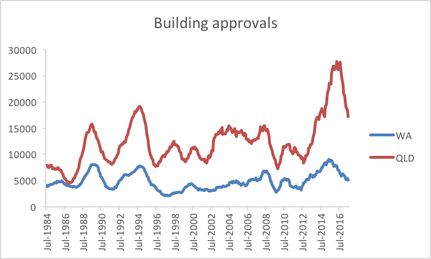
Building approvals for private dwellings excluding houses across Queensland and WA have recently reached all-time highs. In Western Australia, apartment building approvals –which are a lead indicator of construction activity – peaked in June 2015, signalling the end of a construction boom. With Queensland’s peak trailing behind WA – August 2016 – the outcome looks all but disastrous (chart below calculated on a rolling annual basis). Increasing vacancy rates, declining rental income and a large number of approvals and completions are all symptoms of an oversupplied apartment market.
Source: ABS
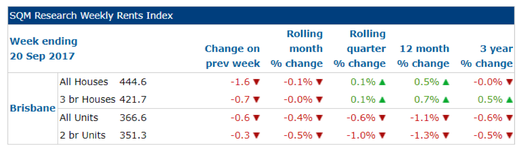
Despite our view that there is an oversupply, property prices can still be driven upwards by two factors – interest rates and rental income. As TAMIM Australian Equity All Cap Value manager Guy Carson mentioned in an earlier article, the RBA are not in a position to decrease interest rates. Australia has the second most indebted consumer in the world with respect to Household debt to GDP. When coupled with record low wage growth, this makes the Australian consumer sensitive to interest rate changes. Since decreasing interest rates isn’t a likely option, it is unlikely that monetary policy will drive prices up further. In addition, a decrease in rental income generally indicates an oversupply of apartments and/or insufficient demand. This extends to property prices and as such, dwindling rental income across the Brisbane region (table below) is likely to further suppress prices.
Source: SQM Research
The question is, how do we obtain value? Our view is to wait for an inevitable correction and investigate areas with strong fundamentals such as large infrastructure spend on education. Queensland Deputy Premier Jackie Trad stated it is “Expected that 3000 extra students will move into inner-Brisbane in the next 5 years”. Capacity constraints in inner-Brisbane state schools such as the West End State School have required an expansion of the school as well as the construction of a new school in South Brisbane. Now, whilst the potential increase in demand is heavily outweighed by the upcoming supply, indicators such as this compel us to further investigate these suburbs and their surrounds.
Ultimately, when investing in property, we want to invest at a price lower than the fundamental value and understand the dynamics of the area we are investing in, especially when identifying triggers that may boost demand e.g. infrastructure spend. As a result, we look towards apartments in inner city Brisbane – an oversupplied area with the potential for stronger, future demand. In our view this correction is inevitable – it’s no longer a matter of if, but when and then we should be ready and willing to buy!
This week the small cap team take a look at the importance of a good management team when investing in a company. They take the time to spell out exactly what they look for when considering management.
Summary:
In our experience management quality is arguably the number one determinant of a company’s long term success. We believe this is more leveraged in a smaller company because each strategic decision can have a larger impact on the future of the business from a relatively lower base. This means getting to know management is an essential part of our investment process. In this article we discuss what we look for in a high quality management team.
Why management are so important in smaller companies?
We believe management quality is the most important single factor to get right when investing in a smaller company for the long term. There are a number of key reasons for this:
Management make the strategic decisions which will determine a company’s long term growth prospects or lack thereof;
Management set the tone for a company’s culture – all employees are guided by management thinking and behaviour;
Employee turnover will be directly impacted by the quality of management – as the saying goes; people don’t leave companies, they leave bosses.
Management are the face of the company in financial markets and investors will ascribe a higher value to high quality management teams and vice versa;
Ethical management teams provide effective risk mitigation against a multitude of risks including fraudulent behaviour, misrepresentation, insider trading, etc.
The list could go on. Suffice to say, picking the right management teams to invest in is an important part of our investment process. Now onto the factors we look for in high quality management teams…
1. Clear communication regarding strategy
In our experience, it is best if management can explain their strategy to investors simply and clearly, and without the use of too many words. This elevator pitch concept is a great way of filtering out complex business models as our best performing stocks have almost always been simple and easy to understand businesses. We believe the simpler the business model to understand, the less moving parts in general, and thus the less unforeseen risks lurking in the background.
Stock example: Joyce Corp (ASX:JYC) management are great example of a clear communicating management team. Whenever we meet management or read through the company’s investor presentations we are 100% clear on where the business is going longer term.
2. A long history of successfully working in the business
We like to invest with management teams who have worked their way through the ranks of an organisation over an extended period of time. These types of managers tend to understand the business better than newcomers who go straight into a top level executive role. And importantly, long term managers will have seen the business through different economic cycles, and thus tend to understand what needs to be done to manage sustainable long term growth.
Stock example: Pioneer Credit’s (ASX:PNC) CEO and founder, Keith John, has been working in the business since the company’s beginnings and in our opinion knows everything there is to know about his business.
3. Shareholder friendly
We are looking for management teams who will put their shareholders first which tends to reflect itself in:
Paying dividends when it is in shareholders’ best interests.
Returning capital when it is in shareholders’ best interests.
Regularly consulting with shareholders for honest feedback.
Factoring shareholder feedback and interests into strategic thinking.
4. A passion for the business
This one seems obvious but it is relatively unusual in our experience. We like to come out of management meetings inspired by management’s energy in the room, and with the feeling that management are having fun in their job. This can only really be gauged through face to face management meetings.
Stock example: (We will need to keep this stock’s name confidential so as not to cause offence.) We recently had a meeting with a management team who were clearly down in the dumps about their business prospects. And importantly, their energy had turned negative after a difficult year whilst their thinking had become defensive. We left the meeting exhausted by the negative energy from the meeting. This is clearly the opposite of what we look for.
5. Humility
We have found ourselves increasingly aware of how humble (or not) management teams are in recent years. In hindsight, this can be explained by our belief that that the least humble, most arrogant management teams have tended to disappoint us over the long term, whilst the most humble management teams have tended to perform the best. There is a great Conversation article on this subject (see website link in references) which confirms our sneaking suspicion that humility in management tends to correlate with long term stock out-performance, and goes on to explain that it is remarkably hard to find humble CEOs these days for the very reason that they have reached the top of the corporate ladder by being highly confident:
“CEOs tend to score higher than the general population on personality attributes such as achievement-orientation, ambition, assertiveness, and risk-preference. Individuals with some, or a combination, of these traits may be particularly adept at pretending to fit ideal criteria for a specific role. For instance, studies show that narcissists are particularly skilled at appearing charismatic at first sight. Charisma, in turn, has long been considered a desirable feature of CEOs. CEOs perceived as charismatic, accordingly, receive higher pay. Genuine humility may thus be a scarce personality feature among candidates for CEO positions.”
- The Conversation, August 2017
6. Skin in the game
In recent years having skin in the game has become a widespread market expectation as the empirical evidence shows that companies run by management with significant stakes in the business significantly out-performs over the long term:
We concur, and aim to invest alongside management teams who are significant shareholders in their business.
Conclusion:
Finding the right management teams to invest in takes a significant portion of our time. In our experience, picking the right company leadership is highly likely to have positive knock on effects throughout the companies being invested in. As a result, we believe time spent looking for the best of the best management teams is time well spent.
Robert Swift presents his views on myths about deflation, Amazon and Socially Responsible Investing, and some folks that died a few hundred years ago.
Prices, bad policy, Amazon, socially responsible investing and Thomas Hobbes – how on earth are they connected and why should I care? Robert Swift
Capitalism works because companies are free to enter and leave businesses. Labour is also free to move from one activity to another. Returns on capital, human and physical, are then mean reverting in that more competition and capital enter attractive businesses and vice versa. The modern version involves government regulation and redistribution but the principles are roughly the same. We would argue that the last 20 years has seen too much government and government agency involvement, and it is that encroachment, including too many rounds of quantitative easing, that is a primary cause of the wealth and income inequality which is in turn the source of so much dissatisfaction.
The natural state of affairs in capitalism is for prices to fall. These falls in prices drive companies to create new products and to do existing things better to maintain returns on capital. Falling prices are good for consumers since their incomes go further. The drive to create new products is beneficial for all because the capital expenditure and R&D, to create new products and services, drives employment and productivity. Real, or inflation adjusted, growth in productivity is strongly associated with dividend growth from equities. Investors receive dividends and should like them to grow in real terms. In summary the whole thing hangs together and while it has occasional problems it has created significant advances for everyone. To mis-quote Winston Churchill, “Capitalism is the worst possible system for an economy, apart from all the others”.
At the moment though there is a desire, by central banks, to create inflation as though this is going to suddenly produce stronger, more equitable and sustainable, growth, more wage increases and generally lead to a much improved future. The argument is that higher nominal growth facilitated by this inflation, will allow us to reduce the burden of the debt relative to the size of the economy.
The truth however is that if inflation returns, and there are clear signs that inflation expectations have returned in asset prices in some countries, then we are actually in for a rough time. It is arrogant to assume that exactly the right amount and the right sort of inflation can be achieved through constant tinkering.
Let’s try and bring some myths about inflation down to earth first.
1 – Deflation is bad…
The first myth is that deflation in goods and services prices is bad. Not true. In a paper from economists at the Bank for International Settlements in March 2015, (Borio et al) they conclude that:
“…once we control for persistent asset price deflations and country-specific average changes in growth rates over the sample periods, persistent goods and services (CPI) deflations do not appear to be linked in a statistically significant way with slower growth even in the interwar period. They are uniformly statistically insignificant except for the first post-peak year during the post war era – where, however, deflation appears to usher in stronger output growth. By contrast, the link of both property and equity price deflations with output growth is always the expected one, and is consistently statistically significant.”
There are other papers out there from existing and former BIS staff and, since they are truly independent from central banks, we believe they are having a prod at what they believe is poor policy.
In short, deflation in goods and service prices is not a problem, but asset price deflation is very dangerous and asset bubbles need to be avoided. Guess what endless rounds of QE have done? Yup that’s right – created a variety of asset bubbles which are now dangerous to prick. You couldn’t have got a worse response to the GFC than a decade of zero interest rates and central bank interference in capital market prices! Well done lads, you have brought about the very condition which under no circumstances should you allow to occur. Not only have you allowed it to occur but you were cheerleaders for it. Enjoy academia and the lecture circuit while we pick up the pieces from the results of your unelected experimentation.
2 – Deflation hurt Japan
The second myth concerns deflation and economic performance in Japan. We have endured endless ‘animated discussions’ about how Japan has ‘suffered’ from years of deflation and it has been a lost 25 years since their equity market bubble popped. All they need in Japan is a little more inflation? This is another myth to be dispelled. Japan has actually been one of the better performing economies when adjusted for demography – it’s not the price deflation that is the cause of low levels of nominal economic growth, it is demography. Once you bother to adjust for demography and for inflation, then Japan has been one of the better performing economies. There have been mistakes but it’s not deflation at fault. Do the same adjustment for the UK and Australia and you get a rather less impressive picture of economic performance. Adding to population will of course grow nominal GDP since that is how the statistics are calculated, but in per capita terms it is not quite so good. You need productivity growth. In the immortal words of Michael Caine “Not a lot of people know that”. Using Japan as an example of the perils of deflation is mistaken.
3 – There is no inflation…
The 3rd myth we want to dispel is that there is currently no inflation. There is and worryingly it is in the form of inflation expectations for asset prices, especially in those countries most burdened by debt. Once inflation expectations are rampant then it typically requires a nasty recession to bring them back. The places most indebted are also most likely to have a problem if things go ‘phut’ since their currencies are also likely to come under downward pressure which will trigger further inflation. They really actually do not want inflation expectations to build further! Many official inflation indices exclude property and asset prices and consequently central banks and politicians turn a blind eye to clear evidence that asset bubbles are forming because there is no visible evidence of a problem. It is always ‘someone else’s problem’ and asset bubbles get ignored. Thankfully this time round USA banks are going to be better at self-regulating and we applaud reductions in auto loans as an example but really, you do want your civil servants to be better, smarter, and braver. More of that when we refer to Thomas Hobbes later.
Amazon
So why do we have a problem with Amazon, or rather the system that has allowed Amazon to flourish? It has been responsible for driving down prices and driving a lot of physical retailers to the brink. It has been a spectacular success and all credit to them. If we believe goods and services deflation is a healthy aspect of capitalism then why does Amazon concern us? “OK”, says almost everyone, “so you like price deflation then why is the price deflation threatened by Amazon so bad in your eyes, and the stock prices of supermarket companies is justifiably walloped when Wholefoods, now an Amazon supermarket, cuts prices?” If Amazon did indeed create a better strategy, then other companies need to learn to fight back or, replace management who can or, be replaced by companies which can. This is true.
We actually think that Amazon is a great business but that its success lies less in its skill and strategy and more in its tax planning and the inadequacies of the current corporation tax system. Amazon pays a fraction of the corporation tax that its competitors pay and consequently has more retained and free cashflow available to reinvest back into a price reduction and volume strategy. Its tax policies are common practice and there are many versions, but it is currently legal and produces remarkably low rates of tax relative to headline rates and to what their competitors pay.
It is the absence of a level and fair playing field that concerns us. Once the high street retailers decide they can’t compete and close, then local municipalities lose their revenues from the tax base and the multiplier effect means other business on the high street suffer too, such as cafes and restaurants. Amazon is the Death Star in retailing propelled by clever tax planning and the tacit support of bureaucrats who need to wake up and be braver in changing and uniformly applying policy.
Until this anomaly in taxation is removed there will be no level playing field and the creative destruction of capitalism will be mostly destruction because of the inability of competing firms to fight back while hampered by unequal taxation and less retained cashflow. A global arbitrage whereby larger companies can pay minimal tax hampers smaller companies which cannot do this and the importance of smaller companies in providing employment is well documented. We are on the way to a monopoly in certain areas of economic activity because our civil servants haven’t woken up to the need to bring accounting and policy into the internet era; if they are awake they aren’t brave enough and they are not performing their part of the bargain in what is known as the Social Contract. This will also be referred to later under Thomas Hobbes.
We would actually prefer all companies paid less tax but if you do want to raise tax from corporate activity, at least make it roughly equal and then companies compete on innovation, service, value for money, and execution of strategy? That is capitalism but what we have right now is biased.
We find it bemusing that Australian investors can be so keen on Socially Responsible Investing Principles (SRI) and see no problem with divesting from coal mines, that provide employment, on the basis that is anti-social, yet remain invested in companies that are frankly anti-social in their active and complex planning to avoid paying what everyone else does. This non-payment of course places a burden on either others to pay more or services to be cut. Does no one else find the Google BHAG “Do no evil” ironic?
Governments love bribing you with your own money and so like raising lots of it. We suspect that governments desperate for revenue, will be looking at non payment of tax in quite a lot of detail. We would prefer they went after companies rather than individuals because we as individuals already pay quite a lot, but that requires bravery. This is a serious risk to Amazon and other companies, and let’s hope our bureaucrats and politicians wake up to the internet era, and to their role in the Social Contract.
So finally, who was this Thomas Hobbes fellow we have referred to above, and what did he say? What is this Social Contract? He was a philosopher who lived in the 1600’s which in the UK was quite a time of political change when the King was beheaded and Parliament declared supreme; to be followed by the restitution of a reduced monarchy. His argument was that individuals should cede some of their rights to a collective, the State, in exchange for sensible regulation and protection. This came to be known as a ‘Social Contract’ and the idea was developed by others such as John Locke and even by a Frenchman Jean Jacques Rousseau in the 1700s. (The latter had the quaint notion that ordinary people didn’t know their real will and required a supreme Legislator to tell them what they really wanted. And there you have the source of the clash between the French and the Brits today over the EU, the EU Commission, and Brexit and what democracy really is!)
The point about the Social Contract is that it is a deal whereby citizens believe that their elected (and unelected) legislators will be looking out for them. No one likes to feel they are stranded at the bottom and especially not that their children will not be better off than they. If this social contract continues inviolate then the system of capitalism will carry on with the occasional hiccup as it has for a few hundred years. If this contact is broken and the bureaucrats stuff up with very poor policy and/or become beholden to the corporations, then we are in for a problem. We fear this contract is at risk and this is the source of the political changes (or ‘populism’ if you are a ‘liberal’ and want to sneer). We believe folks have been quite patient but have finally snapped and that we could see either a return to sensible policies or something more dangerous. We currently look at the capital markets, wealth inequality; economic and social policy and give the bureaucrats and politicians a ‘Fail’ grade. We wish them to stop trying to set asset prices. We wish them to bring corporate regulation and policy up to date so we have a level playing field. We wish them to reduce social engineering and create equal opportunity but not equal outcomes. Once they have done that – we wish they would then make themselves invisible. As Ronald Reagan said “Government isn’t the solution, it’s the problem”
And that is how we managed to mix our views on myths about deflation, Amazon and Socially Responsible Investing, and some folks that died a few hundred years ago.
As a small cap portfolio manager we are in the business of investing on behalf of others. While investing may be a simple concept it is never easy in practice. We highlight a number of key lessons we have learned over the past decades that you can apply to managing your own portfolio.
“Ultimately, nothing should be more important to investors than the ability to sleep soundly at night.” – Seth Klarman
Lesson 1: Focused portfolio strategy
Whether you are a professional or part time investor, the key take away we have learned over the years is that you always need a plan. This plan is what we like to call our investment strategy and our investment process is the discipline we use to successfully achieve our strategy. One of the great benefits of having a focused and disciplined process in place as a portfolio manager, is that you are always somewhere on the investing learning curve. This means you are constantly learning from your mistakes and working against your emotions to ensure that you are benefiting from the market’s behavioural biases, rather than following the herd and falling into the same traps. Your mistakes and successes should continuously be incorporated into your process.
Without a plan or a documented process, it is hard to maintain focus on what you are trying to achieve. It is arguably more challenging for individual investors to find the necessary spare time and energy required to consistently maintain this discipline but it is vitally important to your success as an investor.
Lesson 2: Risk controls
As a professional investor we believe you always need to consider a worst case scenario in order to have the appropriate risk controls in place:
We have met many great individual investors who are no doubt well versed in risk control, but in our experience controlling risks tends to be a lower priority for the vast majority of individual investors as it is arguably the least “fun” part of investing. As an investor you should work on understanding your risk environment and whether your comfortable with this in the context of the returns you may be able to generate. For us, the portfolio management team, our key focus is avoiding capital loss as this is what we define as our key risk. What is your key risk?
Lesson 3: Understanding management exposure
In our experience, getting to know and understand management makes a significant contribution to understanding the fundamentals of a business. This is not a case of receiving non-public information, it is a case of understanding the thinking behind management’s strategy and vision for a business.
As portfolio managers we have the resources (and time) to access management for one-on-one meetings, and to attend management roadshows and presentations. These opportunities may not be generally available to individual investors however this may be changing as technology improves information and digital access is becoming increasingly available. At the very least you should have an understanding of who the management team is, their history on delivering on their stated objectives and what their forward looking plan for the business is.
Lesson 4: Stress Less
The feedback we generally receive from investors is that they find investing stressful at times. In small cap investing this could be for a number of reasons:
The universe is enormous with well over 2,000 ASX listed smaller companies to pick from;
Many smaller companies are concept stocks and don’t have revenues or earnings which makes valuing these businesses challenging;
It takes a lot of time to truly remain on top of how a business is evolving over time.
As discussed above, by having a focused strategy and process for investing as well as understanding the risks you are willing to take on, you are able to reduce your stress levels. We have learnt over the years that by accepting you will make mistakes and having a process in place to minimise the negative results of those mistakes you are able to invest with a clear and focused mind. Your other option is to find a professional investment manager to carry these stresses for you.
Lesson 5: Understand Liquidity
We are all aware that markets can remain irrational for longer then we would normally expect. However sometimes we all need to exit our investments due to unforeseen events. When this happens it can be challenging to know when to sell a holding given stock prices tend to move around. By having a clear understanding of the liquidity profile of your investment and having a plan to deal with unforeseen circumstances you will be able to improve your investing results.
Conclusion
While we have been professional investors for decades, we acknowledge that when it comes to investing you are always learning. It is important to keep an open mind, learn from your mistakes and always challenge the commonly accepted thinking of the day. As we have said on many occassions you need to remain actively engaged with you investment portfolios to ensure the best outcome. If you would like to discuss how TAMIM can help you with this process please feel free to contact us via phone or email.