This week the TAMIM Small Cap team take a look at the embedded value within their portfolio.
Summary:
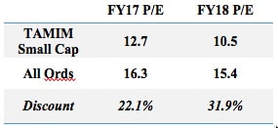
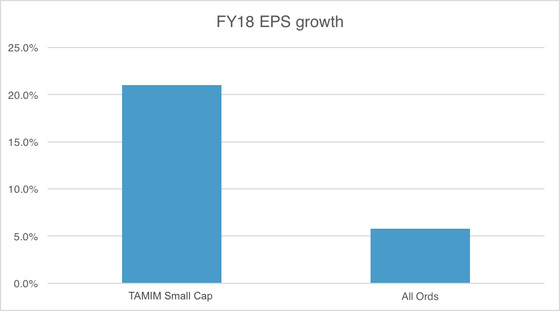
As the portfolio underlying the TAMIM Australian Equity Small Cap IMA approaches its 3 year anniversary we believe the embedded value opportunity within the portfolio is as compelling as when the portfolio was launched. The strategy is invested in high quality smaller companies which are trading well below our view of fair value. The portfolio is currently trading at a 32% FY18 P/E discount versus the All Ords despite the fact that expected FY18 earnings growth is expected to be almost four times greater.
What is embedded value?
Embedded value is generally defined as being the underlying value of an asset based upon:
Earnings – The underlying value of the asset is generally calculated as the net present value of expected future cash flows.
Assets – The underlying value of the asset is generally calculated as the realiseable value of the assets, or the price they could be sold at on the market.
In the TAMIM Small Cap strategy, we are looking for high quality smaller companies in which embedded value is far in excess of the current market cap.
The TAMIM Small Cap portfolio embedded value opportunity in numbers:
The TAMIM Australian Equity Small Cap IMA portfolio currently owns 17 high conviction stocks which we believe are the “best of the best” high quality smaller company opportunities listed on the ASX. At present, the vast majority of these positions are earnings based positions – i.e. stocks in which we believe the discounted value of these companies’ future cash-flows is far in excess of their current market caps.
At a portfolio level the most effective way to present the earnings based embedded value opportunity is to show the underlying portfolio’s weighted average P/E valuation versus the weighted average for the All Ords, and then to compare the weighted average expected earnings growth for FY18 with the All Ords.
TAMIM Australian Equity Small Cap underlying portfolio weighted average P/E vs the All Ords (assuming portfolio is fully invested as cash has no P/E):
The TAMIM Australian Equity Small Cap portfolio is trading at a significant valuation discount versus the broader market.
TAMIM Australian Equity Small Cap underlying portfolio weighted average expected FY18 earnings growth vs the All Ords (assuming portfolio is fully invested as cash has no EPS):
The TAMIM Australian Equity Small Cap portfolio’s expected earnings growth is 3.6x that of the broader market.
It is the combination of the above table and chart which shows the TAMIM Australian Equity Small Cap portfolio’s embedded value opportunity: i.e. The portfolio is trading at a 32% valuation discount versus the broader market and yet earnings growth is expected to be almost four times the market average. In our experience, this is an usual combination within the investment company universe, and highlights the size of the strategy’s opportunity looking forward.
How will the embedded value opportunity be realised for investors?
Earnings positions: Typically for earnings based positions the value opportunity will be realised through earnings reports which highlight cash flow growth rates above market expectations, and thus lead to an increase in market expectations regarding future cash flow growth rates.
Example: Zentias (ASX:ZNT) is a typical TAMIM Small Cap portfolio earnings based position in that it ticks all our boxes for a high quality company, is trading at a significant sector discount, and its expected catalysts are earnings upgrades driven organically and through acquisitions. We believe the stock is trading significantly below its embedded value at present.
ZNT has been covered in a recent research article (again here).
Asset positions: Asset based catalysts tend to be less predictable than for earnings positions as they are often driven by one significant catalyst as opposed to regular quarterly earnings reports. The key major catalysts we generally expect for asset based positions include: asset sales, asset purchases, and growing sum of the parts visibility based on improved market communication/disclosure.
Example: Elanor Investors (ASX:ENN) offers a compelling asset valuation opportunity at present in our opinion as the stock is currently trading roughly in line with its current net asset value which implies its highly profitable fund management business is trading at a significant discount to fair value. This is a typical example of the sum of the parts becoming increasingly visible in an asset based position over time.
A generally long term perspective: We believe we have a significant advantage over shorter term focused investors/traders over the long term. By “not caring” about the short term market noise we find that we are well positioned for the value creation in our stocks as and when it arrives. This long term perspective will be absolutely key in realising the embedded value within the TAMIM Small Cap potfolio.
Conclusion:
Buying stakes in ASX listed companies in which embedded value is far in excess of the current market value is what we are focused upon day in, day out. We believe this underlying value will be realised through catalysts such as earnings upgrades, as well as our old friend, time.
This week Robert Swift and Roger McIntosh, of the TAMIM Global Equity High Conviction IMA, take a look at the tricky subject of creative accounting and how it must be factored into your stock analysis.
Quantitative stock selection models such as our VMQ assessment, provide a sound and proven framework for identifying attractive and unattractive stocks.
However, quantitative signals that are based on financial statement information can fail to spot creative accounting techniques which may fool the signal and give false comfort. Consequently, we perform complementary ‘fundamental’ research based on Accounting, Strategic and Governance perspectives.
These are as equally important as our quantitative signals. Although we dislike the term, some people call it a ‘quantamental’ approach to stock analysis and selection. It’s actually quite hard to use both sets of signals since most portfolio managers believe these two kinds assessment models are from competing philosophies. We believe they are complementary philosophies and wouldn’t invest without analysing both.
One currently overlooked aspect of company profitability and its sustainability, is that of corporate taxation. Many companies know that EPS are the driving force behind share price growth and will consequently do all they can to boost that number. This can be done by creative accounting including tax avoidance, and simply by underinvesting in the business by reducing capital expenditure and thus depreciation charges.
If a company has been systematically underpaying tax then it is quite likely, now more than ever, that its day of reckoning will come. We have been working with a forensic accounting service, Bucephalus Research in Hong Kong, to identify companies which are creatively avoiding tax (and performing other accounting shenanigans) and are concerned where this tax avoidance alone makes their shares look cheap. We believe in an era of greater scrutiny and cooperation on corporate behaviour, this is a risk to share prices which is underestimated. Our portfolios, we believe, have very limited exposure to companies with earnings boosted by this creative accounting.
Where we do have exposure, such as Gilead, we try to ensure that we understand why.
Tax is incurred and payable as part of a company’s regular business and can provide a good indication of the real level of cash earnings behind profits. Since cash pays the bills, cash earnings do matter. For most companies, their tax expense is close to their notional and national tax rate, but disparities do exist. This is typically due to the nature of cashflow within different industries. Tax expensed is not the same as tax paid. While there can be many reasons, these differences are typically short term and wash out quite quickly – this is normal and doesn’t bother us.
For some companies however, even when adjustments are made to take these additional factors into account, discrepancies persist. These are the companies where investors should question why and how the company is more able to book non-taxable profits. Are other matters being hidden? Is the circumstance sustainable? The OECD, a body which seeks greater global cooperation and conformity, has established a Base Erosion and Profit Shifting (BEPS) programme in 2016. This was established in the wake of different profit shifting scandals, and aims to prevent jurisdiction shopping where companies move to declare profits in places of more favourable tax rates. The BEPS framework will make it harder for companies to maintain this situation and ultimately will lead to higher tax costs for certain businesses and industries.
Tax is important for different reasons. Higher tax paid on profits reduces shareholder access to this via dividends. We are seeing some moves across different countries to reduce company tax rates to retain and grow business activity. Companies, particularly international entities, in different industries and regions can relocated cashflow to legitimately pay a different effective tax rate.
Analysis of tax paid can also identify anomalies in financial statement information such as whether a company is applying creative accounting techniques to elements that form the input to quantitative valuation signals. It can identify whether a company is utilising debt manipulation techniques to provide a set of accounts that meet credit requirements and investor expectations, but glosses over reality.
Robert Medd from Bucephalus recently identified Amazon as a company suspiciously paying little tax. This is in line with a recent article we wrote where we argued that this was just as anti-social as a company which was involved in high carbon emissions, and armaments manufacture. Yet this aspect of company behaviour is, not yet, remarked upon. So, the ESG advocate, who argues for shutting coal mines is quite happy to do so having bought their corporate wardrobe on line via Amazon! We have had a few provocative and animated discussions on this one.
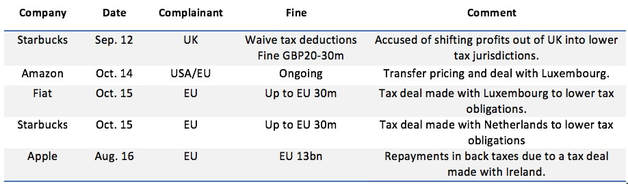
We recreate here Robert’s recent work on the USA companies most likely to be at risk of being “called to account”.
Recent tax penalties:
Source: Bucephalus Research Partnership
Companies that may be most affected by BEPS – NB Gilead!
Source: Bucephalus Research Partnership
Certain companies and industries have greater ability to move cashflow to minimise the impact of tax on ongoing cashflow. The monitoring and enhancement of fundamental characteristics and oversight through company knowledge can help to ensure the strategy avoid investment based on aggressive or even misleading information
What this all means is that any investment process should maintain a robust fundamental oversight on all information that is available. This ensures that any stock is verified as truly attractive with all risks identified. As we state in our presentations – It’s Valuation Momentum Quality (VMQ) + Accounting Strategic Governance (ASG). Sources: ‘Tax matters: Creative accounting and tax laundering’, Robert Medd, Bucephalus Research Partnership, September 2017
This week we present a piece by Hamish Carlisle, analyst with the TAMIM Australian Equity Income IMA powered by Merlon Capital Partners, as they review their analysis of Telstra.
When Merlon was established in 2010 and we first formally reviewed Telstra, the stock was trading at $2.64. The top down (and perhaps consensus) view at that time was that the company faced enormous structural challenges stemming from the ongoing decline in fixed line voice services, intense competition in mobile and broadband, and the loss of its monopoly position as provider of last mile access to 9 million homes and small businesses. At that time, we valued Telstra at between $3.20 and $4.35 per share.
Fast forward to 2017 and not a lot has changed, least of all our valuation of Telstra shares which currently stands at between $2.70 and $4.35 per share. Taking into account the stock’s high dividend yield over the intervening period the shares have delivered a total return on our initial valuation in line with our standardised equity discount rate of 12 percent.
Nonetheless, the poor performance of the stock in more recent years has prompted questions from many of our clients and stakeholders so we thought it might be worthwhile outlining our current thinking.
Case study: US railroad industry
By the mid-1950s the US railroad industry was already in decline before being hit with its own equivalent of the National Broadband Network (NBN) in the completion of the interstate highway system creating severe competition from the trucking industry and reduced passenger travel. At the same time, airlines were taking almost all long haul passengers away from the railroads.
Nevertheless, since 1957 railroad stocks have outperformed not only the airlines and trucking industries but also the S&P 500 index itself. This occurred simply because the “top down” issues facing the industry were well and truly factored into investor expectations and only small improvement was necessary for these companies to beat such a dim outlook.
And better times were coming. In 1980 there was a major deregulation of the railroads that spurred consolidation and greatly increased their efficiency. Despite falling revenues, rail productivity has tripled since 1980, generating healthy profits for the carriers.
The lesson: An industry in decline can offer good returns if investor expectations are sufficiently low. If such a firm can halt its decline – and pay dividends – its shares can deliver excellent returns.
The question with Telstra is whether expectations are sufficiently low.
Gauging market expectations
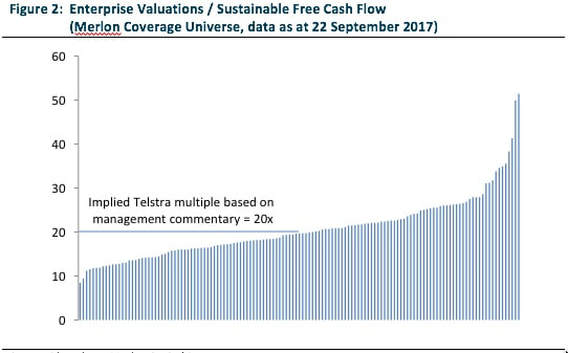
Comparing a company’s share price with some measure of intrinsic value can give some indication as to whether market expectations are optimistic or pessimistic. Merlon’s preferred measure of intrinsic value is to compare a company’s enterprise (or unleveraged) value with its sustainable enterprise-free-cash-flow.
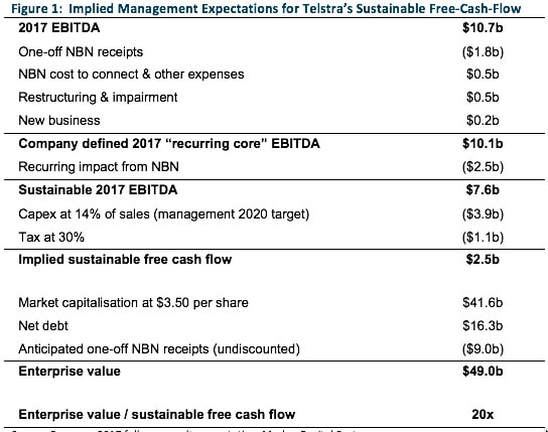
To give a guide to management’s expectation of Telstra’s “sustainable free-cash-flow”, Telstra’s most recent result presentation noted:
Telstra generated “recurring core” EBITDA in the 2017 financial year of $10,068m;
The recurring impact on 2017 EBITDA from the NBN is likely to be around $2.5 billion;
The company is targeting a capital expenditure (capex) to sales ratio of around 14% from 2020.
Putting these pieces together one might conclude that the Telstra’s board and management expect the company’s enterprise-free-cash-flow to settle at around $2.5 billion.
Source: Company 2017 full year result presentation, Merlon Capital Partners
Taking into account anticipated one-off NBN receipts this would imply the company is trading on approximately 20x sustainable-free-cash-flow. This is hardly a bargain but in line with the median multiple for ASX200 companies under our coverage. This suggests to us that the market has largely taken management estimates of profitability and cash flow at face value.
Source: Bloomberg, Merlon Capital Partners
Ignore the cash flow statement at your peril
As we persistently highlight, management teams and boards are becoming ever increasingly creative about how they define profitability. Some of the measures in Figure 1 are examples of this. “Recurring core Earnings Before Interest, Taxes, Depreciation and Amortisation (EBITDA)” is not a measure of profitability defined in any accounting textbook and guidance about the “recurring impact from the NBN” is an estimate at best and a guess at worst. We discuss this further below.
The bottom line is that management teams can define profitability however they choose but can’t as easily hide from the realities of the cash flow statement. Eventually these realities come home to roost and when this happens stocks with low earnings quality tend to underperform.
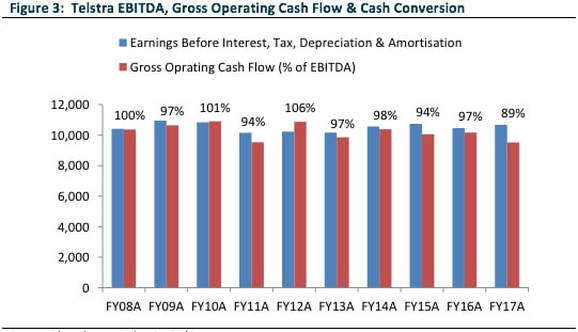
Along these lines it is important to note that Telstra’s earnings quality is poor. The company’s gross operating cash flow (“GOCF”) of $9.5 billion (which can be found on page 74 of the company’s annual report) bears little resemblance to the EBITDA figure of $10.7 billion quoted in Figure 1.
Source: Bloomberg, Merlon Capital Partners
At Merlon, our focus is on the cash flow statement rather than measures of “advertised” earnings. Typically listed companies do a good job singing the virtues of such advertised metrics often with advisers, brokers, analysts, journalists and other commentators cheering on from the sidelines. Often these advertised metrics form the basis for variable remuneration prompting board members to join the chorus.
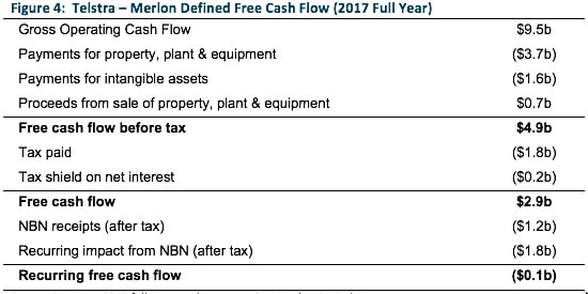
Focusing on the cash flow statement reveals a vastly different picture of Telstra’s continuing businesses. Had it not been for non-recurring NBN receipts and the network cost holiday being enjoyed ahead of NBN rollout, Telstra would have been in cash flow deficit during the 2017 financial year.
Source: Company 2017 full year result presentation, Merlon Capital Partners
If nothing else, the above analysis highlights the significant work ahead of Telstra management to meet market expectations.
The NBN earnings gap
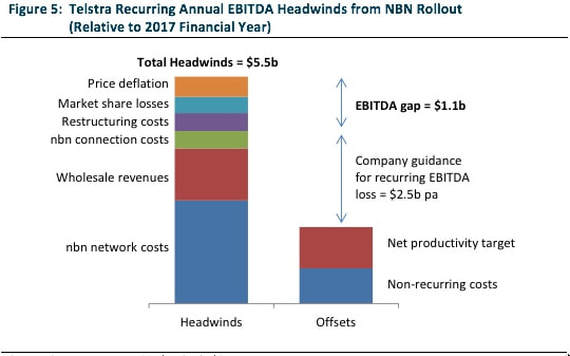
As highlighted in the tables above, management have indicated that “the recurring impact from the rollout of the NBN” is likely to be around $2.5b per year. Our analysis suggests that the ultimate outcome could be much worse than this. Key headwinds we highlight are as follows:
Incremental NBN costs of approximately $2.5 billion per annum: The NBN’s corporate plan has the company achieving revenue of $5 billion in the 2020 financial year. We think it is reasonable to assume Telstra will account for 60 percent of this amount, or $3 billion. About $500m of this amount is already reflected in Telstra’s 2017 accounts so the incremental cost from here is likely to be about $2.5b.
Loss of wholesale revenues amounting to approximately $1.3 billion per annum: Telstra currently generates revenues from wholesaling its products and renting out its network to other retailers such as TPG/iiNet, Vocus, and Optus. These revenues will not continue following the rollout of the NBN.
Potential recurrence of NBN connection costs of around $0.4 billion per annum: Telstra has incurred significant costs in connecting customers to the NBN. While the company has excluded these costs from recurring earnings it is possible that a component these costs will prove to be ongoing due to normal customer churn.
Potential recurrence of restructuring costs of around $0.4 billion per annum: Given the scale of cost reductions required to deal with the above items and the company’s history of incurring restructuring costs, it is likely that at least some component of restructuring will prove to be ongoing.
Potential market share loss due to structural separation of network: Prior to the rollout of the NBN, Telstra enjoyed a monopoly position with regard to its ownership of the fixed line network. It is likely that the progressive levelling of the playing field as the NBN rolls out will see heightened competition and some market share loss for Telstra.
Potential repricing of fixed line services: Telstra currently enjoys average monthly revenues per user of around $95 compared to more competitive offers in the market ranging from $55 to $75. It is likely that Telstra will see progressive price deflation with regard to its products.
Offsetting these factors Telstra has targeted annualised productivity gains of $1 billion by 2020 and is adamant that restructuring and cost to connect costs will not persist. Our analysis suggests that these aspects may not be enough to offset headwinds with an additional $1.1 billion of cost savings or additional revenues required to achieve the company’s ambition of limiting the recurring impact of the NBN to $2.5 billion.
Source: Company reports, Merlon Capital Partners
Mobile pricing
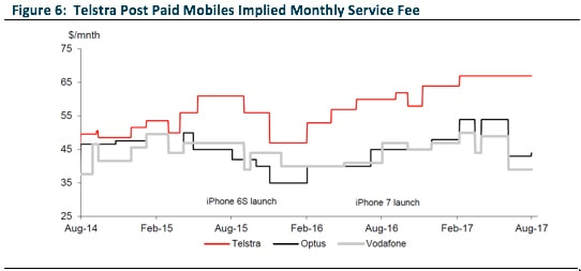
The mobile division delivered a strong result in 2017, ahead of both our own internal and market expectations. A key driver of continued strong performance within this division has been Telstra’s capacity to maintain a meaningful price premium to its major competitors.
Source: Macquarie Equities Research
It would appear that the company has further increased its pricing premium since the result which may represent an earnings tailwind for the current period. We are cautious about the sustainability of this pricing premium and cautious about the sustainability of margins within Telstra’s mobile division. We believe Telstra’s network advantage is not as material as it was 5 years ago, particularly for metro areas. We note the entry of TPG into the market and we note the likely emergence of no-SIM mobile devices in coming years.
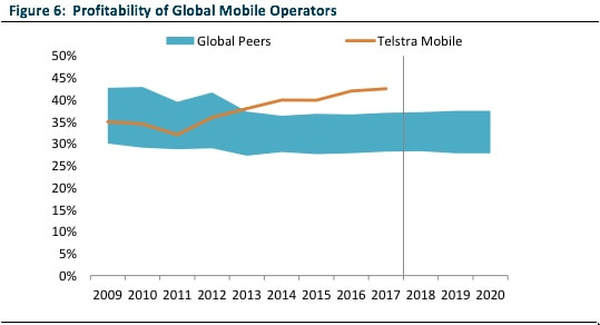
As we have discussed in previous commentaries, our investment process explicitly deals with industry structure and competitive advantage through our qualitative scorecard. We do not screen companies in or out of the portfolio based on these scores but believe deeply that returns on capital are ultimately determined by the qualitative characteristics of the industry and each player’s competitive positioning. High returns on capital support high cash conversion and hence have a direct impact on our assessments of sustainable free-cash-flow and valuations.
It follows that we have built some price deflation into our assessment of sustainable free-cash-flow for Telstra’s mobile division, although we accept that it is difficult to be too scientific about the quantum but directionally we feel that Telstra’s mobile returns will deteriorate over the next three to five years.
Source: Bloomberg, Merlon Capital Partners
Capital intensity
At Merlon we apply a standardised approach to valuation for all investments based on our assessment of sustainable free-cash-flow. It follows that our valuations are highly sensitive to assumed levels of sustainable capital expenditure.
Our analysis of global network operators and telco resellers has consistently led us to conclude that Telstra’s capital expenditure should be significantly lower as a reseller of fixed line services rather than vertically integrated network operator and that Telstra spends an unusually high amount on capital expenditure.
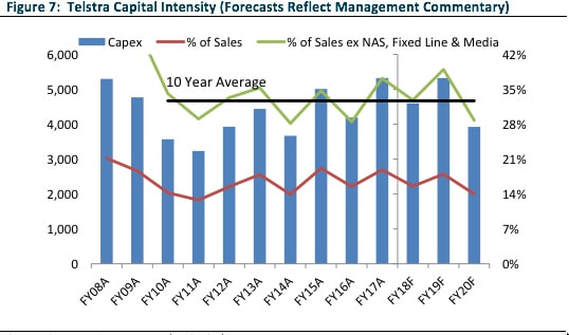
It follows that we were shocked by the company’s announcement that it would be spending $15 billion in capex over the three years to June 2019. The company’s capex agenda is strikingly high when we consider that 27% of the company’s recurring revenue will come from fixed line services utilising third party infrastructure (i.e. the NBN).
Telstra have indicated to the market that it expects capex to reduce to approximately 14% of sales in 2020. Since the NBN was announced Telstra has had little incentive to invest in its fixed line network. It is also the case that Telstra’s Network Application Services (“NAS”) and Media divisions are much less capital intensive (and lower margin) than the rest of its businesses. As such, it is probably more appropriate to compare Telstra’s capex to its non-fixed line, non-NAS and non-Media businesses over this period.
Source: Company Accounts, Merlon Capital Partners
From this perspective, the company’s current capex budget appears historically high, although the 2020 guidance of 14% of sales is slightly lower than the experience over the past decade when excluding “capital light” segments.
What is clear to us is that Telstra is and will remain a highly capital intensive business with its core mobile and corporate/wholesale businesses historically absorbing between 30 and 40% of revenues in capital expenditure.
Portfolio positioning
It is clear to us that despite the recent share price fall Telstra is no bargain, even if management achieve what we believe are potentially optimistic targets. Poor earnings quality, headwinds related to the NBN, potentially unsustainable mobile margins and high capital intensity lead us to conclude there is probably downside to these targets and our base case valuation. As such, Telstra is not a core holding in the portfolio.
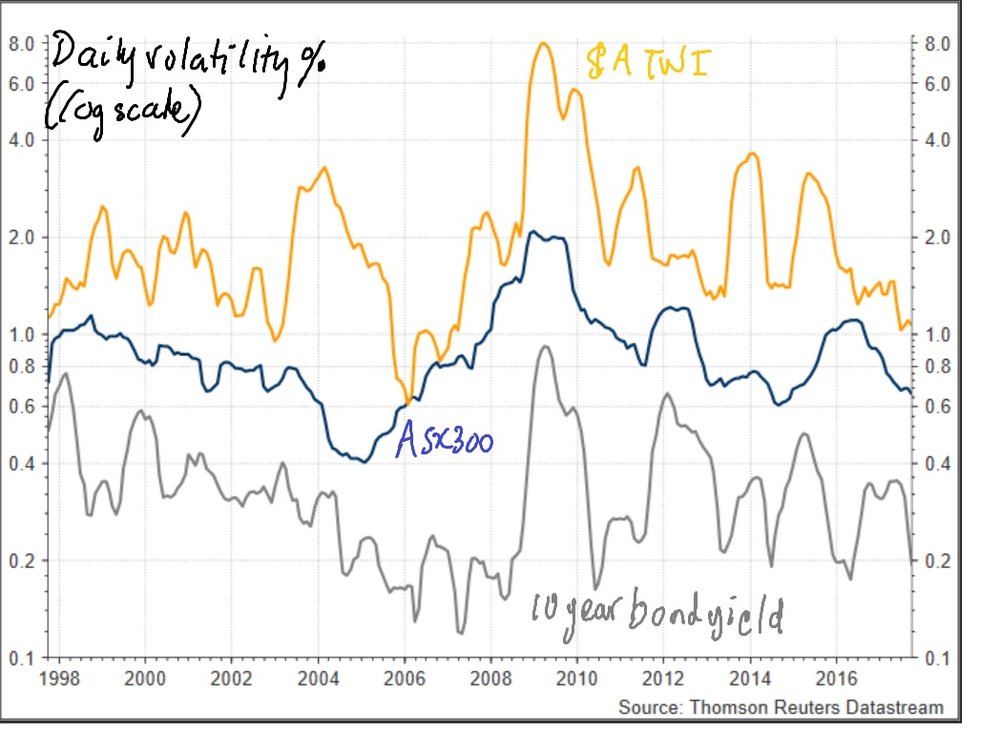
This week we present an article by friend of TAMIM Sam Ferraro as he examines the subdued volatility the Australian market has been experiencing.
Market volatility conditions have remained subdued for some time. Daily return volatility of the Australian dollar Trade Weighted Index has dropped to its lowest level in a decade despite the recent appreciation of the Australian dollar against the US dollar. Volatility in the 10 year CGS yield has exhibited a regular cycle since the financial crisis, but the the peaks and troughs have tended to trend down. While stock market volatility is close to a decade low (see chart).
Although not shown here, global macro volatility is not as benign in Australia. Although return volatility of the S&P500 is anchored to its lowest level in four decades, volatility of the US dollar has been rising and volatility of US Treasury 10 year yields is high by historical standards. So the persistently low level of stock market volatility in Australia probably reflects an exposure to a global volatility shock, while subdued volatility conditions in the TWI and Australian bond yields may have arisen thanks to domestic developments.
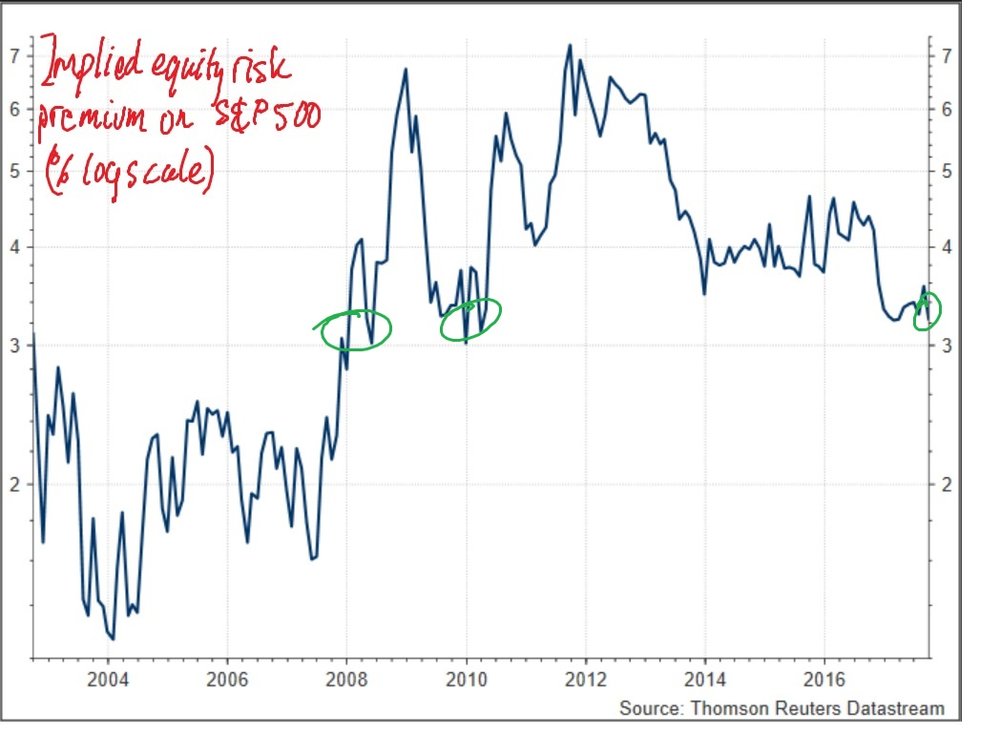
The benign stock market volatility in the United States has coincided with a drop in the expected risk premium (ERP) to its lowest level since 2010 (see chart). Even at current levels, the ERP remains higher than the levels that prevailed during the credit boom. The implied volatility of index puts on the S&P500 also are low by the standards of the past decade (not shown here). Evidente has previously suggested that if the ERP in the United States continues to trend down, it would be expected to precipitate a revival in animal spirits and business investment, and ultimately sew the seeds of the demise of the profit boom.
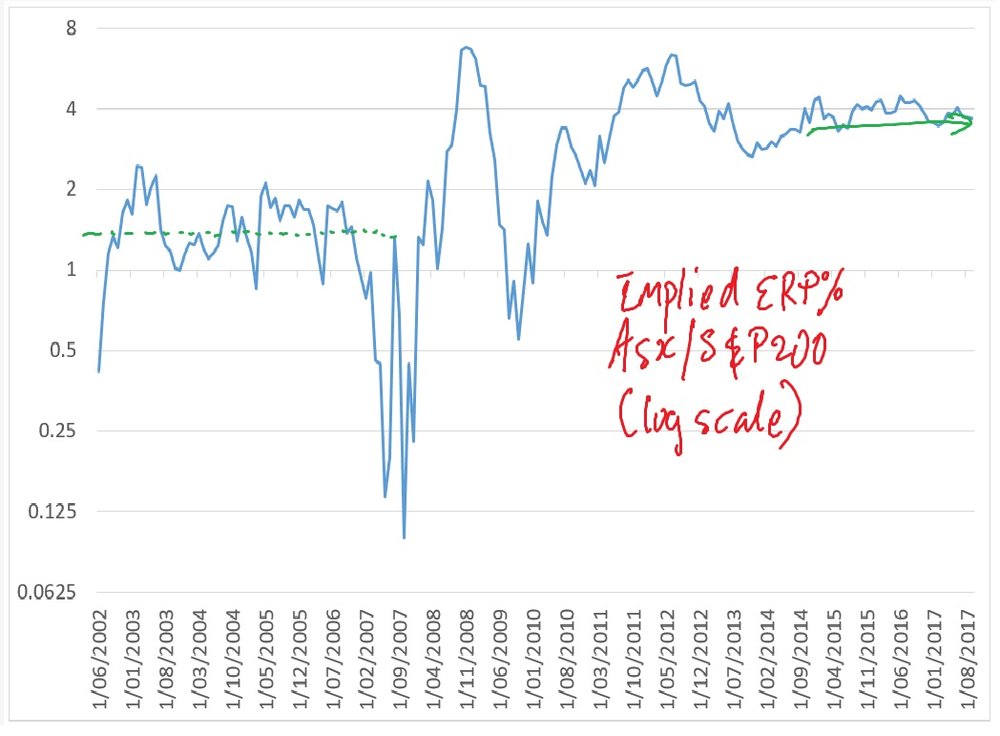
The Australian experience differs from that of the United States. Although stock market volatility conditions are subdued, the implied ERP has been broadly unchanged over the past five years (see chart). The ERP divergence between the United States and Australia might have contributed to the multiple expansion of the S&P500 to close to historical highs, while the ASX200 continues to trade in line with historical norms. Evidente believes that a renewed drop in the ERP is necessary to revive animal spirits in the corporate sector and kick-start growth of capital investment.
One of the key macro risks in Australia remains the historically low rental yields in residential property. The gross yields on apartments and detached houses have dropped to 4% and around 3% respectively. Evidente has previously suggested that when net rental yields and the lift in lending rates for investors are taken into account, the economics for new property investors are becoming more tenuous.
Investors appear to be alive to the risks associated with historically low rental yields, with the Australian bank sector currently trading on a 35% book discount to non-bank industrials (see left panel below). This represents the largest discount since 2000 and comparable in size to the discount that prevailed in the late 1980s and early 1990s. The size of the discount might also reflect negative sentiment surrounding what many consider to be bad bank behaviour. Higher capital requirements have probably played little role since the sector continues to post higher profitability – in terms of return on equity – than non bank industrials (see right panel below).
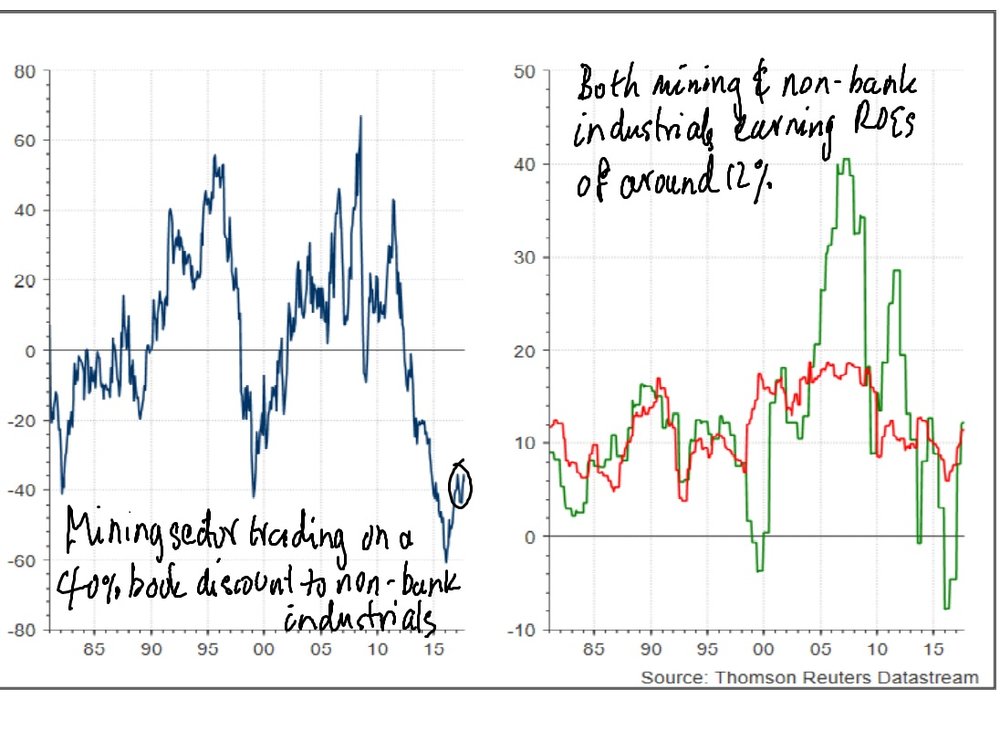
Investors also seem to be alive to the risks associated with high and rising corporate debt in China, particularly in the construction sector. The metals & mining sector is trading on a book discount to non-bank industrials of around 35%, which remains low by historical standards (see left panel below). The size of the discount persists despite the fact that the profitability of the metals & mining sector has recovered from its recent trough and is now comparable to non-bank industrials (see right panel below).
Against this backdrop, Evidente has re-balanced its thematic, high conviction model portfolio, which under-performed marginally in the September quarter and out-performed marginally in the twelve months to 30 September. Given the size of the sector discounts, the model portfolio retains an overweight in banks, and metals & miners, funded from an underweight in non-bank industrials. Despite some of the macro tail risks discussed in this post, Evidente believes that the risk-reward for these two sectors remains attractive for now.
Evidente is an independent financial consulting firm managed by Sam Ferraro that delivers innovative financial advice to wholesale investors, including active long only funds, hedge funds, pension funds, and sovereign wealth funds, in Australia and globally. Drawing on academic research in asset pricing, behavioural finance and portfolio construction, Evidente provides wholesale investors with commercial solutions to stock selection and asset allocation decisions across equities and other asset classes.
Sam writes as a freelance journalist for The Age, Sydney Morning Herald and Australian Financial Review, was a member of the advisory board of API Capital, teaches business finance and international finance courses to undergraduates at RMIT, and most importantly Sam is a well respected source of information and friend of TAMIM.
This week Guy Carson reviews the IT services sector which is a sector typically overlooked by the Australian market.
When an investor thinks about the Australia equity market, they typically think of Banks and Resources. They may also think about supermarkets, Telstra and one of the more advanced REIT markets in the world. One sector they typically won’t think about is Information Technology. This is with good reason; Australia is not home to Apple or Google, and even the more exciting businesses which have begun in Australia such as Atlassian choose their future abroad. In fact, the largest IT company listed on the ASX is Computershare which arguably could be classified as a Financial. As a result it’s a sector that largely gets ignored by Australian investors. If one has no international exposure, they are unlikely to have much exposure to IT at all and this is likely to be costly. IT is the fastest growing sector globally and this is likely to be the case for years to come.
To illustrate the likely road ahead for technology, it is helpful to consider the fable of the chessboard. The story goes that an ancient King played a game of chess against a wise man. When the King lost, he offered this wise man a reward of his own choosing. The wise man, who was also a wise mathematician, told the king that he would like just one grain of rice on the first square of the chess board, double that number of grains of rice on the second square, and so on: double the number of grains of rice on each of the next 62 squares on the chess board. This seemed to the ruler to be a modest request, so he called for his servants to bring the rice. The King was then surprised to find that the rice quickly covered the chess board, and then filled the palace. The amount of rice grains on the last square is 2 to the power of 63 or 18,446,744,070,000,000,000.
What does this have to do with technology? Well, Moore’s Law is that computer processing speed (transistors per square inch) will double every two years. This law has been remarkably accurate to date and at this point we are roughly half way through the chess board. The growth in technology has been exponential and this growth is set to continue. The ideas of virtual reality, self-driving cars and artificial intelligence are becoming more and more prevalent. So how does an investor in Australia benefit from this global phenomenon? Well there are two ways, firstly one can buy overseas shares directly or one can search through some of the lesser known Australian companies operating in the technology space. When one does search you can find companies that are leaders in niche products globally.
Whilst some areas of the Australian technology market such as the internet companies and some of the midcap software companies have seen significant rallies in recent years, one sector that investors are still a little wary of is IT services. Historically, this sector was built on a consultancy model that saw earnings dependent on the number of consultants and the utilisation of their time. However the rise of cloud technology has changed the dynamic significantly. Small and medium businesses have recently been moving away from on premise servers and are shifting to the cloud. This effectively means firms have outsourced their IT to a specialised building called a data centre. Providers such as NextDC have exploited this opportunity and are in the process of rolling out further capacity. There is a missing link, with the vast amount of cloud software available and the complexity of managing a remote IT network, a need for an external management party becomes essential. That is where the services sector is evolving, away from a consultant coming to your premises to the ongoing management of an external network. The advantage of the new model is a proportion of your revenue becomes recurring, meaning profits are less lumpy and less vulnerable to economic downturns.
Three companies that are benefitting are Data #3, Melbourne IT and Dicker Data. All of these companies are similar in they have historical businesses with large client bases and have utilised this advantage to roll out service offerings. Data #3 was an IT distribution that has expanded into services, the latter of which is now larger the first thanks to strong growth. Dicker Data is also a distribution business that has recently signed an agreement with Hitachi Data Systems to launch a new Enterprise Data division. Melbourne IT was a domain registry business that expanded into enterprise services.
Despite the change in business model, the market is still reluctant to pay too much for these businesses. All three trade on Price to Earnings multiples in the mid-teens despite strong earnings growth in recent years and paying out strong dividends. If the recent trajectory growth continues (and with the continued adoption of cloud technology it’s not hard to see how it could), then a case can be made for higher multiples. If we consider that some of the software companies trade on multiples up to and in some cases north of 30x, then if a services company sees similar growth rates should they not trade on a similar multiple? The answer is probably not and we don’t expect these companies to rerate that significantly. Service companies whilst having improved the quality of revenue in recent years are still more vulnerable and subject to downturns. Despite that we do see upside if the current growth rates are maintained. For example, if we look at the current share price of Data #3 and use a simple dividend discount model with a discount rate of 10%, we find the market is factoring in growth of around 5%. This is despite the fact that dividends have grown at an annualised rate of 25% over the last three years. If the company can continue to grow at a rate of above 5% over the coming years then there is significant upside available for patient investors.
Note: Data#3, Melbourne IT and Dicker Data are current portfolio positions.