We’ve been hearing more and more about it in the media, it’s time to take a closer look. Huawei’s meteoric rise globally is coming to a head as the US/China Trade Kerfuffle drags on and we thought it was time to take a closer look at what they are trying to do. Have we seen this type of empire building before? What does it mean for the average investor at the bottom of the world?
We have previously stated that we view the trade war as not necessarily a question of simple economics or ongoing Current Account Deficits. In fact, we are of the opinion that as long as the USD remains the global reserve currency, the artificial demand created by global trade effectively ensures that the US could at least theoretically maintain such deficits for an indefinite period of time without being too adversely impacted (hopefully we don’t have any workers from the American Midwest or Rust Belt reading this). Quite on the contrary, we view this current adversarial environment as a longer-term trend that will take us slowly but surely towards a new equilibrium in the global economic order. One outcome of this is that the two major players (the US & China) increasingly look at disentangling their supply chains and carving up spheres of influence. All this in preparation for an era where the very essence of political and economic survival will be contingent upon leadership in the next generation of technological advances broadly characterised as the fourth industrial revolution. The clearest and most obvious representation of this process has been the curious story of Huawei.
The recent headlines surrounding this rather opaque company made us want to take a closer look at it. It has certainly been a busy time for them on all fronts and we think their PR teams might be having a more interesting time than those in the White House in terms of putting out fires on an almost daily basis. From mere accusations by the US administration to the State Department making it official policy to intentionally go out of their way in convincing governments around the world to view them as a threat, lobbying heavily to block their usage in the rollout of 5G in the UK and across the EU.
Closer to home, state and intelligence officials continue to persuade our own government to view Huawei increasingly as a proxy for the Chinese State. Whatever the truth of the matter is, and we feel somewhat disposed to believe that there may be an element of truth in the accusations, we might then ask ourselves the question, just why is it that there has been such a furor created about this one company? To the point where individuals are being caught in the crossfire, the most immediately obvious case being the arrest of Meng Wanzhou, CFO and daughter of the companies founder, in Canada for breaking US sanctions against Iran. Officially the US Attorney’s office where the warrant originated is nominally independent, we remain unconvinced that the White House would not be at least given a heads up before the US Attorney for the Southern District went ahead and issued it though. We get the feeling that, if not for the fact that she was the daughter of the founder of Huawei and the granddaughter (on her mother’s side) of a Deputy Governor of Sichuan (her father having married particularly well), things might’ve been rather different in ages gone by. A slap on the wrist, a few outraged interviews and the world would’ve moved on. We’re not legal professionals but a slight bureaucratic delay in the issuance of the extradition request until Ms. Meng was back on Chinese soil would’ve done it. After all, when there is a will there is a bureaucratic hurdle in the way.
Cynical? Remember Jamal Kashoggi? Sadly, probably not. Popular conscience seems to have the memory of a goldfish.
The very fact that there seems to be an increased propensity by both parties to dig themselves in quite hard tells you all you need to know, at the very least, about the importance of control over 5G and the global communications landscape/infrastructure for both governments.
The argument over Huawei’s opaque ownership structure and extraordinary closeness to Party officials are certainly red flags. This in itself shouldn’t be an issue altogether based on past behaviour though. If it were, it would essentially preclude us doing business with a large chunk of Chinese corporates. As we have previously written about, opaque structures and closeness to government officials is a norm rather than an exception in China. In addition, Huawei’s ability to garner local government contracts and scale operations on a rapid scale was actually what attracted US companies like 3Com and Symantec to partner with them in China in the first place. We have also previously elaborated on the eventual issues that foreign partners have had in sectors ranging from automotive to financial services (for further reference please look to the case of SAIC and GM in Shanghai). What is the distinguishing feature here is the sheer amount of friction this has caused on both a geopolitical and international front.
We think this might have more to do with how much of a threat the company itself, and the new economic footprint that the CCP has undertaken, poses to US commercial interests. The argument we make is that, as Huawei and other Chinese companies move further up the value chain (as opposed to basic manufacturing), this is inevitable. We have seen this story play out in the past, just look to Japan in the late 20th century. Similar rhetoric was used in pointing out the opaqueness of Japanese Keiretsu firms and the unfair advantages that said companies had in trade. Initially, in the US, governments and regulators alike were happy to see what was essentially labor arbitrage. They can no longer do so now as the Chinese economy has transitioned to middle income. In order to sustain growth levels and avoid the middle income trap/secular stagnation, the economy can no longer rely on cheap labor as the primary driver of corporate investment. The Chinese state’s solution to this conundrum poses a direct threat to high-tech US firms and Silicon Valley’s almost hegemony-like status.
Ironically, the vitriolic rhetoric of the Trump administration may have had the benefit of giving the Communist Party its catalyst to make some rather painful transitions domestically as the issue is now one intrinsically tied to issues of national pride. As we like to say, nationalism goes both ways. It gives the excuse that Beijing needed in order to build consensus and undertake the rather painful reforms. The inevitable slow-down and short term pain that comes from a rapid shift in policy settings as they make the transition towards consumption led growth and higher value add services/manufacturing can always be blamed on external forces (for example, quiet factory floors in places like Shenzhen and a ticking up of unemployment). The most obvious sign of this has been the increased tendency of Chinese consumers, especially in the younger generation, to dispense with buying iPhones in favour of local brands such as Huawei. The latest trend has been to build an app store that is a viable alternative to the Android or iOS based platforms.
So where is this going?
We do not claim to have a crystal ball that predicts who might end up winning in this race. But from Huawei’s perspective we think they have a marked advantage in many ways. For one thing, they are not driven by the same motivations as listed companies in the US or notions of shorter term profitability, not to mention the significant amount of cash that Huawei has retained on the balance sheet.The global communications supply chain is very interlinked as companies have increasingly looked to specialise. So, in essence, companies that might compete in one market might act as customers and suppliers in others. The blockage of US companies from doing business with Huawei will make consumers worse off in the short run at least. For one, Huawei has a proven record of efficiently and effectively building out network infrastructure, though they do rely on certain components from US companies for this. The ban will have the short term impact of slowing down the process of 5G rollout around the world and increase the associated costs. For telco providers such as Optus (Singtel), this will make things increasingly complicated, being caught in the crossfire, since they have to work around relationships with their US partners while still maintaining pre-existing strategic partnerships with Huawei (including things like their joint research center).
On a longer term basis, this will effectively create two distinct opportunities to benefit from. First, the creation of artificial regulatory barriers can actually be beneficial for incumbents as it can insulate them from competition. That being said, the increased competition from new greenfield markets might put downward pressure on margins over the long term but we think the insulation might be good for margins in the medium term. Rather than product segmentation our view is geographic segmentation will become increasingly important. So then the true target and playing field will be greenfield territories especially emerging markets across South America, South East Asia and Europe. These areas will be where Huawei and its American counterparts go head to head in a battle for dominance. With some insulation in terms of their existing foothold in domestic markets.
Source: telecoms.com
Huawei the Company: Potential Trajectory – How do we play this?
From a corporate perspective we will start by saying that we doubt Huawei will ever go public. Even the legendary founder Ren Zenghfei officially only owns 1.5% of the actual company, the rest of the ownership held through a series of opaque structures that give some credence to the suspicion of effective control by the Party. However what will be interesting for investors will be the implications that the regulatory environment creates for others across southeast Asia, including Taiwan. Said players will be beneficiaries through Huawei’s largess and their need to source alternatives in terms of hardware and supply chain replacements (some profitable opportunities to be had thanks to an acquisitive giant mayhaps?).Another strategy being touted is the potential for Huawei to open its software architecture and turn it into open source. They may also find themselves giving away certain technologies to partners that might be able to roll out in the US thus circumventing any sanctions. This will, we hope, be an interesting longer term trend and something they might look to achieve in pursuit of both positive synergies from an ideation perspective as well as a competitive ploy.
On the flip-side, Huawei’s closed and rather opaque governance mechanisms will also be a hurdle to further scalability in the wholesale market. This will be where politics will certainly come to play, with increased lobbying on an intergovernmental playing the prominent role. For example, the Chinese government might give certain incentives or parcel certain projects as part of the OBOR initiative in Central Asia.
We however doubt that the governance structure is going to change though even if it is profitable in the short-run and allay concerns from global regulators. This isn’t all about money after all, as any person who has followed Mr Zhengfei can attest. With his obsession for Napoleon and a penchant for European military art, we think this might not just be about profit. After all, here is a man who from humble beginnings as a researcher in the PLA (People’s Liberation Army) has built a global behemoth. For those of you unaware, he started very much as the perennial outsider, his family coming from a Koumintong background and being distrusted by Party Officials (which precluded him from joining its apparatus for a significant period of his life). He grew leaps and bounds by managing the officials in mutually beneficial manner as well as making himself useful by building up the nations capabilities in strategic sectors. With the new generation of Party Leadership being dominated by previously untouchable outsiders we think things will get a lot more conducive for him and he will play a vital role in the future of China’s commercial policy. This is mere speculation, but we somehow doubt his interests might be driven by purely commercial motives, in him we see a pragmatic individual intent on building a legacy. This aspect of his personality would certainly explain his hobbies and fascination for that other upstart conqueror in history.
But who are we to judge, we have our very own conquering types. The longest standing of these would be the infamous Rupert Murdoch brigade. In this instance all we can do is figure out places where we might pick up some profits in the fringes as they go about their process of Empire Building.
Huawei’s new campus in China (as we said, that penchant and fascination with European conquerers/imperial era styles is very real judging from the campuses alone)
Ron Shamgar takes a look at a selection of stocks – some good, some bad – following reporting season. Highlighting the important numbers and what to look for going forward, this is a must read for keen Aussie investors
This week we once again highlight some of our holdings that reported during August. The TAMIM All Cap IMA portfolios delivered a very strong performance of +4.55% during August. Calendar year to date the portfolios are up +28.21%. The TAMIM Small Cap Income Fund also delivered a strong performance of +4.13% during the month, calendar year to date the fund is up +23.92%. We discuss a selection of holdings from both portfolios below, including ISD, NEC, FXL, JIN, BBN, MNF.
Isentia (ISD.ASX)
Isentia is the leading media intelligence company in Australia and Asia Pacific. We previously highlighted the turnaround story within ISD under a new management team. FY19 results were in line with guidance at revenue of $123m and EBITDA of $23m. Cash EPS came in at 4.7 cents and operating cash flows were quite strong, benefitting from some favourable balance date movements. Overall, the balance sheet now has the lowest amount of debt since 2015 at $28m net debt. The business is finally benefiting from lower negotiated copyright costs and a focused and incremental investment into the product suite.
Management has done a good job of taking out costs by automating several aspects of media reporting. Guidance for FY20 is for $20-$23m EBITDA and we estimate net debt to reduce further to approximately 1x earnings. This is a level that we believe will enable the board to consider reinstating dividends. Management believes from FY20 onwards both revenue and earnings will return to growth (10-20% growth) and we see FY21 Cash EPS of 5.5 cents as a realistic outcome. Right now, we value the company at ~65 cents and we believe it is highly likely that ISD will get taken over in the next 2-3 years for over $1 a share.
Nine Entertainment (NEC.ASX)
Nine has done an excellent job of diversifying their revenue base away from the traditional broadcast TV business with only 47% of group revenue coming from TV. The business is now less susceptible to the structural headwinds and cyclicality of TV advertising spend. The company has new and emerging growth businesses to help boost long-term growth.Nine’s subscription streaming service, Stan, turned profitable in 2H19 and should add to profits in FY20. Stan has over 1.7m subscribers and should generate $200m+ of revenue this year. We believe Stan alone is worth a good portion of the current NEC valuation. Online property classifieds business, Domain (DHG), is recovering from one of the worst real estate listing environments in twenty years, and the acquisition of the remainder of Macquarie Media (MRN) should also be incremental next year.
Management can now focus on extracting revenue and cost upside on top of cross-selling opportunities from Nine’s full suite of media assets they have acquired in the last two years. Guidance for FY20 is for 10%+ growth on FY19 EBITDA of $424M. We estimate EBITDA to exceed $500M and EPS of 14 cents. We see the 5% ff dividend yield as quite attractive. We value NEC at ~$2.50.
Flexi Group (FXL.ASX)
FXL is a new holding, we initiated this position at $1.50. The company is a consumer and commercial/business lender and has recently appointed a new CEO, Rebecca James, who has finally pivoted and focused the business to target millennial customers in the Buy Now Pay Later (BNPL) sector. Under her stewardship, FXL has consolidated many different and confusing brands to a handful that are clearly resonating with their target market. We believe the company is on the cusp of not just lending volume growth but also a valuation re-rate.
FY19 results came in at guidance of $76m Cash NPAT after an impairment. The company is forecasting volume growth of 15% in loans for FY20 and has also seen strong traction for their newly launched BNPL brands. In addition to being profitable, FXL also pays a dividend of 7.5 cents fully franked. Both these metrics compare well to other listed BNPL stocks that not only don’t make a profit but won’t be paying dividends anytime soon. We feel that further evidence of customer and lending traction will see FXL re-rate materially. We value the company at about 100% upside to our buy in price. Our valuation is $3.00+.
Jumbo Interactive (JIN.ASX)
Jumbo is the largest online reseller of lotteries for Lottery license holder Tabcorp (TAH.ASX). We have known the business and the Managing Director for many years now. JIN reported strong growth in FY19 and exceeded guidance. Revenue was up 62% to $65m on ticket sales (TTV) of $320m and 776k active customers. Active customer growth and the number of large jackpots are the key drivers of revenue growth.
Management has also, for the first time, given a 2022 TTV target of $1bn. This will be a mixture of lottery sales and the new and emerging vertical of charity lottery. The company has over $70m in net cash and we expect acquisitions to help drive international expansion of charity lotteries. Based on the 2022 target, we estimate that JIN can earn $70-$80m of EBIT. We value the company at $30.00+.
Baby Bunting (BBN.ASX)
Baby Bunting was probably the standout retail result for the year. Net profit came in 12% above market consensus with sales up 20% to $362m with like for like sales up 8.7%. Online sales grew 46% to 12% of group sales. The balance sheet is strong with net cash and dividends also up 60% to 8.4 cents ff. Guidance for FY20 is 30% growth and further margin expansion.
BBN is benefiting from dominating its baby goods category. In fact, there’s no direct competitor left with more than a handful of stores. We see BBN as a “category killer” and will continue to take share away from competitors. The company is forecasting as many as five new stores to open this year. Private label brands are now 28% of sales and the long term target is 50%. This should see group EBITDA margins lift to 10%+. We bought BBN for the growth/dividend component of the Fund at $2.15. Our valuation is $3.00 and since the shares now exceed this level we have been trimming our position.
MNF Group (MNF.ASX)
MNF is a telco software provider of managed services to businesses and other telco wholesalers. The company specialises in cloud based hosted phone numbers (Voice Over IP or VOIP calls) and other applications to help businesses manage all their communication needs in the cloud. The increase of cloud based technology adoption and the rollout of services such as the NBN are benefitting the company in growing its user base. A key leading indicator for MNF is phone numbers hosted. This has grown 18% last year to 3.8m numbers. We like the large proportion of recurring revenue within the business with $50m of recurring gross margins within a total of $83m in FY19 (up 20%).FY19 results were a bit messy due to one off costs and acquisitions. More importantly 2H19 underlying numbers are showing strong momentum in the business and, on an annualised basis, are already within the mid-point range of the $33-$36M EBITDA guidance given for FY20. We expect the company to slightly exceed guidance, with a full year contribution from acquisitions and further organic growth, as they expand into Singapore and other parts of South East Asia. MNF is experiencing strong industry tailwinds as their small business and large customers – Google, Uber and the like – all require their services and innovation due to technology trends for the use of in-app and online communication technology. We value MNF at approximately $5.80.
Ron Shamgar takes a look at a selection of stocks – some good, some bad – following reporting season. Highlighting the important numbers and what to look for going forward, this is a must read for keen Aussie investors.
This week we highlight some of our holdings that reported during August. The TAMIM All Cap IMA portfolios delivered a very strong performance of +4.55% during August. Calendar year to date the portfolios are up +28.21%. The TAMIM Small Cap Income Fund also delivered a strong performance of +4.13% during the month, calendar year to date the fund is up +23.92%. We discuss a selection of holdings from both portfolios below, including EML, NBL, RMC, PPE, CLH.
EML Payments (EML.ASX)
EML was one of the standout results of reporting season. The company exceeded guidance at both the revenue and profit line. Key take aways included:
Revenue was up 37% to $97m and underlying EBTDA was up 43% to $30.2m (excluding one off costs).
Operating cash flow conversion of 75% met expectations.
Balance sheet finished the period at approximately $20m net cash.
More importantly the 2H19 annualized run rate provides a starting base of $33m EBTDA for FY20. Based on minimal organic growth, benefit of acquisitions and contract wins we expect $45m of EBTDA this year on revenues of around $130m.
EML is at an inflection point. Business momentum is accelerating and Gross Debit Volume (GDV) monthly numbers for June/July 2019 provide a strong start to the new financial year. As an example, in FY18 GDV processed was $7bn, in FY19 it was $9.3bn and we estimate FY20 GDV of $14.5bn. All divisions are growing strongly. With market consensus sitting at $40.5m EBTDA this year we feel that EML is due an upgrade. The AGM and EMLcon investor days in November should provide a further share price catalyst, with guidance and a potential announcement of a dividend policy. EML is our largest holding and we value it at about $5.50.
Noni B (NBL.ASX)
The Noni B result was solid and as expected. Sales came in at $864m with EBITDA of $45m. Guidance of $75m EBITDA this financial year was also reiterated. The positive surprise from the result was the balance sheet sitting in a net cash position ($7m) and the higher dividend which brings FY19 to 14.5 cents fully franked (ff). Online sales are now 10% of group sales and should continue to increase. The company has confirmed that they expect profit growth in FY21.
A new store opening strategy was also announced and should mean 100 new stores annually for the next three years. Management has also indicated that, with a huge database of customers, they are trying to capture additional share of wallet by launching new online stores in beauty, luggage and other accessories. These stores will white label other online retailers which means no risk or working capital drag for NBL. We expect any positive like for like (LFL) sales growth or improved gross margin updates for FY20 to help prompt a re-rating of the stock. We are expecting $80m EBITDA this year with dividends of 25-30 cents ff which bodes well when the shares are at $2.90. NBL is worth closer to $4.50 by our maths.
Resimac (RMC.ASX)
Resimac is one of the largest non-bank mortgage originators in Australia. From the results, points of note include:
FY19 saw strong asset growth of 19% with principally funded loans growing to $10.2bn;
Interest income was up 15% to $118m; and
NPAT was up 19% to $31m.
With cost to income continuing to reduce, RMC is leading to margin expansion. More importantly half on half growth in earnings has now continued for six consecutive halves. This is a key metric for any growth company. Management has also indicated that it is looking to expand into other lending segments.
Due to the recurring interest income from the loan book, most of the growth came in Q4 which did not fully benefit FY19 income but should provide a strong start to FY20. In addition, funding costs have decreased significantly in 2H19 and we expect this to also benefit earnings this year. Overall, we expect 30-40% earnings growth this year, taking it to 10-11 cents EPS. RMC’s share price has rewarded us since buying in at 50 cents but is still undervalued. For a company growing at 20-30% p.a., it is trading on an undemanding 9x PE with a 3% fully franked dividend yield. The sector is trading on 13x and we see RMC’s multiple catching up over time, most likely quite quickly. We now value the business at approximately $1.35.
People Infrastructure (PPE.ASX)
PPE reported a quality result and is experiencing strong industry tailwinds. Worth noting was:
Revenue was up 27% to $278m and NPATA was up 55% to $12m;
Cash flow conversion was strong and dividends for full year were well up to 9 cents ff;
EBITDA margin at 6.4% is tracking upwards to company target of 8% over the long term. These are world best margins for a staffing business.
Health and Community services is now 50% of revenues and management is targeting 70% over the next few years. This provides the company with higher margins, better pricing power as the current market leader, and a defensive earnings stream. FY20 guidance is for 25 cents cash EPS and we see further acquisitions coming in 2H20. The balance sheet has capacity for $20M+ of deals before needing to come back to investors for more equity. We value PPE at ~$4.50.
Collection House (CLH.ASX)
Collection House was sold off heading into reporting season as the company received some negative publicity in August due to the escalation in bankruptcy proceedings against some of their customers. In addition, their listed peer, Pioneer Credit (PNC), is currently suspended for accounting audit issues. Combine that with their largest shareholder selling out and a stretched balance sheet, and there is not a lot to get excited about here.
CLH’s results basically met company guidance but the quality of the result wasn’t great with many one offs and accounting adjustments to get there. Cash collections did not improve in 2H19 as expected although FY20 forecast is for substantial improvement. The company will need that improvement as capacity to borrow further is quite limited. We question management’s rationale for increasing dividends and some of their investments this year. Heading into the reporting season we had sold down our holding on these concerns and completely exited the stock in the wake of their results. Past mistakes have taught us to be more risk averse in these situations.
Heading into the end of the financial year, one of the more interesting phenomena for us has been the upward correlations in both bonds and equities. Bond markets have been predicting a downturn in economic conditions while equities, especially given the performance of growth, seemingly show expectations of the opposite. Does it make sense? Or is there something else at work?
So there we have it, we are almost at the end of our financial year and close to half-way through the calendar year. What a year it’s been, on a global front we continue to see the central banks increasingly tilt dovish, and locally the RBA increasingly likely to go zero bound. Trade tensions have continued to escalate with US sanctions or tariffs imposed upon everything from Huawei to nation states including Venezuela, China, India, Canada and Mexico to name a few. The reaction from the markets? A mere shrug. One of the more interesting phenomena for us has been the upward correlations in both bonds and equities, so while bond markets have been predicting a downturn in economic conditions, equities especially given the performance of growth seemingly show expectations of the opposite. This offers an interesting conundrum.
Hence we thought it might be pertinent to ask the following question: Does it make sense? Or is there something else at work?
In answering this, we can start with the premise that, on traditional metrics, this does seem to be a late-cycle phase. Fundamentals wise, we have seen the continual downward revisions in global growth and corporate profits (as the impact of tax cuts in the US wear off). When combined with escalating geopolitical tensions ranging from trade to the increasing potential for war (i.e. Iran) it does seem rather more prudent to go towards risk off. However, this does not seem to be happening and one of the key reasons behind this may be elsewhere from where the market is currently looking, we put forward the proposition that the reason behind this is a combination of low inflation, low interest rates and, biggest of all, changing demographics which is creating a secular bull thesis for both equities and bonds.
In essence, from our perspective markets are being driven primarily by liquidity and the search for yield at present. As the developed world’s population continues to age and the savings flow into pension and superannuation funds we could very well see the evolution of a high P/E market along with inflation across every asset class including fixed income, which continues to defy the logic of everyday market participants. So, whilst it would be easy to suggest that this latest upward trajectory is a melt-up we cannot be so certain.
Demographics & Financial Markets
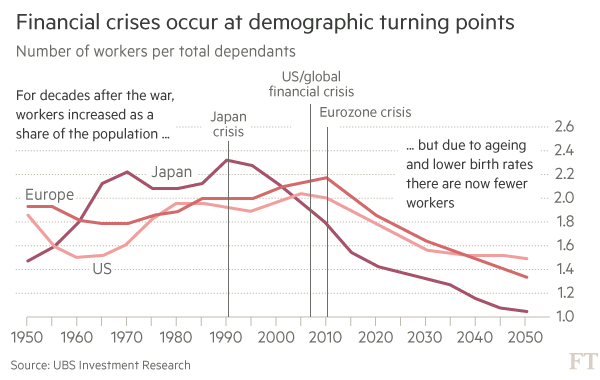
Perhaps one of the most under-researched and overlooked aspects of financial markets has been the precise impact of an ageing population on the composition of the markets. While there is the odd paper that looks at the broad macro-variables and the impact of an ageing population on productivity and underlying economic growth, the same cannot be said for its impact upon financial markets as well as the investment environment. This is especially concerning given that, as the below chart shows, demographics have been an exceptionally good predictor of crises in the past.
On an intuitive basis, the relationship is easy to understand using a simple life cycle logic. A person, let’s call them X, starts work in their 20’s typically. Their expenditure tends to exceed their income. They buy a house and, as they advance into their careers, their income will eventually reach a point where it will exceed the expenditures and, while the majority of their assets might still remain non-financial (property, vehicles etc.), the excess in income is typically put towards the accumulation of assets (often growth equities). As they continue to progress and hit retirement thresholds the asset allocation tends to be translated into income, usually through the use of annuity-like instruments or bonds, at which point a phenomenon called decumulation begins to occur. Savings are no longer prioritised, the focus is now on maintaining a certain lifestyle through a certain period of time. Now imagine a scenario where the replacement levels are continually on a downward trajectory whereby a growing proportion of the population is heading towards retirement and the working age population is shrinking. The first thing that tends to happen here is an increasing demand for bonds and annuities which put downward pressure on yields naturally and also leads to a steady decline in broadline savings rates (more decumulation) which gets worse as people live longer.
From a logical perspective, what do you get when there is less saving but growing demand for bonds (hint: it’s called leverage)? So herein lies our first point, there is already a secular demand for bonds and when combined with a lack of savings rates in the country, this tends to be a self-perpetuating cycle.
So then the next logical question from there would be to ask the question would be: as the population continues to age, does that mean that there is a bear case for equities? Going back to our person X, as he retires isn’t he likely to get rid of his equity assets and go towards less risky yield-based products?
Again, on an intuitive and arguably rational basis, this would be true. But consider a scenario where the central bank steps in and lowers interest rates toward the zero bound (doesn’t sound familiar at all, does it?), or even effectively crowd out private investors through QE. This would exacerbate the problem of demand and give further catalyst to bond prices, lowering yields across enough tranches that investors are forced to go towards riskier and riskier exposures (sub-investment grade) or go towards/stay in higher yielding equities. All this and the problem of leverage is exacerbated ever more seeing as there is next to no incentive to save in the system from whatever working-age population is left. On top of that, there is a further drive towards equities across all age groups again since the savings rate is zero bound.
So what does this mean for equities?
Coming back to why equities have held steady besides the perceived risks in the system. The answer is that in the current environment any slow-down in corporate profits would have to be great enough to offset a close to zero cost of capital. In other words, if the risk-free rate of return (which we accept to be the yield on government bonds or long-dated T-bills) is 0, or in Europe’s case negative, then corporate profits would have to turn true negative in order for the markets to actually correct or they will hold relatively steady. Put another way, a mere slowdown in corporate profits isn’t actually going to lead to a correction since the alternative is no-return. We believe this aspect of the market is not likely to change anytime soon given the lack of inflationary pressures in the economy. As the old saying goes ‘you cannot fight the Fed’ or any central bank for that matter.This also might answer the question of why the negative correlations between bonds and equities have been broken in recent years. In an ideal world bonds would be safe-haven assets and a diversification tool, but in a world where there is enough artificial demand created through zero bound interest rates and ageing populations they will neither be a good predictor of what is to come nor will they be a diversifier (they will be exceptionally and increasingly correlated with equities and, given the amount of demand for risk assets, will be increasingly disconnected with fundamentals and economic reality). That being said, we have always said that GDP growth never really had anything to do with equity market returns or Zimbabwe and Rwanda should have some real winners.
Does that mean we are suggesting that investors should continue to be 100% invested in equities? Definitely not. Equities as an asset class will be the best performer over the long-run but, unfortunately, most people do not think in time horizons of 100 years. So, we would like to reiterate the importance of staying dynamic in your allocations. One of the key elements to think about when structuring your portfolio should always be the concept of Net Present Value (NPV) and opportunity cost. In a world where there is no benchmark for the risk-free rate of return, our life becomes a little more complicated. What should the discount rate be in this instance? We would suggest that this will have to be an increasingly arbitrary percentage based on the calculus of someone’s age and minimum requirements (translated into yield). For example, if you require AU$50,000 and your total asset base is AU$500,000 then your discount rate would have to be 10%. Please note the example used is for illustration purposes only, using a 10% discount rate would lead to some unexceptional risk-management.
In the medium-term investors are unfortunately left with little choice but to have a risk on trade constantly and central banks have very little wiggle room, through blunt policy instruments, to unravel the distortions existing in the system (hence further increasing leverage in the system) unless we want to go through substantial pain. We all saw how that turned out in Powell’s case, we hope that he won’t be demoted anytime soon.
So a conclusion of sorts?
In essence, this is likely to mean that equities remain the largest component of any portfolio. That said, we will also likely see a greater amount of volatility in the coming months following the G20 as trade tensions continue to escalate and supply chains continue to be recalibrated. One of the most interesting developments to watch will be whether these geopolitical pressures also create inflationary pressures (we haven’t seen it yet, but consumers in the US will eventually see the cost of tariffs passed through) as these supply chains undergo changes. Closer to home, the slowdown in global growth and the double whammy of a slowing property sector is certainly a significant headwind given our reliance on commodities exports. However there is a caveat, even if you were not particularly optimistic about global growth, Australian investors have a significant advantage over their global counterparts. The nature of AUD means that it is a natural hedge against the volatility of global markets. What we mean here is that, because of the nature of our currency and its correlation with commodities, our investments should be able to significantly outperform and withstand any headwinds (especially USD based investments). In a bear scenario money tends to find itself going to safe haven currencies like the Yen and the USD. In fact, Australian investors with global exposures would’ve seen significant outperformance as a result of currency exposures which will, for the foreseeable future, continue to be the case.Closer to home, even if there are headwinds in the overall economy, the government put remains in place just as it is globally, whether you agree with it or not (thank god for 3-year election cycles?). And though Mr Lowe has ruled out QE, something in us thinks that when push comes to shove…..
This week we take a look at what makes a business an attractive investment opportunity and examine what we look for in our search for the next opportunity.
Here are some key points to look out for:
1 – The ultimate revenue model
There is nothing like waking up in the morning and knowing exactly what you are going to earn in the next twelve months. The same applies for businesses. We do like to see companies that have the bulk of their revenue contracted or recurring in nature. We look for these types of businesses as they have great visibility on their revenue going forward and typically offer a product or a service that is essential for their customers and difficult to replace.
Sticky revenue and sticky customers are a great start when it comes to evaluating a company. These types of companies tend to have less volatility in their earnings and so investors are willing to place high multiples on them compared to other listed stocks. Software and technology platforms and payment solutions companies come to mind when thinking about companies with this kind of revenue model, even “must have” professional services firms like accounting firms. Stocks we like and own here are EML Payments (EML.ASX, 90% recurring revenue), Altium (ALU.ASX, 60% recurring) and Infomedia (IFM.ASX, 95% recurring) and CountPlus (CUP.ASX, accounting services).
2 – Cash is king
There is a saying that ‘a company’s cash flows, are its profits on a truth serum.’ We think that this sums up one of the things we try and look for in any business. There are a seemingly endless number of accounting tricks that manifest as “profit” for a company but, at the end of the day, the cash flow statement never lies. You either have cash coming in or you don’t. Ideally, what we are looking for is a company that is able to convert at least 70% of their earnings into operating cash flow.
We also look at below the operating cash flow line, and see what capital investment is required to keep the business going and, more importantly, growing. The difference between these gives us the free cash generation of a company and that should, in most cases, equate to their net profits after tax. You would be surprised to know how many well-known market darlings don’t meet this simple yet important criteria. Retailer Noni B (NBL.ASX) and recruitment firm People Infrastructure (PPE.ASX) are some examples of companies we like in this respect.
3 – Build it once and sell it many times
Great businesses have developed a product or a service that, once complete, can be sold to many customers with little to no additional investment or expenditure required. We love these types of businesses because, as they scale up and grow, the majority of sales above the break-even point tend to fall straight to the bottom line. They tend to generate strong cash flows and have high margins. Again, technology platforms, software companies and payment solution providers form the majority of this category and it is not uncommon to see these types of companies generate Gross Margins in excess of 80% and earnings margins above 30%.
4 – Avoid value traps
There are A LOT of investors out there looking for value. Typically, true value investors are searching for deeply undervalued stocks that tend to trade on very low multiples, offer high dividend yields and are sometimes trading below asset backing. Similarly, growth-oriented investors are also looking for value but in a slightly different way. Their search involves stocks that tend to have low price/earnings-to-growth (PEG) ratios and trade on multiples that are, relatively, not as high as their peer group. In both cases it is important to distinguish perceived value from a potential value trap.
Many value investors get caught out in what initially seems to be a deeply undervalued company only to later realise the business is actually in structural decline. Growth investors sometimes get caught up in what seems to be a high growth company only to find out that the growth was not of a sustainable nature or that the comparable peer group has been de-rated dramatically. In both cases, analysing the historical trends of sales and margins can give some indication as to which basket a company may belong in. Some historical examples of value traps include traditional media and printing businesses while future value traps may emerge from the disruption to the banking and financial services industry and the shift to online sales when it comes to property or retail.
5 – The art of valuations, don’t be precisely wrong…
There are many ways to value a business. Most analysts and investors tend to use a discounted cash flow model (DCF) where by forecasting future cash flows and discounting back to today at a certain discount rate yields a company’s valuation. Others like to use price earnings (PE) and enterprise value (EV) multiples by comparing to an average multiple from a peer group of companies. We personally prefer a somewhat blended method incorporating all three as, unfortunately, each method has its flaws.
DCFs are easily manipulated by the chosen discount rates and trying to predict cash flows out into perpetuity is an almost impossible task. Comparing a company to a group of its peers is also risky. You may find the entire group of peers, or a few outliers, to be overvalued in nature thus distorting the average you are comparing it against. Additionally, these peers may have different fundamentals in play than the company you’re looking in to. Either way, it is important that investors do not get fixated on any one valuation method and learn to adapt and apply each to each company based on its own merits. We have always been advocates of the saying ‘We’d rather be approximately right, than precisely wrong!’