In the small-cap universe, few transformations are as profound as when a domestic success story becomes a true global operator. For Pureprofile (ASX: PPL), that turning point has arrived. In the September quarter, the company achieved a milestone years in the making: international revenue surpassed domestic sales for the first time in its history. It may sound like a statistic, but it represents something far more important, a validation of strategy, patience, and disciplined execution in a notoriously volatile industry.
From Research Boutique to Data-Driven Platform
Five years ago, Pureprofile was an Australian market-research firm struggling for relevance in a crowded local market. Fast-forward to FY26, and it has evolved into a global insights and data platform spanning 13 markets, with more than half its revenue generated offshore. The shift was neither sudden nor accidental. It was the product of a methodical internationalisation strategy, one that favoured building durable capabilities over chasing short-term growth headlines.
Pureprofile’s core proposition has expanded well beyond surveys and panels. It now delivers technology-enabled insight generation, allowing brands, agencies, and researchers to access high-quality, first-party data through a combination of human panels and automated platforms. In an era where data privacy and authenticity are paramount, that positioning has become immensely valuable.
The Mathematics of Global Scale
Numbers tell the story best. In FY21, offshore operations represented roughly 30 per cent of total revenue. Today that figure exceeds 50 per cent. This doubling of international exposure has fundamentally altered the company’s risk and opportunity profile. The UK and US markets, where Pureprofile has been deliberately investing, now contribute the lion’s share of global insights spending, together representing nearly 78 per cent of the total addressable market.
From an investor’s perspective, this diversification has three key implications:
Reduced geographic cyclicality; Australian advertising and research budgets are seasonal. Global diversification smooths those peaks and troughs.
Improved pricing power; International clients operate in more complex, higher-value research environments. That complexity commands premium pricing.
Higher margin potential; Platform-based revenue carries structurally higher EBITDA margins, and Pureprofile’s mix is tilting decisively in that direction.
Margins Built on Technology
Pureprofile’s management has long understood that profitability in this industry doesn’t come from human headcount, it comes from platforms. Roughly 20 per cent of group revenue now flows through technology-enabled channels, such as Data Rubico, the company’s self-serve insights platform. These products automate data collection, survey design, and analysis, cutting service delivery costs while simultaneously increasing client stickiness.
This evolution mirrors the shift seen in other SaaS-like models across the insights industry. Companies that successfully transition from project-based consulting to recurring platform usage often see EBITDA margins expand by several hundred basis points. For Pureprofile, the groundwork has been laid: scalable infrastructure, a growing base of recurring clients, and the operational leverage to monetise it.
Innovation as a Culture, Not a Slogan
Where many small-caps falter is execution fatigue, innovation gives way to maintenance. Pureprofile’s differentiator has been a relentless pursuit of product innovation. The company’s AI-driven research tools represent a structural leap forward. These tools use machine learning to segment audiences, predict survey outcomes, and reduce sampling bias, enhancements that elevate both data quality and speed to insight.
The result: higher customer satisfaction, lower churn, and stronger pricing power. It’s the difference between selling a service and selling a solution.
The US Opportunity: Playing on the Biggest Stage
If the UK was Pureprofile’s training ground, the United States will be its proving ground. The US accounts for over half of global market-research spending. Yet, despite the dominance of large incumbents such as NielsenIQ, Ipsos, and Dynata, there remains a substantial mid-market opportunity. Clients increasingly demand agile, transparent, and tech-forward partners, a gap tailor-made for Pureprofile’s model.
The company’s acquisition of iLink in Australia provided a template for how it might approach US expansion: disciplined valuation, cultural alignment, and integration that adds real capability rather than just scale. Management has hinted that strategic acquisitions could be on the horizon to deepen its American presence.
With a net-cash balance sheet and growing EBITDA, the company is well-placed to act when the right opportunity arises.
Financial Outlook: Growth With Discipline
Guidance for FY26, $63–64 million in revenue and 10–11 per cent EBITDA margins, signals a management team confident in both its trajectory and cost discipline. For context, this implies a near-doubling of EBITDA in just three years, alongside consistent top-line growth. Importantly, that expansion is self-funded. Pureprofile’s balance sheet remains unlevered, giving it optionality in capital allocation, whether toward acquisitions, technology investment, or potential capital returns in future years.
Valuation remains undemanding: 7-8× FY26 EBITDA for a business now structurally global, technology-enabled, and operating in one of the fastest-growing adjacencies to AI.
The Strategic Context – Data as the Fuel of AI
To fully appreciate Pureprofile’s long-term optionality, investors must step back and view it through the lens of the broader data economy. Every AI model, whether developed by OpenAI, Anthropic, or Google, depends on high-quality, permissioned data. The battle for differentiated datasets is intensifying, and companies that already possess longitudinal, verified consumer insights are becoming strategic assets.
It’s not inconceivable that in the coming years, AI developers or marketing-tech giants could look to acquire insights platforms like Pureprofile to enhance training data quality and consumer understanding. In this sense, Pureprofile’s growing global dataset, covering diverse geographies, demographics, and behavioural segments, may represent its most valuable hidden asset.
The TAMIM Lens – Quality Growth With a Margin of Safety
At TAMIM, we tend to look for businesses that combine three ingredients:
Earnings visibility: recurring or repeatable revenue models.
Operational leverage: where incremental sales translate into disproportionate profit growth.
Management alignment: leadership that thinks in years, not quarters.
Pureprofile now ticks each of those boxes. Its internationalisation strategy has created a natural hedge against domestic cyclicality. Its technology stack provides embedded leverage. And its management team has shown an ability to deliver on guidance consistently, an underrated signal of competence in the small-cap space.
The Competitive Moat – Not Just Panels, but Relationships
The market-research and insights industry is highly fragmented. The barriers to entry are low, but the barriers to trust are high. Pureprofile’s moat lies not just in its technology, but in its relationships with clients and panel members, built over years of transparent data practices and reliable delivery.
Moreover, its platform model means that every new client increases network value: more respondents, richer datasets, smarter algorithms. This flywheel effect strengthens over time and makes replication increasingly difficult for new entrants.
Challenges on the Road Ahead
No investment story is without risk. For Pureprofile, the key challenges are:
Execution risk in the US, competing with larger, better-resourced incumbents will require precise strategy and disciplined capital use.
Technology pace, keeping up with AI-enabled analytics and automation requires sustained R&D investment.
Currency exposure, as international revenue rises, foreign-exchange volatility becomes a more material factor.
Yet, these risks are the natural companions of opportunity. The fact that Pureprofile is now exposed to such dynamics is itself evidence of how far the company has come.
The Broader Investment Thesis
The global insights market is forecast to grow 6–8 per cent annually through 2030, driven by digitisation, privacy regulation, and the rise of predictive analytics. Within that context, Pureprofile occupies a sweet spot: small enough to be agile, established enough to be credible, and positioned at the intersection of data, technology, and marketing intelligence.
If management continues to execute, there’s a realistic pathway to doubling revenue again within five years, with EBITDA margins converging toward 15 per cent. At current multiples, that could imply significant re-rating potential as the market recognises its transformation from service provider to platform business.
Case Study: A Measured Globalisation Playbook
Pureprofile’s journey offers a blueprint for how smaller Australian tech firms can succeed globally:
Start with core capability, own a defensible niche domestically.
Export expertise, not ego, build relationships in select offshore markets before scaling.
Invest in process automation, technology is the bridge between small-cap resources and global reach.
Maintain financial discipline, fund growth through operations, not dilution.
In short, it’s about winning slowly but surely.
Valuation and Peer Context
When compared with peers in the global insights ecosystem, Pureprofile screens as deeply undervalued:
Company
FY26 EV/EBITDA
Revenue Mix
EBITDA Margin
Pureprofile
8×
51% International
10 – 11%
YouGov (UK)
14×
90% International
20%
Dynata (US, private)
~12×
80% International
18%
Even allowing for scale differences, the gap suggests room for multiple expansion as Pureprofile’s international revenues and platform margins grow.
Why Now Matters
Crossing the 50 per cent international threshold isn’t just a headline, it marks a structural re-rating opportunity. The market tends to treat companies as “local” until a clear majority of their revenue is global. Once that shift occurs, comparables change, investor coverage widens, and valuation frameworks evolve.
Pureprofile is at precisely that juncture. For long-term investors, such inflection points often represent the most asymmetric entry opportunities.
Looking Forward – The Next Chapter
Management’s focus now is twofold:
Deepening penetration in core international markets (UK, US, Europe).
Scaling platform revenue through Data Rubico and AI-enabled solutions.
These initiatives are mutually reinforcing, the larger the client base, the richer the data; the richer the data, the more valuable the platform. That flywheel, once fully spinning, could turn Pureprofile into one of the most attractive acquisition candidates in the Asia-Pacific insights sector.
TAMIM Takeaway
Pureprofile’s evolution from an Australian market-research boutique into a global data and insights platform is a story of quiet persistence and strategic patience. While the market has yet to fully recognise the scale of the transformation, the ingredients are now in place: a diversified revenue base, margin expansion potential, proprietary technology, and exposure to a structural growth industry.
At around 7× FY26 EBITDA and with a net-cash balance sheet, Pureprofile offers both value and optionality, a rare combination in the current market. For investors seeking exposure to the data economy without paying Silicon-Valley multiples, Pureprofile represents an inflection point in both growth and profitability. Its steady execution, expanding international footprint, and strategic alignment with the AI revolution make it an overlooked gem in the ASX small-cap landscape.
In a world where information is currency, Pureprofile isn’t just selling data, it’s building the infrastructure of insight.
Most investors like to think they’re making decisions based on hard numbers. They pore over charts, debate valuations, and argue about whether the economy is heading for a soft or hard landing. But the truth is, the most important determinant of long-term investment outcomes isn’t always what happens in markets. It’s what happens inside the investor.
The ability to take risk and the willingness to take risk are often lumped together. They shouldn’t be. Understanding the difference between the two, and managing that relationship well, can be the difference between building wealth steadily and watching opportunities slip away in a fog of uncertainty.
Ability vs Willingness to Take Risk
Your ability to take risk is an objective concept. It’s determined by financial capacity, the strength of the balance sheet, liquidity, investment horizon, and stability of capital. A sovereign wealth fund can endure volatility that would sink a family office. A retiree has different parameters from a 30-year-old entrepreneur.
Willingness, on the other hand, is a psychological concept. It’s about how much risk an investor is comfortable with, emotionally and institutionally. It’s about what keeps them up at night.
A mismatch between ability and willingness is one of the most common and under-discussed sources of poor investment performance. A portfolio that could afford to be bold but plays it defensively often sacrifices returns unnecessarily. A portfolio that wants to be bold but lacks the balance sheet to back it up is even worse, that’s how permanent capital is lost.
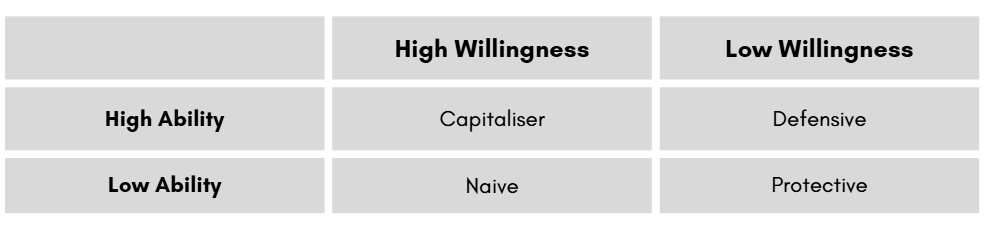
Four Investor Archetypes
A useful way to visualise this is a simple two-by-two framework:
Capitaliser: These investors have both the means and the stomach to take on risk intelligently. Think well-funded, long-term investors who can handle periods of drawdown without blinking. This is the ideal position to be in, if the risk is taken with discipline.
Defensive: Financially strong but cautious. These investors accept lower return potential to sleep well at night. In bull markets they may lag, but they tend to preserve capital better in downturns.
Naive: The most dangerous quadrant. High willingness to take risk with little capacity to absorb losses. This is how speculative manias end badly.
Protective: Low ability and low willingness. These investors prioritise capital preservation and often underperform, but their conservatism reflects their circumstances.
The point isn’t that one quadrant is “right.” It’s that misalignment is costly. A defensive investor with high ability can afford to take more risk than they do. A naive investor is one shock away from disaster.
Why This Matters More Than Forecasting
Too many investment processes start with macro forecasts: where rates are heading, what earnings will do, which sectors are hot. But none of that matters if the investor can’t stick with the strategy when volatility arrives.
In reality, markets spend a lot of time doing one thing very well, making people uncomfortable. Prices rise too quickly for the cautious and fall too sharply for the bold. Without clarity on risk willingness, discomfort turns into reactive decision-making. Investors sell near the lows, buy near the highs, and call it “bad luck.”
The most successful investors and institutions share one trait: their investment strategy is calibrated to their real tolerance for risk, not the one they wish they had.
The Real Cost of Playing It Too Safe
There’s a certain romance to being cautious. The idea of “protecting capital at all costs” sounds responsible. And for some, it is. But excessive caution for those who can afford more risk can lead to something just as dangerous as loss: opportunity cost.
A portfolio sitting heavily in cash or ultra-defensive assets may protect against short-term volatility, but over the long run it quietly erodes purchasing power and wealth. In an environment of moderate inflation and rising productivity, staying on the sidelines can be an expensive habit.
There’s nothing wrong with being defensive, if that’s where your willingness lies. But it should be a conscious, strategic choice, not the accidental outcome of fear.
Volatility Is Not the Real Risk
Many investors treat volatility as the enemy. Sharp drawdowns feel painful, and traditional finance loves to package risk into neat measures like standard deviation or Sharpe ratios. But volatility is not the same as risk.
The real risk is permanent capital loss, the kind that comes from forced selling, liquidity mismatches, or overleveraged positions that can’t survive a shock. Volatility, on the other hand, is often just noise. A temporary mark-to-market movement means nothing if the underlying business or asset remains sound and the investor has the staying power to ride through the storm.
Ironically, some of the most conservative investors suffer the most from volatility precisely because they treat every fluctuation as a signal to act. Those with longer time horizons, better liquidity, and clear risk willingness can afford to sit still.
Externalities: When Volatility Becomes Dangerous
Volatility becomes dangerous not because of the asset itself, but because of the environment around the investor.
A fund that prices daily and faces redemptions cannot ride out a storm the way a sovereign wealth fund can.
A retiree relying on portfolio income to fund living expenses experiences volatility differently than a 25-year-old.
A board with political or career constraints may feel forced to “do something” when markets turn down.
These externalities mean that two investors can own the exact same asset and experience completely different levels of risk. Recognising this is critical to aligning strategy with reality.
Liquidity, Leverage, and Flexibility
When discussing risk willingness, liquidity and leverage are key levers.
Liquidity: Some illiquidity can be beneficial, it can anchor investors to a longer-term view. But too much can be dangerous if cash flow needs are underestimated.
Leverage: Modest, well-structured leverage can enhance returns for strong balance sheets. But it must be paired with realistic assumptions about market shocks and refinancing risk.
Risk willingness isn’t just about attitude. It has to be operationalised into portfolio structure.
Performance Isn’t About Beating Peers
A surprisingly common but flawed goal in investing is “beating peers.” It makes for good marketing but bad strategy. For pension funds, family offices, or long-term investors, the real objective is simple: meet obligations and grow capital prudently.
Beating a benchmark while failing to meet your funding needs is meaningless. Conversely, lagging a peer group but hitting your funding targets is a success. The scoreboard matters less than the scoreboard most people don’t see, the internal one that measures whether your capital is doing its job.
Rethinking Performance Measurement
Short-term performance is often a terrible guide to investment skill. A good year may just mean a market tailwind. A bad year may reflect prudent caution. The only meaningful way to assess a strategy is across a full market cycle, through good times and bad.
A portfolio that keeps up in bull markets but falls less in bear markets compounds more effectively over time than one that chases every rally but crumbles when volatility bites. The willingness to stay the course through a full cycle, rather than demand instant validation, is what separates disciplined investors from tourists.
Practical Investor Reflection: Which Quadrant Are You In?
Before making your next allocation decision, pause and ask yourself three deceptively simple questions:
What is my financial ability to bear risk? Consider time horizon, liquidity, obligations, leverage capacity, and funding stability.
What is my true willingness to bear risk? Think beyond slogans. How much drawdown could you genuinely endure without panic or forced selling?
Are these two aligned? If not, how should the strategy adjust? More diversification? Different liquidity mix? Less exposure to high beta assets?
This exercise sounds simple. But most investors don’t do it honestly. They anchor to market narratives instead of their own reality. The result is predictable: strategies they can’t stick to.
The Psychology of Comfort vs Opportunity
Markets punish indecision. When willingness is lower than ability, investors often build portfolios they can’t commit to emotionally. They start defensively, get jealous of rising markets, chase risk late, then retreat at the first sign of volatility.
This is not an investing strategy. It’s a behavioural trap.
On the flip side, investors with clear, aligned willingness and ability move deliberately. They know when to be bold, when to be patient, and when to do nothing. Their portfolios reflect strategy, not sentiment.
Case Study Logic (No Names Needed)
Consider two hypothetical investors with the same $100 million in capital.
Investor A is well funded, long horizon, but extremely cautious. They sit heavily in cash and low-yield bonds. Over 10 years, their real purchasing power erodes. They sleep well but sacrifice upside.
Investor B also has high capacity but is reckless, taking outsized bets on illiquid assets with leverage. When the cycle turns, liquidity vanishes, and losses crystallise.
Investor C aligns willingness and ability. They take measured risk, manage liquidity prudently, and stick with their process through cycles. Their results compound quietly over time.
Investor C wins not because they’re smarter, but because they’re honest about who they are.
The Power of Strategic Alignment
In the end, markets don’t reward courage or caution in isolation. They reward consistency. Investors who build strategies they can live with through the entire market cycle tend to outperform those constantly at war with their own risk appetite.
If your ability is high but willingness is low, it may be worth questioning what’s holding you back. If willingness is high but ability is low, the portfolio needs to be restructured before reality does it for you.
This alignment is not static. As circumstances change, liquidity, goals, age, obligations, so too should risk willingness. A disciplined process revisits these questions regularly.
TAMIM Takeaway
Markets don’t reward the bold or the cautious. They reward those who know themselves.
Understanding your willingness to take risk is not an academic exercise. It is the foundation of a resilient investment strategy. Forecasting, valuation models, and macro narratives matter, but they all sit on top of this psychological and structural bedrock.
The investors who thrive are not those who avoid risk but those who own their relationship with it.
Few companies are more deeply embedded in the Australian economy than Woolworths. It sits at the heart of everyday spending, riding the same tailwinds and headwinds that shape the national mood. When households tighten their belts, Woolworths feels it in the aisles. When economic optimism rises, it benefits quickly. After a challenging FY25, the supermarket giant has now released its Q1 FY26 sales results, and the story is one of quiet stabilisation. Not a roaring comeback, not a structural reinvention, but a methodical retail turnaround built on price, simplicity and execution.
That might not sound thrilling, but for long-term investors, this is exactly the kind of story that creates enduring value.
A Reset Year
Let us rewind to FY25. Woolworths reported group sales of $69.1 billion, a modest 1.7 percent increase. Group EBIT before significant items fell almost 15 percent, and net profit before significant items dropped 19 percent year on year. The drivers were clear. Wage inflation, price investment to protect market share, margin pressure in Australian Food and underperformance at BIG W all weighed on the bottom line. The company spent the year defending its position and setting the stage for a reset.
At the time, management outlined three strategic priorities. First, get it right for customers. That meant sharper value, more consistent availability and stronger convenience propositions. Second, simplify the way the business works, with a $400 million above-store cost-out target by the end of calendar 2025 and major investments in automated distribution. Third, unlock the full potential of the group through portfolio rationalisation and operational focus. The sale of MyDeal and integration of Healthylife into core operations were part of that plan.
In short, FY25 was less about results and more about building a platform to deliver them later. That kind of year rarely excites investors. But it often sets up the stories that do.
Early Signs of Traction
Q1 FY26 is the first real test of whether Woolworths’ plan is working. The 14-week period to 5 October 2025 showed group sales up 2.7 percent year on year to $18.5 billion. Australian Food, the engine room of the business, was up 2.1 percent overall and 3.8 percent excluding tobacco. Group eCommerce sales grew 13.2 percent, with On Demand orders increasing 39 percent. New Zealand Food continued its turnaround, with sales up 3.2 percent in local currency. Even BIG W, which dragged results in FY25, delivered modest sales growth of 1.0 percent.
Perhaps more telling than the raw numbers were the signals from customers. Woolworths’ Voice of Customer Net Promoter Score rose 3 points on the prior year and 4 points on the previous quarter. Value for Money VOC rose 5 points year on year. Prices excluding tobacco fell for the seventh consecutive quarter. These are not glamorous metrics. But they are the sort that tend to precede sustained volume improvements and, in time, margin recovery.
Average weekly traffic on Woolworths’ digital platforms grew to 29.3 million. More than 750 products now sit in the Lower Shelf Price program, which is growing units at double-digit rates. The company is delivering on its promise to make Woolworths feel more affordable again, not by flashy promotions but through persistent price resetting and strategic offers through Everyday Rewards.
This is the foundation of a retail turnaround. It does not happen overnight. It builds quarter after quarter.
Australian Food: Stabilising the Core
Australian Food is the beating heart of the Woolworths investment case. It generated $51.5 billion in sales in FY25 and remains the group’s primary earnings driver. FY25 saw margins squeezed as Woolworths fought to maintain price competitiveness while managing labour cost pressures. Q1 FY26 hints at the early stages of stabilisation.
Excluding tobacco, sales grew 3.8 percent, a notable improvement on FY25 trends. Comparable sales grew 1.6 percent, supported by increased items per basket and improving availability. Fresh food categories led the way, particularly Chilled, Meat and Fruit, while Long Life categories remained soft but stable. Tobacco remains a significant drag, declining over 50 percent year on year.
Importantly, price deflation is no longer creating panic. Fruit and vegetables moved into deflation due to higher supply of berries and avocados. Long Life categories saw modest deflation. For investors, this matters because it reflects an environment in which Woolworths is controlling the deflation rather than being whipsawed by it. It is using lower prices as a deliberate competitive lever, supported by its scale, distribution advantages and digital engagement.
Ecommerce penetration rose to 16.2 percent. The company’s On Demand delivery and MILKRUN offerings continue to expand rapidly. This is one of the clearest competitive advantages Woolworths holds over traditional retail peers and smaller independents. It is a moat that is expensive to build and difficult to replicate.
New Zealand Food: A Quiet Turnaround
New Zealand Food was one of the brighter spots in FY25, and that momentum has carried into Q1 FY26. Total sales grew 3.2 percent in local currency. VOC NPS improved by six points year on year, with meaningful gains in both store controllable metrics and online experience. Ecommerce penetration rose to 16.8 percent.
The rebrand to Woolworths New Zealand is progressing ahead of schedule. Everyday Rewards membership in New Zealand increased by around 250,000 members over the past year, with engagement improving significantly. This is a market that was once a drag on group results but is now beginning to pull its weight.
For long-term investors, the significance is subtle but important. A stabilised and growing New Zealand operation provides earnings diversification and reduces the reliance on the core Australian supermarket business to carry the entire group.
BIG W: From Problem Child to Possible Contributor
In FY25, BIG W posted an EBIT loss of $63 million. The business was squeezed by clearance activity, soft discretionary spending and operational complexity. In Q1 FY26, BIG W sales grew 1.0 percent, and gross transaction value rose 5.7 percent, supported by stronger performance in Clothing and Toys. Ecommerce penetration grew from 12.5 to 17.3 percent. BIG W Market, which is now integrated into the broader platform strategy, saw sales surge 148 percent.
This is not a turnaround story completed. It is a turnaround story beginning. Management is transitioning BIG W to an independent technology platform in FY26, aiming to drive better efficiency and flexibility. If the business can sustain mid-single digit GTV growth and gradually expand margin through mix and efficiency, it can shift from being a drag on group earnings to a contributor.
In a market where investors are fixated on Woolworths’ core supermarkets, this is an underappreciated lever.
B2B: The Quiet Performer
While less visible, the Australian B2B segment continues to perform solidly. Q1 FY26 sales increased 6.2 percent, driven by PFD Food Services and Export Meat. Export Meat sales surged over 30 percent due to strong international beef markets. B2B Supply Chain revenue excluding tobacco grew modestly, supported by the expansion of Primary Connect’s customer base.
This segment provides incremental earnings resilience and diversification. It is not a growth rocket, but in retail, stability has value.
Why This Matters for Investors
The Q1 results are not fireworks. They are not meant to be. Woolworths is not trying to reinvent itself as a high-growth retailer. Instead, it is aiming to execute better. After several years of cost pressure and consumer strain, that might be the smarter strategy.
There are three key investment implications.
First, stabilising the core. Australian Food remains the profit engine. As price investments mature and inflation stabilises, Woolworths can capture more operating leverage from its fixed cost base. Volume recovery tends to lag customer sentiment improvements, and early signs suggest that lag is now narrowing.
Second, digital scale matters. Ecommerce growth of 13.2 percent is not just a sales figure. It reflects a structural advantage built through years of investment. Competitors can offer promotions. They cannot replicate nationwide delivery and pickup infrastructure overnight. This creates a durable moat.
Third, portfolio simplification is starting to work. Closing MyDeal, integrating Healthylife and repositioning BIG W and Petstock are reducing noise and focusing capital where it counts. Investors often underestimate how powerful simplification can be in improving group returns.
The Next Test: Christmas Trading
Q2 is always the critical quarter for Woolworths. It covers the Christmas trading period, when consumers spend more freely and retailers battle for share of wallet. Management has already indicated that Woolworths Food Retail sales in Q2 to date are up 5 percent excluding tobacco. This is encouraging. It suggests that the pricing and value investments are translating into stronger momentum heading into the festive season.
This quarter will not only set the tone for FY26 earnings but also determine whether the market begins to re-rate Woolworths from a defensive stalwart back to a business with modest growth and improving margins.
Valuation and Market Positioning
Woolworths currently trades on a multiple consistent with its reputation as a defensive blue-chip. The market has largely priced in modest growth and stable earnings, not a material reacceleration. If the company delivers on its guidance of mid-to-high single digit EBIT growth in FY26, this expectation may prove too low.
Unlike some of the fast-growing but operationally volatile retail names, Woolworths has a strong balance sheet, deep operational infrastructure and structural digital advantages. This creates a classic setup. If management executes, there is scope for both earnings growth and multiple expansion over time. If not, the business still offers stable cash flows and a sustainable dividend.
For investors seeking optionality without excessive risk, this is an attractive mix.
The TAMIM Takeaway
Woolworths is not trying to be flashy, it is quietly rebuilding. The company is focusing on price and value perception to reconnect with its customers, using its digital scale to strengthen its competitive position and simplify its portfolio to sharpen execution. These steps are beginning to show tangible results in customer sentiment, sales momentum and operational clarity. The Q1 FY26 update is an early proof point that Woolworths is on the right path, but the more telling moment will come through the key Christmas trading period in Q2. If the current trajectory holds, FY26 could represent a meaningful inflection point, shifting the business from playing defence to delivering disciplined growth. In a high-rate, slower-growth environment, this kind of measured, fundamentals-driven turnaround is exactly the type of story that markets tend to reward.
Disclaimer: Woolworths Group Ltd (ASX: WOW) is held in TAMIM’s Equity Income IMA’s as at date of article publication. Holdings can change substantially at any given time.
This week’s TAMIM Reading List explores global tension, technological shifts, and the power of storytelling. Japan’s convenience stores are turning to offshore-controlled robots, while Australia’s submarine program promises to reshape the nation’s industrial base. In the US, debt levels are set to surpass even Italy and Greece, and the country’s EV policy reversal could play straight into China’s hands. Locally, WiseTech finds itself under regulatory scrutiny, and Brisbane students face exam chaos after being taught the wrong syllabus. Finally, we unpack how the structure of a story can directly shape the way we remember it, scientifically speaking.
This week’s TAMIM Reading List explores fragility, friction and trust at a global scale. America faces the possibility of population decline for the first time, while confidence in the judicial system reaches a historic low. A looming tariff war escalates tensions between China and the U.S., and Ukraine’s energy standoff with Russia triggers deeper economic pain. In science and tech, AI-designed proteins raise critical biosecurity concerns, while the collapse of TV’s “Golden Age” signals a shift in cultural appetite. We also dive into the legal battle over fat substitutes in protein bars, a story that blends biotech, branding and big business.


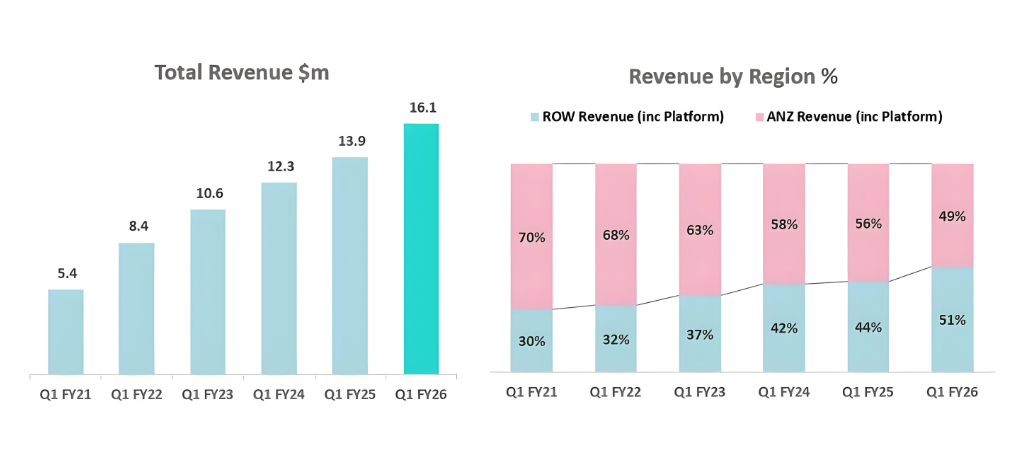 Source: Pureprofile Limited (ASX: PPL) – Q1 FY26 Quarterly Report Investor Presentation