The Pain Report will provide you with a weekly independent and objective commentary on the global economy, in an attempt to help you identify the key forces which will shape the world in the years ahead. For example, I believe that the most significant and defining economic phenomenon of our time is the rise of the Asian middle classes. I urge you to beware the prism through which you view the world, and to be aware that much of the western media’s negative and sensationalist coverage is biased against the so-called emerging nations. In my view, the decades ahead will see an era of prosperity, enlightenment and opportunity that very few today are predicting. If any of the above resonates with you then please read “The Pain Report”.
My goodness there is a lot to talk about. When I started this weekly version of The Pain Report I envisaged writing a snappy, relatively brief update. That, it seems, is impossible. There is simply far too much going on to be snappy, so please forgive me.
Incidentally, and before I get lost in the maze of markets, you are allowed to circulate my weekly without my permission…a number of you have asked…thank you.
I know many of you will want to talk about Donald Trump and also that ‘sizzling’ Australian GDP report, and perhaps even the overnight non-farm payroll report. We will. But before we do let’s look at the charts and see for ourselves how impressive and powerful the ‘bounce’ has been.
Two weeks ago, on Saturday 20 February, I wrote: “In times such as these I rely on the charts. Listen to what the market is telling you.They are looking forward, not backward.
Right here and now equity markets look like they want to move higher. Not surprising given how far we have fallen. The two charts below (Dow Jones Transportation Index and the Russell 2000, tell me that markets want to go higher) Don’t forget it was these two markets which led the broader indices lower.”
First up the Dow Jones Transportation Index.
That’s a 19.55% rally from the low! In fact at its high this morning, it was up more than 20%, which qualifies as a bull market, and all in a matter of weeks. The Russell 2000 (US small cap stocks) has seen a similarly explosive rally.
But if you’re talking explosive, then take a look at the Brazilian market.
Ibovespa Brasil Sao Paulo Stock Exchange Index
So what happened in Brazil? The former President Lula da Silva was arrested, and on 3 March we found out that Brazilian GDP shrank 3.8% in 2015. If the consensus 2016 forecast for GDP of a further decline of 3.5% turns out to be right, then back-to-back declines of that magnitude would amount to the longest and deepest downturn since Brazil began keeping records in 1901, yes worse than the Great Depression. You see it’s not so much the numbers themselves that are important, but the way that the markets react to them that is important. The market’s reaction tells you about market positioning and hence investor sentiment. In Brazil, investors were short.
C’mon JP I don’t give a fig about Brazil, what about the rally in Aussie banks?
ANZ.ASX
CBA.ASX
And we’ve still got Donald and ‘sizzling’ Australian GDP to talk about! The suspense is simply overwhelming.
Earlier in the week I stayed overnight on the central coast of New South Wales, about an hour or so north of Sydney.
For those not resident in Australia it looks nothing like South Wales. I decided to leave early in the morning for Sydney, so as to beat the traffic, at about 5.15 am. I got stuck behind a big truck going up a hill. I won’t tell you for how long because it is embarrassing. I couldn’t overtake. It was pitch black and a bit foggy. Poor visibility and all that. But the real reason I chugged up the hill doing no more than 25 km/h was the MASSIVE volume of traffic hurtling along in the outside two lanes. Once or twice I indicated and tentatively nudged out to overtake and a hundred ‘utes’ instantly hooted their indignation. I was a condemned man, trapped in the slow lane, a hostage to the ‘multiplier effect’ of the Sydney housing boom. Electricians, bricklayers, carpenters, builders, plumbers, carpet layers…all hurtling to the great building site we call Sydney. How many people are involved in the construction and sale of a single property then multiply that by 100,000 or so? New houses, new ‘utes’, new tools, new clothes and the ‘multiplier’ begins. Napoleon Bonaparte once said that Britain was a nation of shopkeepers. Australia has become a nation of real estate agents. The banks, the property industry and all the homeware/hardware companies, the construction industry and maybe the fund managers too have all become ‘agents’ of the real estate industry.
It is of course impossible to quantify the full value or multiplier effect from housing.
Some of you will recall my view that America was experiencing a housing and construction bubble in 2005 and 2006.
I said then that America had gorged at the trough of debt for far too long and that they could not forever defy the laws of economics. C’mon JP you can’t compare the Australian housing market with America. And I’m not, and I don’t need to, because the average SINGLE house price to average SINGLE income ratio is, as you know, far, far greater in Sydney than it was in San Francisco, Miami, Stockton, Dallas, Chicago, New Orleans, Memphis or New York. Now that house prices are declining we can debate how far they will fall. We can indulge ourselves in all kinds of statistical wizardry and dismiss declines in median house prices and publish ‘hedonic’ measures that look so much more palatable. A footnote here is worthwhile: CoreLogic published its monthly report showing Sydney home values rose 0.5% last month. CoreLogic, however, also said that the median house price in Sydney in February was $730,000, down from $776,000 in January and much lower than November’s $810,000. Hedonic measures, as you all know, adjust for the changes in the ‘quality’ of the houses in the survey sample.
Let’s stop all this nonsense. The fact is house prices are declining. The sensible debate is about how much further they will decline. If you accept they have fallen about 10% since September 2015, which you probably won’t, then they have in my view about another 20% to go. That’s all I’m saying for now, and as time goes by I reserve the right to say it might be more. The more important issue I believe is how much of a correction in housing construction will there be? Or put another way, when will I be able to overtake that truck without being run down by ‘utes’. Looking at the chart below of ‘Australia building approvals total building value’, you can see that it appears to be rolling over. You hopefully will also see that I have overlaid a 12 month moving average as the data series is ‘lumpy’ to say the least.
Australia Building Approvals
You will also see that we have been here before, back in 2009, but the 12 month moving average looks like it has peaked. This suggests to me, all things being equal, that the economy slows significantly through 2016 and into 2017.
Which brings me to the ‘sizzling’ Australian GDP report. The Australian economy grew 0.6% in the fourth quarter of 2015 and 3.0% over the year. These figures were much stronger than anticipated. In terms of the contributions to quarterly real GDP they were as follows:
Private consumption +0.4%
Private Investment -0.4%
Government consumption and investment +0.3%
Change in inventories +0.2%
Net Exports 0.0%
And for the eagle-eyed amongst you, there was a ‘statistical discrepancy’ of +0.1% to make it all add up to + 0.6%.
So what have we learned so far, and I am keen to get to Donald, Household consumption was strong at +0.4%, comprising two thirds of the growth in the quarter. Also, that the government sector contributed 50% of the real GDP growth in the fourth quarter. In addition we saw a continuation of the ‘national income recession’ with ‘real net national disposable income’ declining by 1.1% in 2015. A trip to the Australian Bureau of Statistics is in order and in the words of the ABS.
A broader measure of change in national economic well-being is Real net national disposable income. This measure adjusts the volume measure of GDP for the Terms of trade effect, Real net incomes from overseas and Consumption of fixed capital.
So to bring our Australian GDP discussion to a close, the best is now behind us and the tailwinds have turned into headwinds, and I’ll leave it there for now.
Now finally to Donald Trump. Donald Trump will win the Republican nomination BUT he will not win the presidential election. He does indeed create good theatre and in an age of social media and bumper sticker headlines he is an extraordinary phenomenon. In the eyes of his adoring fans he can do no wrong. They believe that he will ‘make America great again,’ and that’s all they care about. What that actually means is that we(America) will do whatever we want, whenever we want, to whomever we want. I will leave you to fill in the blanks as to what this means. But let’s be clear on a vital point, the forthcoming election in November does matter. You may not know the name of the Belgian Prime Minister, but everyone knows who the President of the United states of America is. Because it matters who the Commander in Chief of the world’s most formidable military machine is. Yes, I know, the thought of Donald and Sarah in the Oval Office together is not funny…but it won’t happen…
Next week I want to write about Saudi Arabia.
But, before then lets wrap up this longer than anticipated weekly with some thoughts about markets. Across the board you have to be impressed with the price action in markets. Can we go higher still? Of course we can. Perhaps up to the 200 day moving averages across the major market indices. In Australia this means levels on the ASX200 of about 5240.
The trend is your friend. Do I still see a deleveraging taking place across Asia? Do I still see deflationary winds blowing in from the east? Yes I do. I never subscribed to the views of a recession in America and stated that view here in previous reports. The Chinese have stabilised the RMB, for the time being, but will depreciate it further down the road. The oil market has stabilised, in fact oil prices have soared. Sovereign wealth funds have stopped selling for now. So global equity markets having crashed and being very oversold, have now rallied sharply. I have been buying Australia and Japan, for the first time in a long time. But this is not a set and forget market. In conclusion I would use this rally to lighten any overly concentrated positions you may have.
Have a great weekend.
PS The PM of Belgium is Charles Michel.PPS Non-farm payroll rose a stronger than expected 242,000 and yes the US economy is doing fine.
Michael Newbold from the manager of the TAMIM Australian Equity Growth IMA reviews the investment case for the DUET Group. With continued worries about the sustainability of the Banks dividends, this stock may be worthy of a better look. It offers a best in utility sector yield of 8.3% unfranked.
Michael Newbold from the manager of the TAMIM Australian Equity Growth IMA reviews the investment case for the DUET Group. With continued worries about the sustainability of the Banks dividends, this stock may be worthy of a better look. It offers a best in utility sector yield of 8.3% unfranked.
Investment view
DUET Group (DUE) is an owner of utility assets in Australia, the US and Europe. DUE owns controlling stakes in three regulated energy utility assets across Western Australia (Dampier to Bunbury Pipeline) and Victoria (United Energy, Multinet Gas), 100% of a pipeline developer (DBP Development Group) and 100% of a Remote Energy and Clean Energy power generator (Energy Developments, EDL).
Since listing in 2004, DUE has evolved from being an externally managed asset owner/ investment fund to an internally managed asset owner/operator with an EV of over A$18bn.
DUE has been evolving its business over recent periods, focusing on lowering its exposure to regulated revenues and looking for more growth opportunities. While the recent EDL acquisition arguably increased the pure financial risk profile for DUE, it diversified the earnings base away from the regulated earnings stream which is likely to be pressured from future regulatory resets.
Additionally, the acquisition provides an avenue for growth which was likely to be limited to the DBP Development Group business given the unlikely need for an expansion of the Dampier to Bunbury pipeline in the short term and ongoing pressure on electricity and gas networks to cut capex and lower costs to consumers.
DUE trades on an unchallenging 11.7x FY17 EV/EBITDA and offers a best in utility sector 8.3% unfranked yield with minimum expected growth of 2.7% pa through FY18. With Management executing on transactions well and finding growth in a tough market, we continue to see a solid outlook for the business.
Recent transaction
DUE recently raised A$230m to fund the acquisition of the remaining 20% of theDampier to Bunbury Pipeline (DBP) that it didn’t already own.
The DBP, located in Western Australia, consists of c1539km of mainline pipe, 1228km of loop pipe and 300km of lateral pipe. It has 10 compressor station sites with a total of 27 compressor units and a full haul capacity of 845 TJ/day. The pipeline is expected to be in service for at least the next 50 years. Almost all of DBP’s revenue is derived from contracted gas transportation tariffs, charged to wholesale customers for shipping gas along the Pipeline
The acquisition price implied 10.5x CY15 EBITDA and 0.94x Regulated Asset Base (RAB, Dec 2015). Regulated assets such as the DBP generally trade at a multiple of their RAB of between 1.2-1.5x and recently transactions in the space have been priced at in excess of 1.6x RAB (Transgrid recently transacted at 1.64x its RAB). However, given DUE’s existing control over the asset, and other specific factors (e.g. information requirements), the vendor was unable to run a competitive process and DUE was able to secure the asset for a very attractive price.
The transaction was valuation accretive, simplifies the ownership structure and may provide synergies by allowing for a further combining of operations between DBP and the DDG.
Outlook
While there are some risks around the regulatory outlook for DUE’s networks, these have broadly been factored into the market’s forecasts and Management DPS targets have factored in worst case outcomes from these reviews. Furthermore, growth from EDL and the DBP Development Group should largely offset potential weakness.
DUE has also made recent announcements updating the market on EDL’s growth projects. These include a new 21MW waste coal mine gas power station at Grosvenor (Anglo American). This was expected and commissioning is due in April 2017. Secondly it will build, own and operate the 4MW Coober Pedy Renewable Hybrid Power Project. Construction to commence in September 2016 with commissioning in 1H FY18. No details were given of capital expenditure or expected returns but we note that these projects will pad out the growth profile for DUE.
Post transaction, Management has reaffirmed DPS guidance over 2016-2018 of 18cps growing to 19cps. With this transaction adding to cashflow, and recent announcements such as the one detailed above there should be upside pressure to this in FY17 unless management looks to improve free cash flow metrics (which would be positive for valuation in any event).
Catalysts
Catalysts for share price performance include contract wins in the DDG and EDL business units,
Better-than-expected outcomes from the DBP regulatory reset and United Energy regulatory reset (final decision due imminently),
Activity in relation to SKI selling down its stake and
Potential corporate activity as underbidders in the NSW electricity privatisation process potentially looking to acquire other regulated asset holders.
As we have said before, it is highly unlikely you will find our investments in well-presented good news stories with a strong investor following that always seems to find a way to explain lofty valuation multiples. We are in the business of looking for mispriced assets in the share market that will make us money.
This weeks stock pick is from our TAMIM Australian Equity Value (TAEV) portfolio. The underlying fund, which is headed by James Williamson, has achieved a return after fees for investors of 18.4% over the last year, compared to a return of the ASX 300 of negative -9.5%.
As we have said before, it is highly unlikely you will find our investments in well-presented good news stories with a strong investor following that always seems to find a way to explain lofty valuation multiples. We are in the business of looking for mispriced assets in the share market that will make us money. Over the years we have been successful investing in two areas of the market: Firstly, we have exploited opportunities in stocks that have been oversold as they have disappointed (or more ideally embarrassed) investors the most in recent years. Many of these companies attract the attention of short sellers; UGL and BRS are recent examples of ours. The second area we have invested in is small to mid-sized companies that are not actively followed by sell side researchers and institutional funds in Australia due to low free float or liquidity. Nuplex is a prime example of this investment strategy.At the inception of the underlying fund in late 2013, NPX was exactly the type of company we were looking for. Although management had already made significant progress transforming the business from a structurally challenged local manufacturer and distributor (that struggled during the Global Financial Crisis), to a global chemicals company, the entity still travelled under the radar of the investment community. We just loved seeing blank faces when we mentioned NPX as one of our key investments, as it reaffirmed our view that the business was simply forgotten about, unknown or misunderstood by potential investors. The primary listing on the NZ exchange and the fact that the company had no direct listed peer to benchmark against added to the confusion. We acquired our NPX shares in late 2013 on a 7% dividend yield and 10x price to free cash flow multiple, with good prospects for growth and improved margins.
The transformation of NPX over ten years has been significant; the Australia & New Zealand and Specialties business contribution to EBITDA decreased from 86% in 2005 to only 9% in 2015. The Specialties business was sold in late 2014. Under the capable leadership of Group Chief Executive Officer Emery Severin, the company cut costs and re-deployed capital from the declining Australia & New Zealand manufacturing sector into key manufacturing hubs in Europe, Asia and the US.
Unlike many businesses which we believe are at risk of major technology disruption from new entrants, in the specialised and relatively small resin sector innovative technologies and products based on new chemistry are been developed by research and development programs of existing incumbents. This is probably because the sector is considered unexciting by many and the profit pool is too small to attract significant outside interest. Furthermore, an outsider is likely to incur considerable losses building a meaningful research and development program from a standing start. The recent NPX Acure launch is one such example of a new chemistry product development which can take years from initial idea to market launch. Acure’s competitive advantages include faster and controllable dry time, longer pot-life and the ability to cure at lower temperatures. The growth prospects of Acure could be material to NPX over the next few years. Overall, although we will see technology improvements from existing participants over the years, the resins sector itself will remain centered around the binding, enhancing and protecting of houses, cars, boats, swimming pools, furniture and fabrics for the foreseeable future.
The changing nature of NPX’s EBITDA Source: Wentworth Williamson
Another important feature of NPX and the resin industry is that it is one of the few industries where it is not economically viable to move production to China to service the World resin demand (although it is important to note that NPX has existing operations in China to service the manufacturing industry domestically). The industry requires relatively small scale localised manufacturing operations given the reliability and timing of supply to global supply chains and only comparatively small quantities are needed for the finished product (such as a car).
On the 15th of February 2016, NPX announced that the Board had received an indicative, non-binding, conditional proposal from Allnex) to acquire all its shares for NZ$ 5.55 per share (including the recently announced dividend, which therefore equates to a price of NZ$5.43 per share after the dividend payment). Private Equity backed Allnex is a very similar business to NPX but is approximately 50% bigger. We always felt it would make strategic sense to bring Allnex and NPX together to form a leading, global, independent coating resins producer. We will have an opportunity to vote on the merits of the proposal later this year. At the offer price, our return on our initial investment including dividends would be a very satisfactory return over 80%.Conclusion
While it has been a very tough year for global share markets, and we understand a lot of Australian investors with concentrated blue-chip portfolios are also suffering from a period of negative returns. For those of you reading this at home and sitting on your hands because of concerns about the global economy, and for fear of locking in losses on positions in the last year, we think it is worth noting that value funds prosper in these volatile conditions.
The Fund represents the Wentworth Williamson Australian Equity Fund net of fees and with distributions reinvested. The Index Represents the ASX 300 Accumulation Index and Cash represents the RBA Cash rate.
For those invested in the underlying fund from inception, a million dollar investment would be worth $1,353,829 versus an investment in the market being worth $1,114,546. It is worth reiterating our opening comments: “The underlying fund increased 18.4% for 12 months to March 2016 compared to negative -9.5% for the S&P/ASX 300 Accumulation Index. Furthermore, in a quarter where the market dropped by 2.6%, it was pleasing to see the fund increase by 2.0%. While this won’t always be the case, our primary focus on capital preservation typically sees the fund meaningfully outperform the general share market during down or flat markets.”
Happy investing,The team at TAMIM.
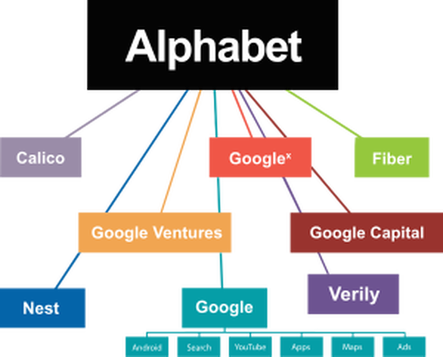
The TAMIM investment team is always diligently researching, reading and scouring the internet for information and ideas that will shape our investing future. Ever since Google renamed to Alphabet we bump into friends and clients alike who wonder what this new company is all about. This week we decided to take the opportunity to explain the various working components of the new Alphabet.
The TAMIM investment team is always diligently researching, reading and scouring the internet for information and ideas that will shape our investing future. Ever since Google renamed to Alphabet we bump into friends and clients alike who wonder what this new company is all about. This week we decided to take the opportunity to explain the various working components of the new Alphabet.
Google’s Larry Page released a letter last August 2015 announcing the re-configuring of Google into a conglomerate called Alphabet.It described Alphabet as a new holding company that would be composed of the following independent operating units:
The Google search engine and related businesses—including Android, Gmail, and YouTube, to name a few;
Calico – the health care company whose goal is to lengthen life expectancy;
Verily – the home of the company’s “smart” contact lens;
X previously Google X) – its R&D arm;
DeepMind – artificial intelligence;
Access – all of the company’s high-speed Internet initiatives;
Jigsaw – the think tank/tech incubator formerly known as Google Ideas.
It is going to be quite amazing to watch the growth of a company that quite literally is changing the world on front of our eyes. To read more click the following article.
At TAMIM we invest in stocks – not markets. The recent volatility in markets has highlighted to investors the need to own high quality growth stocks in their portfolios. Our partners at CBG utilise their growth focused investment style to highlight an interesting Australian investment, SpeedCast.
This week Michael Newbold from the manager of the TAMIM Australian Equity Growth IMA takes time out to discuss SpeedCast. While the Australian stock market seems to have taken a hiatus from its downward movements, it is extremely important to remember that this is not a set and forget market. You constantly need to be reviewing your portfolio and much like we do in our portfolio committee’s, constantly re-evaluate your investment thesis for holding a particular position. It is also extremely important to review the various asset classes and investment styles of your investments. We know that your asset allocation decisions will be as important as your stock picking decisions. For a further discussion on asset allocation and stock picking please call us to arrange a time for one of our directors to meet with you.
SpeedCast is a high growth telecommunications business with leverage to increased satellite services demand and VSAT (two-way satellite ground station with a dish antenna that is smaller than 3 meters) penetration to deliver these services. Through organic growth and acquisitions, SpeedCast has strengthened its competitive position in high growth industry verticals & emerging geographies across APAC.
At the FY15 result in February, SpeedCast delivered 38% revenue and 42% EBITDA growth despite FX headwinds (20-25% of revenue is in AUS/EUR vs reporting currency being USD). Management is targeting double digit organic revenue and EBITDA growth pa over the medium term while progressing with its acquisition strategy in order to build out its verticals e.g. energy or martime. The industry is highly fragmented with the majority of competitors being localised with lower quality-of service, inferior expertise/technical capabilities, and diseconomies of scale. This provides synergy opportunities for SpeedCast.
SpeedCast is currently trading on 33x FY16F EPS with a modest 2.7% yield. It offers strong double digit organic revenue and EBITDA growth plus upside from acquisitions. Please note that EPS is impacted by amortisation of customer contracts. SpeedCast is trading at a more modest 19x adjusted for this impact.
Company background
SpeedCast is a leading provider of satellite-based communication networks and services in the Asia Pacific region and to the global maritime industry. It designs, implements, integrates, operates and maintains communications networks combining satellite capacity and network infrastructure. SpeedCast also provides a range of value-added products and services, including user applications (voice, video conferencing and video surveillance), network optimisation (firewalls, filtering and data compression) and network monitoring and management (including reporting tools and remote access for IT technicians).
SpeedCast serves over 1,000 customers across over 3,000 terrestrial sites, predominantly in Asia Pacific (though its global presence was enhanced over CY15), and 1,700 offshore rigs and vessels with satellite services. SpeedCast is headquartered in Hong Kong but has a local (Australian) management presence.
What do satellite service providers do?
Satellite-based communications networks enable real-time broadband communications in areas where traditional terrestrial infrastructure is either unavailable or unreliable (eg due to war, natural disaster etc). It provides remote users with digital communication capabilities similar to those available at the corporate office. This includes making telephone calls, providing internet access and running applications to facilitate everyday operations. SpeedCast’s communications network has a global reach that uses 60+ different satellites, 15 different satellite operators and 30+ teleports. SpeedCast’s two largest customer groups are maritime and energy, which accounted for 31% and 18% of CY15 revenue respectively.So how does SpeedCast make money?
SpeedCast generates five main types of revenue that can be classified into three buckets: service revenue (fixed monthly fees), equipment revenue (sale of equipment on which they earn a margin) and wholesale VoIP revenue. Key industries for SpeedCast are set out below along with example customer industries.
How big is the addressable opportunity?
The global satellite services market is estimated by management to be worth US$5-6bn with SpeedCast’s biggest competitor having a c6% share (vs SpeedCast at c3%). The industry is therefore highly fragmented and a strong candidate for consolidation.Key earnings drivers
Growth in demand for satellite communication services by the maritime industry. Strong growth in this area is likely to be driven by acquisitions, the upgrading of older satellite systems to VSAT technologies, rising demand for bandwidth, improving crew welfare via entertainment and communications and tightening regulatory requirement involving safety systems.
VSAT continuing to gain market share. Very Small Aperture Terminal (VSAT) technologies offer two-way communication via antennas and small satellite dishes and are SDA’s primary offering. VSAT is cost effective, provides ample bandwidth and is available for use in remote locations. Increasing MSS penetration is a risk. SDA increasing its market share of the VSAT providers. SDA is looking to win market share from both smaller players in the market and the two heavyweights, Harris CapRock and RigNet. Reflecting its recent investment in scale, SDA recently won a contract from Harris CapRock.
Bolt on acquisitions. SDA acquired four businesses in the past year and is in the hunt for more. Acquisitions are targeted which operate in segments/geographies where SDA is underrepresented to add scale in an existing vertical. Targets have historically been immediately accretive on an earnings basis and we would expect this hurdle to be maintained.
Expanding geographies. SDA recently entered the African market through its acquisition of Geolink. It is talking about opportunities in Latin America and the Middle East and may do this either organically or through acquisition.
Expanding verticals. SDA recently entered the energy space through its acquisition of Hermes. Harris CapRock and RigNet (combined 60% market share) are the two major players in this space and SDA has won two tenders in the past week in this area, one from Harris CapRock. These two operators have been dealing with internal and external issues with reports of customer dissatisfaction providing an opportunity for SDA.
Growth in value added services such as video conferencing, surveillance, VoIP, firewalls, L-band services and remote access management. Having already invested in the systems and hardware, these services can further integrate the client with SDA and encourage a longer-term relationship and contract.
Catalysts for share price movement
We believe there are 2 likely cause of a positive share price re-rating. This would be either an accretive bolt-on acquisition or an announcement of large contract wins in the energy sector.
Keep your eyes peeled for any corporate announcements and we wish you enjoyable and successful investing.