by Amy | Aug 25, 2016 | Reporting Season, Stock Insight
Darren Katz, TAMIM Asset Management’s Managing Director and Head of Investments, reviews a number of the Stock Picks we have presented over the course of the year to assess how they have fared through the recent reporting season. We review our original investment rationales and try to learn from the mistakes we have made through our investment journey.
Darren Katz, TAMIM Asset Management’s Managing Director and Head of Investments, reviews a number of the Stock Picks we have presented over the course of the year to assess how they have fared through the recent reporting season. We review our original investment rationales and try to learn from the mistakes we have made through our investment journey. Overall the year has been very good for our Australian Value and Small Cap strategies. With the Value underlying fund delivering a 13.9% return over the past 12 months and the Small Cap underlying fund delivering a 31.3% return for the same period.
Reporting Season Wrap-up – Part 1
Darren Katz – Head of Investments
We are currently well into the Australian reporting season. Having spent the last 12 months providing you with a number of our best ideas and thoughts around a select group of Australian shares, I thought it was an opportune time to stop and look back at some of these stocks. It is always a good idea when investing to stop and look at your initial hypothesis with a view to learning from the good and bad decisions you have made. This is an extremely important lesson, and acts to make us all greater investors.
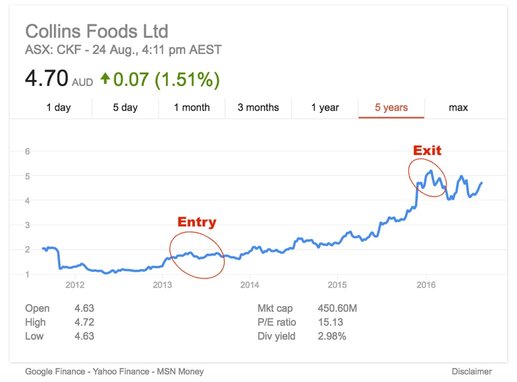
Collins Food (TAMIM Australian Equity Value):
Exited Poistion
Investment Rationale: Underfollowed, unloved
Current Price: $4.70
We exited our position in Collins Food (CKF) in early January at close to $5.00 after a highly successful investment. At the time, net operating cash flow was up 43.4% at $23.8m. The group had also reported a lower net leverage ratio of 1.62 which seemed to be on a declining trajectory. After reaching a high of $5.34 the price of CKF declined to below $4 with significant price movements both up and down over the period.
The latest set of results showed net operating cash flows at $49.7m which allowed CKF to continue to reduce overall net debt. Net debt now stands at $112.5m with the net leverage ratio down to 1.52. CKF will continue to grow stores and increase existing same store growth which should continue to help with strong cash flow generation. While we continue to like the company, the company doesn’t offer a large enough margin of safety and we continue to allocate our clients’ capital into better alternatives that we see more upside in.
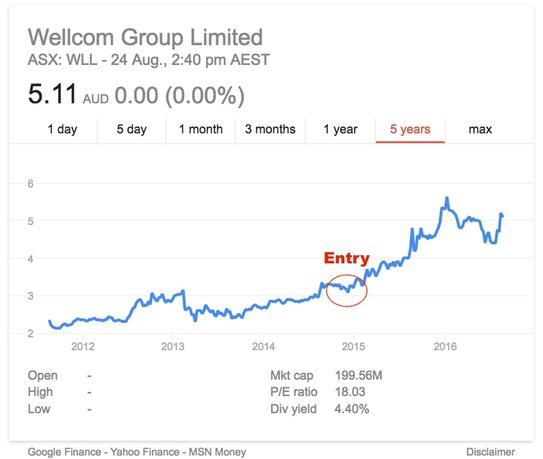
Wellcom Group (TAMIM Australian Equity Value):
Current Poistion
Investment Rationale: Family Business Alignment, Strong Cash Flow
Current Price: $5.11
As we reported in February 2016 we continue to own a position in the Wellcom Group (WLL), a small listed business that is a world leading global content production company. WLL is capable of offering around the clock services connecting industry leaders with customers. The Executive Chairman, Wayne Sidwell, has almost five decades of experience and remains as passionate about the industry as ever.
The TAMIM Australian Equity Value IMA enjoys finding and owning well-managed, risk averse (especially when it comes to debt) listed companies generating good cash flow with a strong family business alignment and pedigree. We continue to believe that whilst the international profit contribution to the WLL Group which is still small (especially in absolute terms); enormous potential exists for this company to grow in a large global profit pool from a low base.
The digital and social media revolution continues to force structural change across advertising and media industries which will favour production companies which are able to deliver large volumes of content frequently. The 2016 result for WLL highlighted net revenues up 20% to $103.4m with net profit up 14% to $11.1m. The dividend is up 10% underpinned by good cash flow to a fully franked 22.5 cents. Importantly, UK revenue increased by 51% and the US revenue base increased to 39.4%. With an increased global footprint, improved content production and with lower cost structures, WLL continues to be a holding in our Value portfolio.
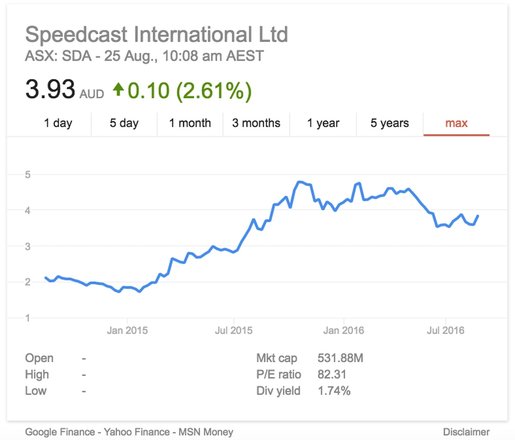
SpeedCast (TAMIM Australian Equity Growth):
Current Poistion
Investment Rationale: Strong Growth prospects, Industry Consolidation
Current Price: $3.83
SpeedCast is fast becoming a major global player in the high growth attractive satellite services and VSAT segment. In our article in March we discussed how SpeedCast had delivered 38% revenue growth and 42% EDITDA growth. Management had also flagged its acquisition strategy to consolidate the fragmented industry which it has now actively been fulfilling with its recent acquisition of WINS for €60 million in cash.
The half-year 2016 results have revenues reported at USD 101.5m which reflects growth of 41% over the previous comparable period. EDITDA was USD 17m which reflected a 34% increase. SpeedCast has delivered strong growth in the maritime (31% of revenues) and the energy (17%) sectors. The business has purchased Newcom, ST Teleport and now in August, WIN. The WIN purchase will add a strong presence in Germany as well as diversify the maritime segment into the fast growing segment of passenger carrying vessels.
SpeedCast has presented some compelling opportunities to add to the position over the last 6 months. The latest results do indicate the company is executing well in its approach to consolidate the industry as well as continuing to grow diversified components of existing business segments.
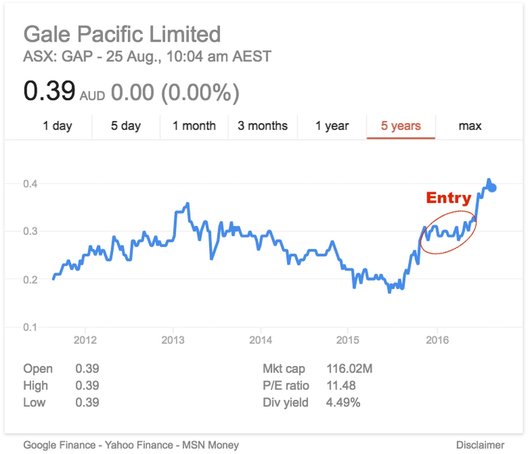
Gale Pacific (TAMIM Australian Small Cap):
Current Poistion
Investment Rationale: Underfollowed, unloved, turn-around story
Current Price: $0.39
As our Small Cap manager recently wrote in the article on Gale Pacific, GAP is a great example of a smaller company achieving global success in a chosen niche market. As the company grows its earnings and market cap we expect the market and the analysts that cover the sector to start recognising GAP and drive a multiple expansion. Over the past 12 months, GAP has returned close to 100% while the Australian share market has displayed an anaemic 2.6% return. It is still very cheap on future estimates, and looks set to yield in excess of 7% this coming year, leading us to believe there is still material upside despite the recent share price performance.
After GAP’s fall from grace from 2005 to 2010 the business has strategically refocused on its core products and improved its management of working capital. This has all occurred off the radar of most investors. Today GAP is a global leader in the production of technical shade material. The 2016 results showed revenue up 17% with NPAT up 47% at $10.2m. We continue to hold our position in Gale Pacific and remain impressed with this small Australian company making large strides in the lucrative US, Middle East and African markets.
by Amy | Aug 18, 2016 | Stock Insight
Investment Theme – US Infrastructure
Robert Swift – Head of Global Equity Strategies
by Amy | Aug 10, 2016 | Stock Insight
oyce has a strong track record of partnering with business the company acts as a business partner, providing capital and management expertise to good profitable businesses that currently lack the capital and management to reach the next level. The key in this business partnership is to ensure that the risks and rewards are appropriately shared and incentives are aligned.
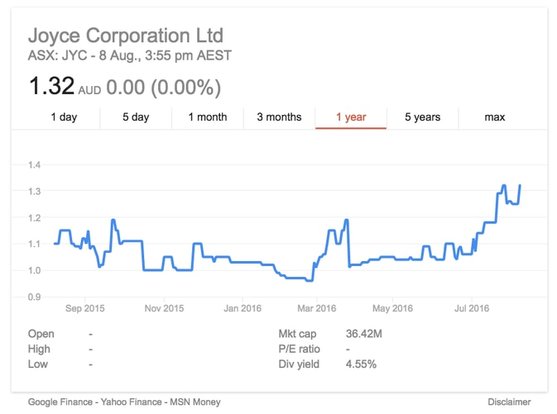
Stock Picking – Joyce Corporation Ltd (JYC.AX)
Joyce Corporation Limited has been listed on the ASX since 1986, but its origins go back over 125 years. For much of this time, Joyce was involved in foam manufacturing (Joyce was the first company to make foam in Australia) but disposed of this business in 2005. This is not however the reason for investing in the business. Joyce has a strong track record of partnering with business the company acts as a business partner, providing capital and management expertise to good profitable businesses that currently lack the capital and management to reach the next level. The key in this business partnership is to ensure that the risks and rewards are appropriately shared and incentives are aligned.
Transformation
Over the last several years, Joyce has been slowly building out a business of considerable scale, with the group’s total network revenue in the home improvement and furniture space now in excess of $125 million. The recent sale of a non-core property asset and the purchase of another property, together with the purchase of an interest in (and subsequent accounting consolidation of) a new business unit, has meant Joyce’s recent financial reporting is messy, and the Joyce story (and its potential) is perhaps poorly understood by the market. We expect the story to become clearer over the coming reporting periods – below we provide our thoughts on where the business currently sits, and it’s potential.
Balance sheet and operations
Joyce currently has $13m cash and a property with a market value likely to be in excess of $5m on its balance sheet. Joyce’s strong balance sheet, in the words of its Chairman, puts “the company in a relatively impregnable position with little downside”.
With a market capitalisation of $30m, given the value of its cash and property assets, (simplistically) the market is applying a value of approximately $12m to the Joyce operating business that could generate close to $2m (normalised) NPAT for the full year. Joyce reported $900k NPAT after non-recurring items and minority interests (& paying full tax) for the first half of 2015. While traditional value investors would be attracted to the strong cash backing and low implied earnings multiple on offer, we are equally excited by the opportunities associated with the operating model Joyce has quietly been developing over the past few years.
Essentially, Joyce acts as a business partner, providing capital and management expertise to good profitable businesses that currently lack the capital and management to reach the next level. The key in this business partnership is to ensure that the risks and rewards are appropriately shared (between Joyce and the incoming owner/manager partner), and incentives are aligned. Joyce’s two businesses are discussed in detail below.
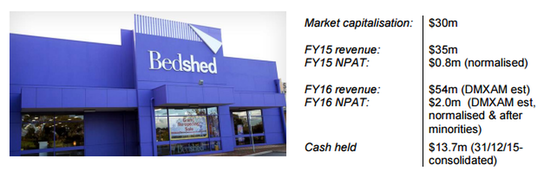
Bedshed www.bedshed.com.au
Joyce owns 100% of the Bedshed (franchise) business. The first Bedshed store was opened in Perth in 1980 (as a waterbed expert!). Today, it is one of Australia’s largest specialist mattress, bedding and bedroom furniture retailers with a network of 30 stores (the bulk of which are franchised). Bedshed has been able to consistently grow like for like sales through offering a compelling customer proposition – personalised service from highly trained bedding specialists, with the benefits (and value) of being part of a substantial buying and marketing group.
The benefits of the ‘partner’ model is evident through the success of the franchised stores which consistently record superior profit metrics to the small number of company (Joyce) owned Bedshed stores – reflecting the drive and commitment that a passionate business owner/manager can bring to a retail business. Joyce is committed to expanding the retail footprint of Bedshed through recruiting high calibre new franchisees. As well as the alignment of interests, this franchise model serves Joyce well as it means the store fitout, leasing costs and working capital investment required to roll out a new store is funded by the franchisee, not from the balance sheet of Joyce. In return, Joyce can offer franchisees support, specialised advice, training, a proven structure and 35 years of franchising experience that significantly reduces the risks relating to starting a new business, in many cases facilitating a positive change of lifestyle for a new franchisee The Bedshed operations currently contribute approximately $2m+ in annual EBIT to Joyce. As the footprint expands (together with ongoing same store growth) this has the potential to deliver Joyce solid ongoing returns with low capital requirements.
Kitchen Connection www.kitchenconnection.com.au
In 2013 Joyce acquired an interest in KWB Group Pty Limited, Australia’s largest specialist retailer and installer of kitchens, laundries and wardrobes, and currently owns 51% of the company, having made an investment of approximately $1m. KWB targets the lucrative renovation market, providing a unique (for a national provider) “do-it-for-me” (rather than DIY) one stop, premium, full service consultation-to-design-to-installation kitchen, laundry and wardrobe offering, with competitive pricing.
When Joyce acquired its interest in 2013, annual sales were approximately $22m. For the six months to 31 December 2015 sales were at $19m (+28% on the corresponding period) with EBIT of $2.3m (+90%). Joyce reported KWB’s normalised earnings grew in FY15 over 300% on the corresponding period, driven by the strategic investment in the retail kitchen showrooms, the additional depth in back end customer service management and the expansion of the core product range. Joyce noted they expect that further significant improvements can be obtained. The founding KWB management team remain as 49% shareholders and continue to lead KWB. Together with Joyce they are focused on driving further growth, and sharing in the rewards of the growth as meaningful shareholders in the business. On the numbers reported, Joyce is certainly succeeding in its initial aim to grow the KWB business to reach its potential. The business would appear to have good momentum, with significant opportunity to expand both its products, and geographically into other regions/states. KWB could potentially achieve EBIT of up to $5m for the full year – applying a 5x multiple generates an enterprise value close to $25m (versus the $1m JYC investment for 51%).
Future partnerships
Following the settlement of the non-core industrial property in late 2015, Joyce now has the balance sheet strength to deploy capital into new opportunities. Such an opportunity may be a high performing business centered in a particular region, which has the potential for expansion into other regions, but the current owners/managers lack the capital and know-how to go about this. Joyce can bring its capital, its contacts, its experience, its back office systems and its leadership to do just that. It is not difficult to see Joyce in the not too distant future with say four or five solid, profitable, scalable and growing national businesses that they have partnered with, and with a national network of sales far in excess of the current $125m. In the meantime, for the current $30m market cap, one gets:
- a substantial cash balance
- a substantial unencumbered property asset with significant development potential
- around $2m of after tax, after minorities, earnings for FY16
- 9%+ fully franked dividend
- potential upside from earnings growth of 2 national businesses – one of which is very fast growing
- potential upside from new acquisitions
- an experienced management team, with a proven ability to execute.
The TAMIM Australian Equity Small Cap Portfolio is an investor in Joyce. This is a strong example of the types of investment we look for in our portfolio. Strong cash balances, earnings, real assets and strong growth potential – not to mention a dividend yield that would make the bank envious. If you would like more information on this portfolio and the services we offer to clients please contact us for a conversation with one of our Directors.
Happy Investing,
The team at TAMIM
by Amy | Aug 3, 2016 | Stock Insight
Stock Picking – JP Morgan
Robert Swift – Head of Global Equity Strategies
by Amy | Aug 3, 2016 | Stock Insight
The Australian smaller companies universe is home to a number of companies which are building global leadership positions in their respective niche markets, and yet somewhat surprisingly remain largely unrecognised in the local investment community. Identifying these types of businesses is both the passion of and the bread and butter of the manager of the TAMIM Australian Equity Small Cap IMA.
The Australian smaller companies universe is home to a number of companies which are building global leadership positions in their respective niche markets, and yet somewhat surprisingly remain largely unrecognised in the local investment community. Identifying these types of businesses is both the passion and the bread and butter of the manager of the TAMIM Australian Equity Small Cap IMA. We will be revealing 6 companies which are achieving great success on a global scale and yet trade on very low valuations in the coming months. Watch this space and read on as the first emerging global leader is revealed in this weeks Stock Picking report.
Stock Picking – Gale Pacific Ltd (ASX:GAP)
The first emerging global leader to be discussed is Gale Pacific Limited (ASX:GAP), a leading global marketer and manufacturer of screening and shading products for domestic, commercial and industrial applications. Way back in the 1970s, GAP invented knitted shade-cloth, and today from their low cost manufacturing facilities in China, the company is one of the world’s largest producers of technical fabrics. The company’s products are extremely durable, do not react to dirt and moisture, and do not rot (like canvas). It seems fitting to us that an Australian company should aim for global leadership in the sun shading and screening market given our position as one of the sunniest countries in the world.
WHY IS GALE PACIFIC TRADING UNDER THE RADAR?
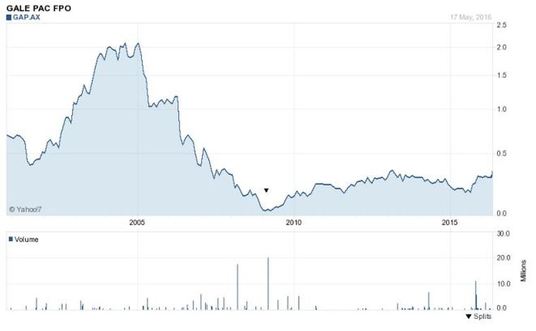
After a period of aggressive, and ultimately unsuccessful, acquisitions during the early 2000’s, GAP has in recent years refocused strategically on its core products and has made significant improvements in its working capital management. The company has been through a period of dramatic restructuring and in our opinion has emerged much stronger and well positioned to grow. The company’s listed journey has involved a dramatic period of under-performance between 2005 and 2009, followed by gradual recovery since then.
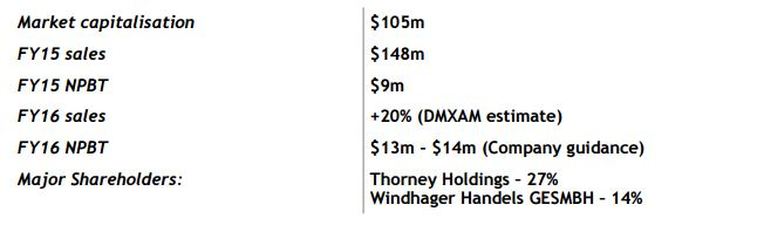
This is an interesting backdrop in our opinion. We often find that smaller companies with patchy track records drop off most investors’ radars, even when they are undergoing meaningful restructuring. Investors’ literally forget about them. The market then fails to follow the restructuring and rerate these businesses as restructured businesses which warrant higher valuations. This is smaller company market inefficiency in action. As a result GAP, which is an emerging global leader with excellent growth prospects, is valued at a market cap of under $100m (which implies a very low valuation on all metrics), with a very limited market following. If the broader market were more aware of GAP’s restructuring and post restructuring success, the stock would be trading at a far higher valuation in our opinion. Therein lies the compelling opportunity high quality, under-researched smaller companies present.
LOOKING FORWARD: STRONG FY16 EXPECTED AND ONGOING GROWTH
GAP should deliver revenue growth in excess of 20% for FY16. For the 6 months to 31 December 2015 total sales increased 22%, with sales in Australasia up 18% on the back of new product range wins and improved marketing campaigns. Sales in the Americas region grew 14% in local currency reflecting a broader product range offering and growing market share in both the retail and commercial sectors. Margins have improved through a focus on supply chain improvements (reducing the number of suppliers and improving supplier terms) and inventory management. Management believe there is good potential for ongoing growth in its core global markets in the Americas, Middle East / North Africa and Eurasia, particularly for GAP’s commercial fabrics as the dangers of sun exposure in regions with harsh environments become more widely appreciated. Climate change is likely to provide a tailwind for GAP’s end markets over the very long term as managing sun exposure will become a greater challenge at a global level. GAP’s commercial fabrics are also marketed for a variety of other professional uses, including architecture, horticulture, building and construction, agriculture, transport, water conservation and mining. The company has a multitude of long term growth drivers across its geographies and products.
BUNNINGS AS A MAJOR CUSTOMER: RISK AND OPPORTUNITY
In FY15, Bunnings contributed 35% of GAP’s total $148m in sales (60% of total Australian sales), thus there is an unusually high degree of customer concentration risk. However, from all accounts this relationship appears strong, with GAP taking pride in their ability to work collaboratively with all their customers, including Bunnings. These collaborative relationships provide GAP with consumer insights, new product development initiatives and improved forecasting/inventory management. In addition, Bunnings’ recent expansion into the UK through the acquisition of homewares retailer Homebase, may present an opportunity for GAP to sell product to Homebase which is not currently a GAP customer. We will be watching UK developments closely as this could present a significant opportunity.
COMPELLING VALUATION
At the time of our recent purchase GAP was trading at a discount to its book value. Based on its FY16 guidance of NPBT of over $13m, it is currently trading at around 10x expected ’15/’16 eps of 3.5c, and at 5x ’15/’16 EV/EBITDA). With a 75% payout ratio, this implies a dividend yield in excess of 7%. We view this as significantly under-valued for a business with excellent management and solid growth prospects.
OUR VIEW
GAP is a great example of a smaller company achieving global success in its chosen niche market. We believe management are doing an excellent job of managing the business and we applaud their ambitious international expansion plans. Interestingly, there are currently no brokers covering the stock, but we expect this to change as GAP grows its market capitalisation and earnings, and the company’s market following subsequently increases. If GAP can maintain its current momentum, we expect a share price re-rating driven by both multiple expansion and continued earnings growth. The upside potential is significant, and we are happy long term shareholders.
Happy Investing,
The team at TAMIM