“Ladies and gentlemen, the captain has now turned on the seatbelt sign. Please return to your seats and fasten your seatbelts.” When we’re passengers, turbulence often catches us by surprise; it may even evoke fear and anxiety. The pilots are usually more sanguine. They understand that more often than not, turbulence isn’t dangerous and only rarely requires a significant divergence or emergency landing. Instead, they stay focused on the task at hand, adjusting the flight path to make the plane more comfortable while relying on their well-tested systems and procedures to mitigate discomfort and risk.
Often, market volatility can evoke the same emotions of fear and concern in investors. But typically, the best course is to stay focused, not fearful. As would an experienced pilot, we rely on our rigorous and time-tested processes to manage known risks and prepare for those that may be approaching on the horizon—all while maintaining our long-term course.
During these periods of volatility it is important to remind ourselves of our long term views. In this instance our long terms views remain unchanged:
- Global deflationary pressures remain.
- The world is still in a period of lower economic growth.
- Supportive central bank monetary policies will continue for an extended period.
- Government debt levels are still excessive and will need to be worked out over the next decade.
- Global demographic shifts continue and we believe the biggest risk to market volatility remains at a geo-political level.
- A growing global middle class, can continue to provide economic tailwinds.
As it relates to the near term, many of our “fasten seatbelt” indicators have been flashing. Key market indicators to be monitoring include:
- volatility,
- credit spreads,
- commodity prices,
- inflation expectations
We believe we are well-equipped to navigate this turbulence and see considerable opportunities for investors who can stay calm and buckled in during this period of elevated choppiness.
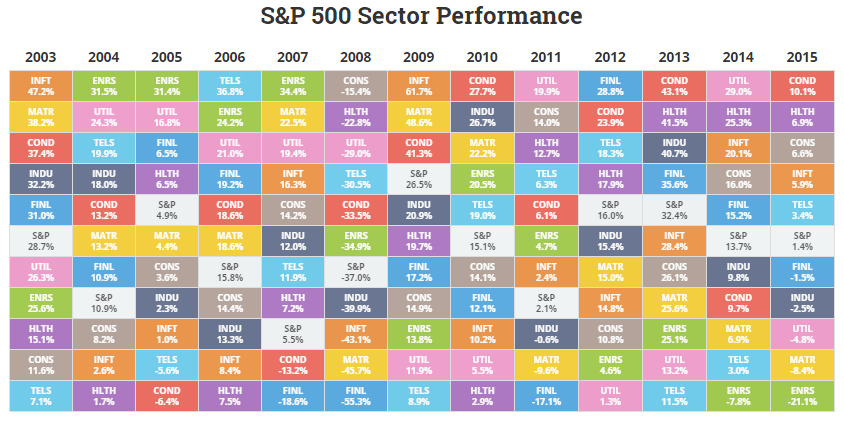
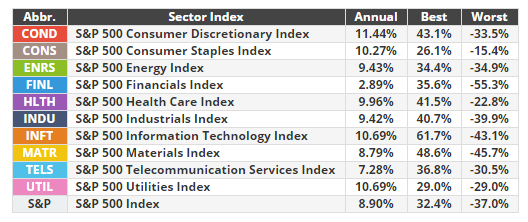
The below table details the sector returns for the S&P 500 over the last 12 years since 2003. The key take out for us in managing the risk of portfolios while continuing to try and deliver returns is the following. Markets will deliver you a set of returns however within the market there will always be brilliant opportunities to make or lose money. Take 2015 as an example. While the S&P 500 was up 1.4% in US dollar terms, through the year there was significant divergence in the sectors making up the market. Consumer discretionary stocks were up 10.1% while Energy stocks were down 21.1%, if your portfolio consisted of largely consumer discretionary stock versus a portfolio of oil companies your 2015 experience would have been remarkably different.
While we’d like to say that the “fasten seatbelt” sign will be turned off momentarily, we believe investors should be prepared to stay buckled in their seats for a while longer. In the meantime, we believe it is of paramount importance to be invested with professional money managers that select stocks and not markets. Managers who have the discretion not to be fully invested and the ability to select stocks independently of markets should outperform in this volatile environment.
Your choice of pilot to guide you through the turbulence is extremely important. You can choose a pilot who is telling you not to fly because of the turbulence or you can choose a pilot who understands his plane, understands the flying environment and a pilot who is confident in his systems and processes.