Guy Carson
In the early days of May, ANZ, Westpac and NAB will all report their first half results. Short-termism will grip the market and the focus will be on whether earnings from the October to March period are above or below expectations. This will undoubtedly swing share prices a few percent in the appropriate direction and as a result lead to under or out performance for fund managers relative to the Australian index. Now if I was a betting man, I would probably say the odds are in favour of a “beat”. This is based on the evidence from CBA’s recent result that showed an easing of credit conditions in the corporate sector combined with the APRA data showing the banks continue to grow their investor mortgage book (at least until last month). However, when investing it is the not the last six months that will determine your success or failure. It is important to take a longer term view of the companies and the economic drivers that will drive the performance over coming years.
In order to understand this, we have a look at two areas:
- A bottom up analysis of how the banks have performed over the last 25 years.
- A top down analysis of what the drivers have been that have led to that performance and how likely they are to continue.
Bottom up analysis – How the banks have performed
By any measure an investment in CBA has been incredibly successful. To understand why it has been it’s worth stepping back and looking at how a bank makes money. This can be broadly defined as follows:
- Raise capital to support business.
- Borrow funds (liabilities) typically at a ratio of up to 20 times capital.
- Lend borrowed funds to borrowers (assets).
- The interest earned less interest paid creates the interest margin (net interest).
- Charge fees (non-interest income).
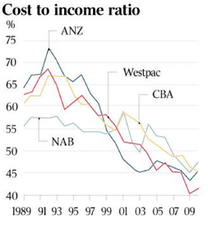
- Non-interest costs divided by net interest plus non-interest income is the cost to income ratio.
- Provisions for potential and possible problem loans are charged against the profit.
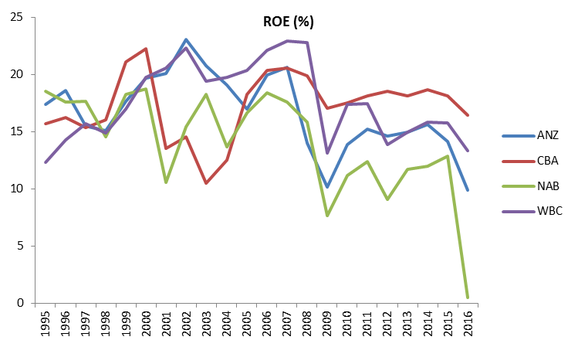
- Profit after provisions divided by capital gives return on equity.
Any objective analysis of the above for the Big Four banks over recent history suggests they have done a good job. Starting with point number 3 above, all of the Big Four have used their balance sheet to good effect and grown their loan book significantly. The below chart looks at total loans (chart is in billions).
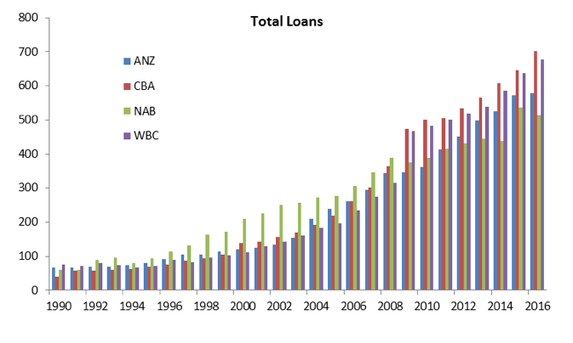
The four banks as a whole have grown their loan books from $242bn in 1990 to almost $2.5tn today. That is a 10 fold increase with CBA leading the way going from last to first.
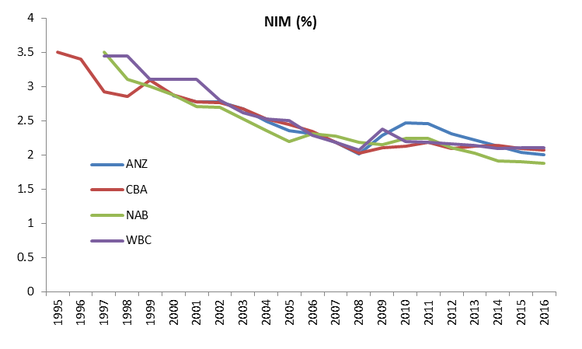
So they have had no problems growing their book. Moving onto point 4 and the Net Interest Margin (NIM) which has gone the other way.
Top Down analysis – What has driven this performance and will it continue?
From the above analysis, one might come to the conclusion that Australian has a strong banking system that has been well run in recent history. However it is important to realise that banks are highly leveraged cyclical companies, when the economic tailwinds are behind them it is easy to look good. When things turn, the real test will begin. This is a point that many Australian fund managers seem to have forgotten in recent times due to the long term success of the domestic banks.
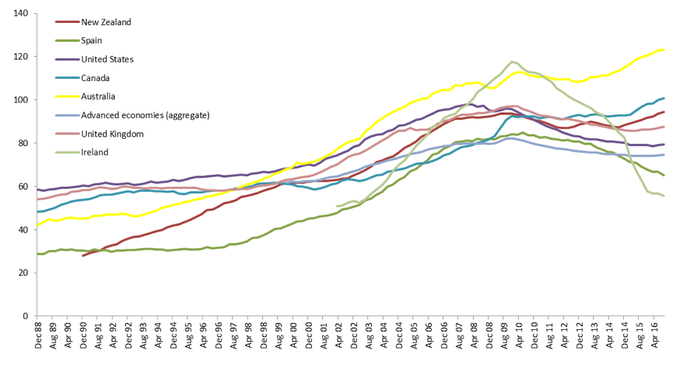
In order to understand why the banks have been so successful in recent times it’s important to examine the economic drivers behind the performance. This begins with a trip back to the 1980’s which saw a significant amount of deregulation for banks and the beginning of the Basel capital requirements. This decade saw the beginning of a debt supercycle globally which imploded in many developed countries in 2007. Prior to 1980, the global standard for banks was a leverage ratio of 7x, this has changed dramatically since. Just prior to the Global Financial Crisis, leverage in the European Banking system stood at 40x, in the US it stood around 30x and in Australia it stood at over 20x. Australia joined the rest of the world in “gearing up”.
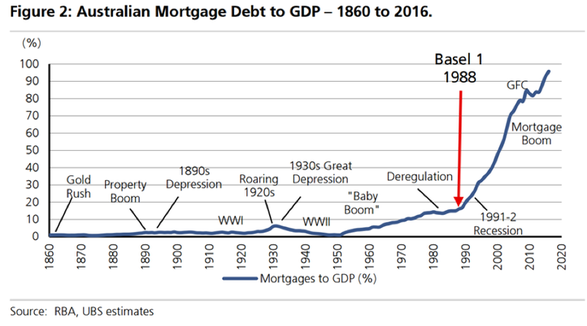
The original Basel accord in 1988 looked at minimum capital levels and the risk weightings of different types of loans. For residential mortgages, risk weights were set at 50%, hence banks had to carry half as much equity against them and could in effect leverage their balance sheet twice as much. This helped kickstart a boom in Australia.
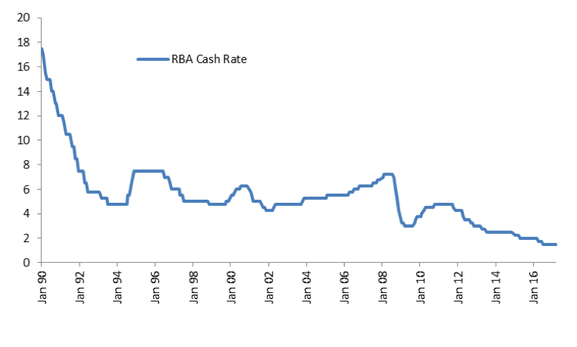
Adding to this was a falling interest rate environment. Interest rates over the last 27 years have gone from 17.5% to 1.5%. Amazingly over that period, Australia has barely been through a tightening cycle.
Basel 2 in 2007 has added a further tailwind with the banks effectively allowed to set their risk weights through their internal risk models. The banks moved to a 17% risk weighting for residential mortgages. Given an 8% minimum tier one capital ratio from APRA, this allowed banks to leverage their equity 83x. A 17% risk weight means they only have to hold 17% of the 8% minimum capital requirement. In other words for $1 of equity, a bank could lend out a staggering $83 in residential mortgages.
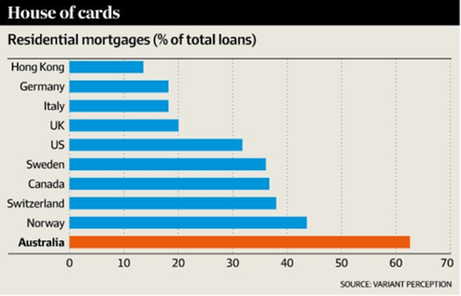
The impact of lower interest rates and favourable risk weightings has meant that our banks have in effect become rather large building societies. Australian banks have a disproportionate amount in residential mortgages when compared with international peers.

The problem for banks now is that the two key drivers that lead to this growth in the mortgage book and household debt are either exhausted or reversing.
- Interest rates are sufficiently close to zero that further scope for lending growth from rate cuts is limited. It also suggests that the capacity of households to take on more debt is limited. Hence for the banks it will be a struggle to grow their loan books.
- After a long period of supportive regulatory changes, the tailwinds have reversed. APRA moved back in 2015 to shift the risk weighting associated with residential mortgages from 17% to 25%. This means that the banks have to hold more equity against their current loan books (they can now only leverage their equity a meagre 50x as opposed to 83x). The impact of this was that slight drop in ROE seen above. APRA now has indicated there are further changes to risk weightings coming and these set to be announced “around the middle of the year”.
Conclusions:
Investing is all about probabilities. The value of a share is the sum of its future cashflows. The future however is unknown. Therefore, when establishing what a company is worth or how much certain shares will return we need to look at a range of circumstances to understand the potential upside and downside scenarios.
For the banks, we know that loan growth going forward will be constrained. The best scenario is a likely flat lining of the household debt to GDP ratio over the coming years. In that instance, earnings will grow at roughly the level of nominal GDP which has averaged 3.3% over the last 5 years. Add to that a dividend yield of around 5% and some franking and you get a return of around 10%, a perfectly reasonable outcome for a low interest rate environment. The problem is this is the best expected outcome (outside of a surge in GDP growth that seems unlikely), and it doesn’t even include the likelihood of higher capital requirements from APRA.
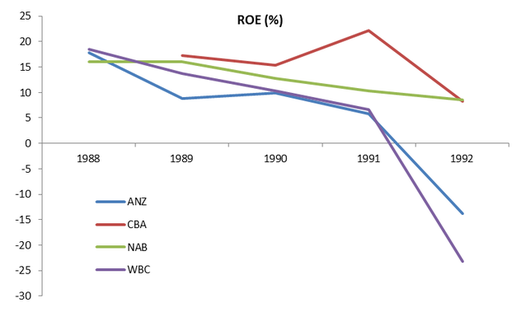
What about the other side of the equation? Well, high household debt doesn’t cause a problem on its own but it does make our economy and our banks vulnerable to a shock. The last time we had a shock two of the Big Four recorded significant losses. In fact, Westpac managed to destroy 23% of their equity in one year. A loss that large will lead to a significant rerating in the Price to Book multiple meaning the loss for shareholders would be considerably more than the 23%.
So what could lead to a potential shock? There are three potential catalysts:
- Higher Interest Rates. There is a very low probability of interest rate rises anytime soon and in our opinion there is a very low probability of any meaningful tightening cycle in Australia over the next decade. The RBA is effectively hamstrung by the high level of household debt, a problem which they have largely brought on themselves. Although we have to note, a consequence of the stricter capital limits and the rising rates of the US Federal Reserve has led to “out of cycle” rate hikes from Australian banks.
- Higher unemployment. Recent job numbers have shown a deterioration in the employment picture most notably in Queensland and Western Australia (something we wrote about in our 2017 Outlook). We do expect this to cause some problems for the banks over the coming 12-18 months.
- Low wage growth. Low wage growth makes it more difficult to service debt and currently wage growth in this country is at a record low.
Ultimately, when we assess the outlook for banks we arrive at a conclusion that asymmetric risks exist with limited upside but significant downside. When we look for companies to invest in we want the opposite, limited downside with large potential upside. As a result we continue to avoid the banks, believing that the 25 year bull market has come to an end. The only question that remains for us is whether this bull market ends with a bang or a whimper.