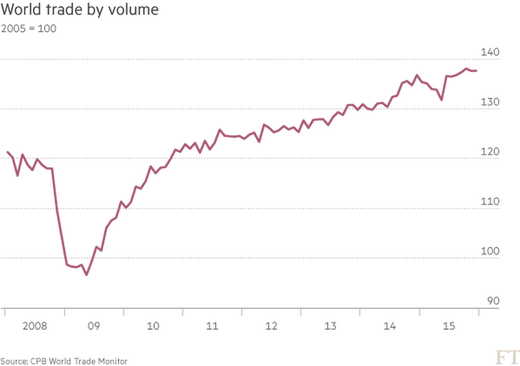
Why not start with some charts.
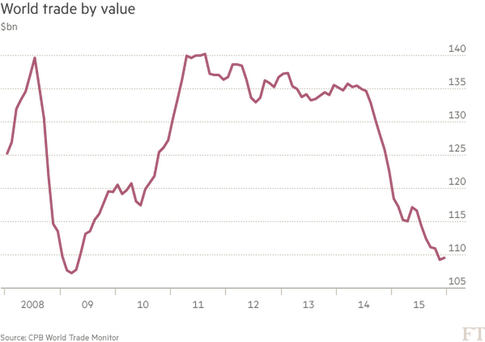
What about this one?
Worked it out yet?
That’s right, commodity prices, particularly oil prices, have plummeted which has led to a sharp decline in the value of world trade, whilst volumes have remained relatively flat. There is also some strong US$ impact. As I have said many times, ‘statistics if tortured sufficiently will confess to anything.’
And no one, and I mean no one, can ‘spin’ a story, mangle and manipulate statistics like we can in the investment industry.
We are not ‘masters of the universe’, we are the ‘masters of spin.’
- I give you 1990, and Japan is different.
- I give you the Tech Bubble 2000, and P/E multiples don’t matter.
- I give you 2007/2008, and debt doesn’t matter anymore.
- I give you 2016, and Australian house prices are not overvalued.
But there is one person who does not mince his words. There is one man who is caustically abrasive and brutal in his sugar free, spin free servings of the spoken word. Here are some of his words.
- “Space for monetary policy seems to be exhausted.”
- “Expansive fiscal policy could cause further crisis.”
And just in case his illustrious audience in Shanghai hadn’t got the point, he went on to say.
“Fiscal, monetary policies have reached their limits.”
In essence this straight talking man had just told the finance ministers and central bankers of the 20 largest economies in the world to go home, because there was nothing more that they could do. So as we await the much anticipated G20 communique we have this little snippet from the WSJ. (with emphasis on little as the font size is without doubt little!)
“Downside risks and vulnerabilities have risen, including growing concerns about further slowdown in global economic activity,” a G-20 draft reviewed by The Wall Street Journal said. “To enhance our readiness to respond to emerging risks, we will explore policy options that the G-20 countries may undertake to support economic growth and safeguard financial stability.”
You see it wasn’t meant to be this way. The G20 meeting in Shanghai was meant to be an opportunity for China to showcase the magnificent transformation and liberalisation of its extraordinary economy. It was to be an opportunity to marvel at the wondrous and elevated state of the Shanghai Composite. It was to be a moment of back slapping self-congratulation of a job well done. A moment when Kuroda and Draghi could claim they had saved the world through the magical wand of ‘shock and awe’ monetary policies. But, in February 2016, a certain Wolfgang Schaeuble crashed the party and delivered the words all those assembled in Shanghai didn’t want to hear.
Of course everyone already knew this and on the way to Shanghai the world’s celebrity central bankers and finance ministers would have seen The Economist whose front cover read, ‘Out of ammo?”. Or they would have read the latest edition of Foreign Affairs with the ever irrepressible Larry Summer’s article, ‘ The Age of Secular Stagnation.’ A small footnote, Larry Summers is the son of two economists and the nephew of two Nobel laureates in economics. And you thought I was boring with two degrees in economics. I only took the second one to find out what the first one was about!
Now one thing I did learn a lot about, and actually found rather intriguing, was the notion of a ‘liquidity trap.’ I was then fortunate enough to experience one in real life.
Japan.
I was never the same ever again.
I saw the debt build up.
I saw the denial…this was the biggest lesson of all.
I saw the collapse.
I learnt a lesson.
Then I saw it all over again in 2008. (Yes, there was the Tech bubble, but that was valuation not debt)
Am I seeing it again in 2016?
First up lets agree amongst friends that there is too much debt. Exhibit A China, exhibit B emerging market corporate debt. And we’re also seeing lots of denial…Exhibit C is the Sydney house price debate. But this time, unlike in 1990 or 2007, we have doom and gloom on the front page of every quality and influential publication. This tells me that the markets have done a pretty good job discounting the message I have been telling you since September.
That message is a simple one. We are witnessing the deflation of a global credit bubble…and this time it is coming from the east, not the west. It could get messy, or it might just involve some gentle hissing without a bang! And that is all I am thinking about at the moment. This means I’m looking at falling HK real estate prices, declining South Korean and Taiwanese exports, Brazil, South Africa, Russia, Japanese and European bank stocks falling et al…it’s a long list.
Moving on from my prognostications, let’s look at the markets.
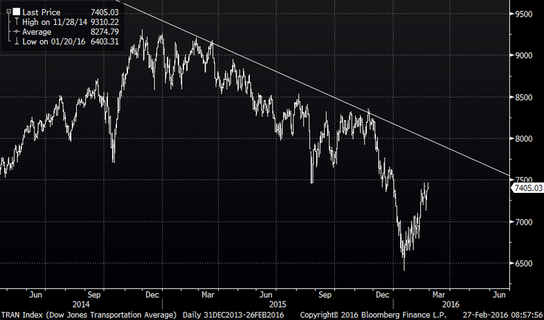
It’s been a pretty good week, except for Australia. In my previous weekly commentary I suggested markets could rally…well they did, except for Australia. So is it all over and we’re back to the races…not so fast. Instructive in this regard is the US Dow Jones Transportation Index, which I have shared with you before. Remember it was this index which gave us some early warning signals as to what was to come. You can see that we could still rally quite a bit more and still be in a bearish downward channel.
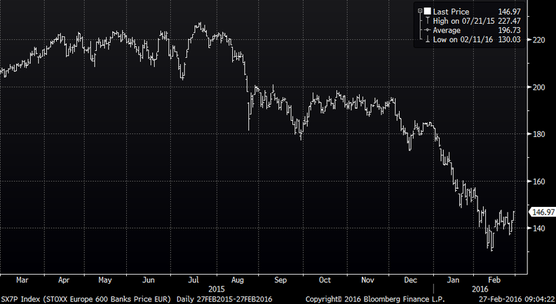
Then there is this one, which I know means so much to so many of you…Australian banks.
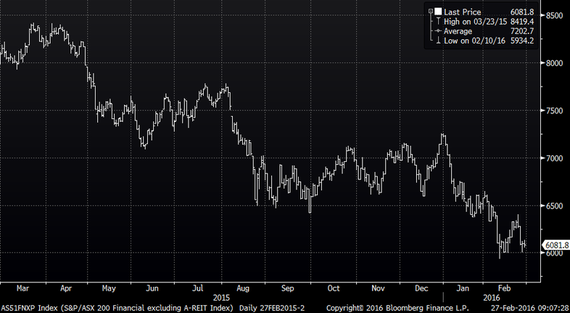
So let’s take a step back and look at a longer term chart.
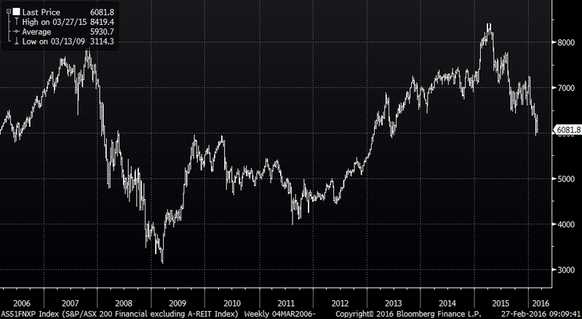
If you tell me what you think, I’ll tell you what I think.
Actually that’s not fair as you already know what I think.
And on that note have a good weekend.All the best,
