Fast forward to 2017 and not a lot has changed, least of all our valuation of Telstra shares which currently stands at between $2.70 and $4.35 per share. Taking into account the stock’s high dividend yield over the intervening period the shares have delivered a total return on our initial valuation in line with our standardised equity discount rate of 12 percent.
Nonetheless, the poor performance of the stock in more recent years has prompted questions from many of our clients and stakeholders so we thought it might be worthwhile outlining our current thinking.
Case study: US railroad industry
Nevertheless, since 1957 railroad stocks have outperformed not only the airlines and trucking industries but also the S&P 500 index itself. This occurred simply because the “top down” issues facing the industry were well and truly factored into investor expectations and only small improvement was necessary for these companies to beat such a dim outlook.
And better times were coming. In 1980 there was a major deregulation of the railroads that spurred consolidation and greatly increased their efficiency. Despite falling revenues, rail productivity has tripled since 1980, generating healthy profits for the carriers.
The lesson: An industry in decline can offer good returns if investor expectations are sufficiently low. If such a firm can halt its decline – and pay dividends – its shares can deliver excellent returns.
The question with Telstra is whether expectations are sufficiently low.
Gauging market expectations
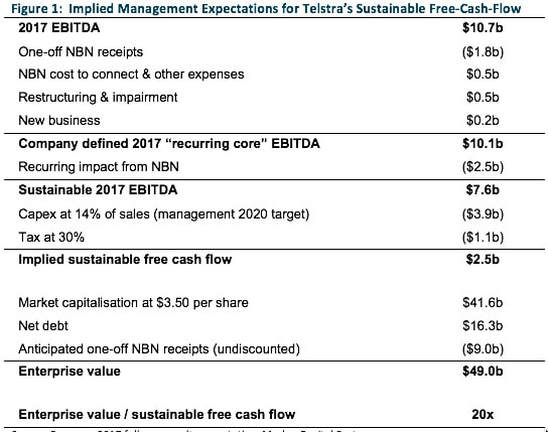
To give a guide to management’s expectation of Telstra’s “sustainable free-cash-flow”, Telstra’s most recent result presentation noted:
- Telstra generated “recurring core” EBITDA in the 2017 financial year of $10,068m;
- The recurring impact on 2017 EBITDA from the NBN is likely to be around $2.5 billion;
- The company is targeting a capital expenditure (capex) to sales ratio of around 14% from 2020.
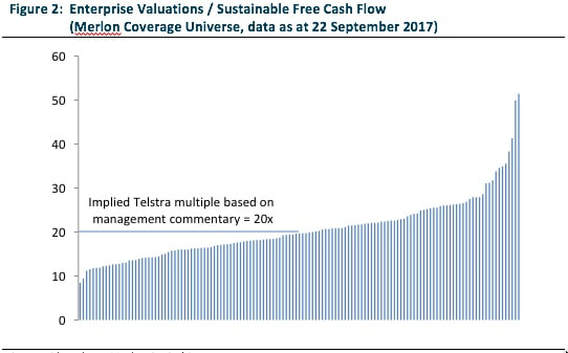
Putting these pieces together one might conclude that the Telstra’s board and management expect the company’s enterprise-free-cash-flow to settle at around $2.5 billion.
Ignore the cash flow statement at your peril
The bottom line is that management teams can define profitability however they choose but can’t as easily hide from the realities of the cash flow statement. Eventually these realities come home to roost and when this happens stocks with low earnings quality tend to underperform.
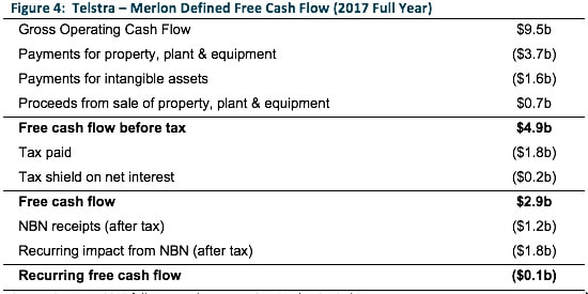
Along these lines it is important to note that Telstra’s earnings quality is poor. The company’s gross operating cash flow (“GOCF”) of $9.5 billion (which can be found on page 74 of the company’s annual report) bears little resemblance to the EBITDA figure of $10.7 billion quoted in Figure 1.
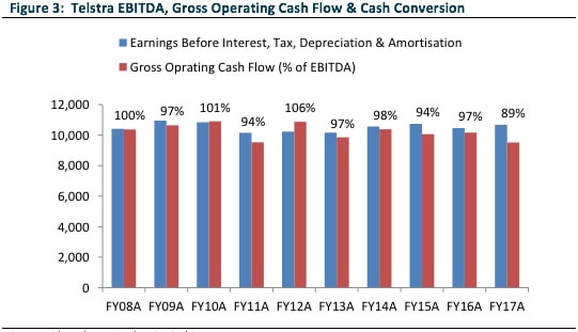
Focusing on the cash flow statement reveals a vastly different picture of Telstra’s continuing businesses. Had it not been for non-recurring NBN receipts and the network cost holiday being enjoyed ahead of NBN rollout, Telstra would have been in cash flow deficit during the 2017 financial year.
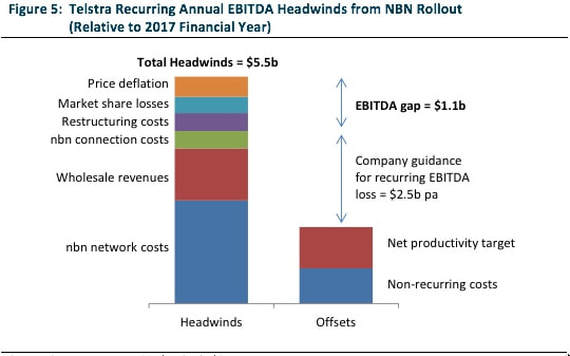
The NBN earnings gap
- Incremental NBN costs of approximately $2.5 billion per annum: The NBN’s corporate plan has the company achieving revenue of $5 billion in the 2020 financial year. We think it is reasonable to assume Telstra will account for 60 percent of this amount, or $3 billion. About $500m of this amount is already reflected in Telstra’s 2017 accounts so the incremental cost from here is likely to be about $2.5b.
- Loss of wholesale revenues amounting to approximately $1.3 billion per annum: Telstra currently generates revenues from wholesaling its products and renting out its network to other retailers such as TPG/iiNet, Vocus, and Optus. These revenues will not continue following the rollout of the NBN.
- Potential recurrence of NBN connection costs of around $0.4 billion per annum: Telstra has incurred significant costs in connecting customers to the NBN. While the company has excluded these costs from recurring earnings it is possible that a component these costs will prove to be ongoing due to normal customer churn.
- Potential recurrence of restructuring costs of around $0.4 billion per annum: Given the scale of cost reductions required to deal with the above items and the company’s history of incurring restructuring costs, it is likely that at least some component of restructuring will prove to be ongoing.
- Potential market share loss due to structural separation of network: Prior to the rollout of the NBN, Telstra enjoyed a monopoly position with regard to its ownership of the fixed line network. It is likely that the progressive levelling of the playing field as the NBN rolls out will see heightened competition and some market share loss for Telstra.
- Potential repricing of fixed line services: Telstra currently enjoys average monthly revenues per user of around $95 compared to more competitive offers in the market ranging from $55 to $75. It is likely that Telstra will see progressive price deflation with regard to its products.
Offsetting these factors Telstra has targeted annualised productivity gains of $1 billion by 2020 and is adamant that restructuring and cost to connect costs will not persist. Our analysis suggests that these aspects may not be enough to offset headwinds with an additional $1.1 billion of cost savings or additional revenues required to achieve the company’s ambition of limiting the recurring impact of the NBN to $2.5 billion.
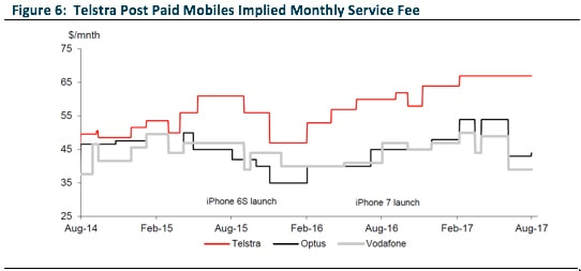
Mobile pricing
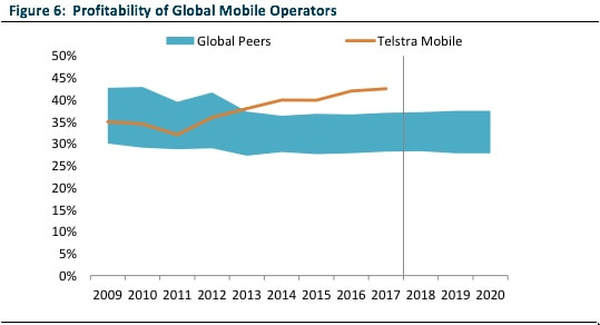
As we have discussed in previous commentaries, our investment process explicitly deals with industry structure and competitive advantage through our qualitative scorecard. We do not screen companies in or out of the portfolio based on these scores but believe deeply that returns on capital are ultimately determined by the qualitative characteristics of the industry and each player’s competitive positioning. High returns on capital support high cash conversion and hence have a direct impact on our assessments of sustainable free-cash-flow and valuations.
It follows that we have built some price deflation into our assessment of sustainable free-cash-flow for Telstra’s mobile division, although we accept that it is difficult to be too scientific about the quantum but directionally we feel that Telstra’s mobile returns will deteriorate over the next three to five years.
Capital intensity
Our analysis of global network operators and telco resellers has consistently led us to conclude that Telstra’s capital expenditure should be significantly lower as a reseller of fixed line services rather than vertically integrated network operator and that Telstra spends an unusually high amount on capital expenditure.
It follows that we were shocked by the company’s announcement that it would be spending $15 billion in capex over the three years to June 2019. The company’s capex agenda is strikingly high when we consider that 27% of the company’s recurring revenue will come from fixed line services utilising third party infrastructure (i.e. the NBN).
Telstra have indicated to the market that it expects capex to reduce to approximately 14% of sales in 2020. Since the NBN was announced Telstra has had little incentive to invest in its fixed line network. It is also the case that Telstra’s Network Application Services (“NAS”) and Media divisions are much less capital intensive (and lower margin) than the rest of its businesses. As such, it is probably more appropriate to compare Telstra’s capex to its non-fixed line, non-NAS and non-Media businesses over this period.
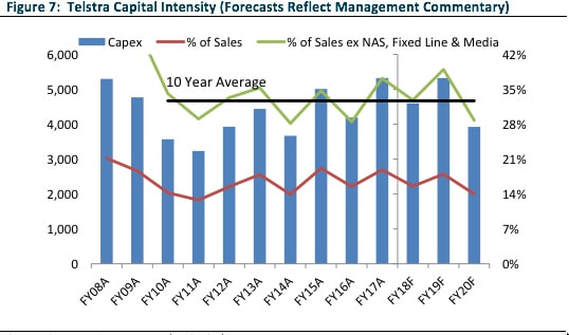
What is clear to us is that Telstra is and will remain a highly capital intensive business with its core mobile and corporate/wholesale businesses historically absorbing between 30 and 40% of revenues in capital expenditure.