
Australian Equities
Australia Small Cap Income
Investor updates
Below you will find this month’s commentary and portfolio update for TAMIM Australia Small Cap unit class.

August 2026 | Investor Update
Dear Investor,
We provide this monthly report to you following conclusion of the month of August 2026.
The TAMIM Small Cap Income Fund was up + 5.31%% (net of fees) during the month, versus the ASX Small Ords Index up +5.18%.
The August reporting period was one of our better ones over the last couple of years. Most holdings reported well with only a minor few dissapointing. We have also uncovered some exciting new positions for the fund which we disclose in this report and in future updates. We have also added to some existing positions as the fundamentals have improved materially.
During the month our holding in FleetPartners (ASX: FPR) has been in a four-way auction since 3 August, when PEP-backed SG Fleet opened at $3.60 a share takeover. Element Fleet and ORIX followed at $3.80; Element offered $4.00 for exclusivity, which the board refused. SG Fleet lifted to $4.00 and a Sumitomo–SMAS consortium entered at $3.85. Since then Element withdrew their offer. The remaining three then raised again: SG Fleet to $4.55 and ORIX and Sumitomo each to $4.65, valuing FPR at up to $982 million. The prize is FPR’s ANZ fleet book and fast-growing novated-leasing franchise.
We initiated a position in FPR in the last few months at $2.60 average. FPR symbolizes a typical ASX small cap in the current market – highly profitable and growing business that is unloved and neglected by the market and perceived as boring. The recent takeover battle highlights the disconnect between what listed companies are actually worth versus what the market is currently valuing them.
These opportunities we are finding and adding to our portfolios are generational buying of great businesses at very low valuations. We cannot precisely estimate when each company will re rate, but we are very confident that if the current valuations don’t improve – similar takeover battles like with FPR will be a common occurrence.
On a broader market view we see the current bull market as still being in its early stages as the strong tailwinds of the AI buildout only accelerating. We believe the market and valuations are not expensive. Tech Stocks are trading at valuations less than half those seen during the Dot Com Bubble.
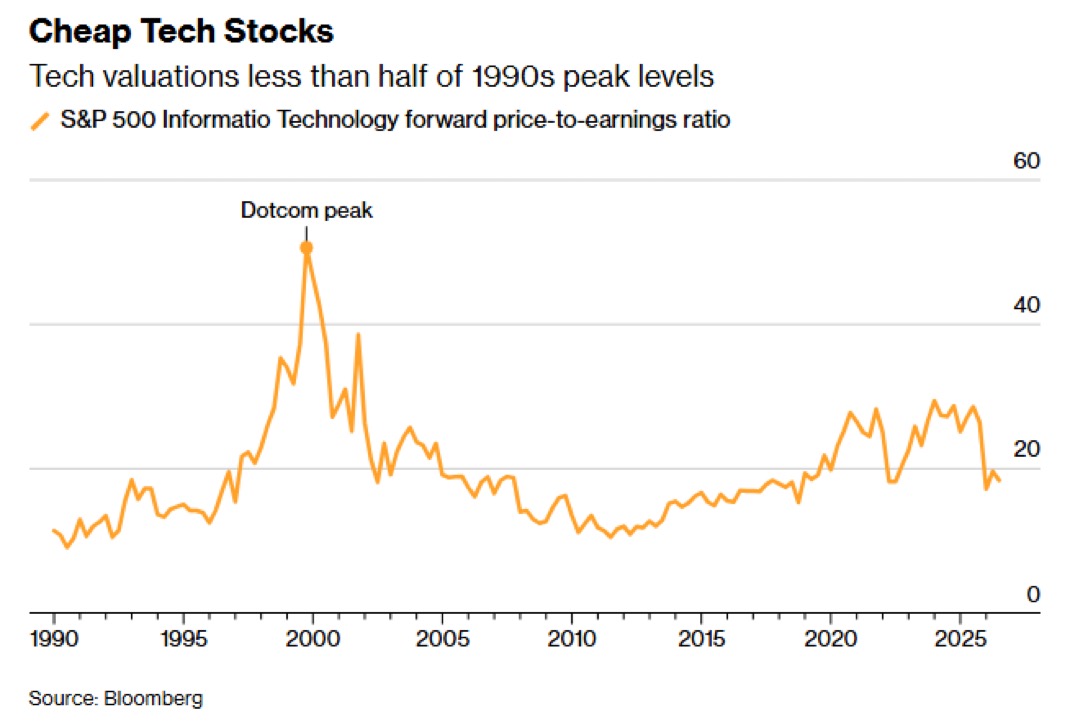
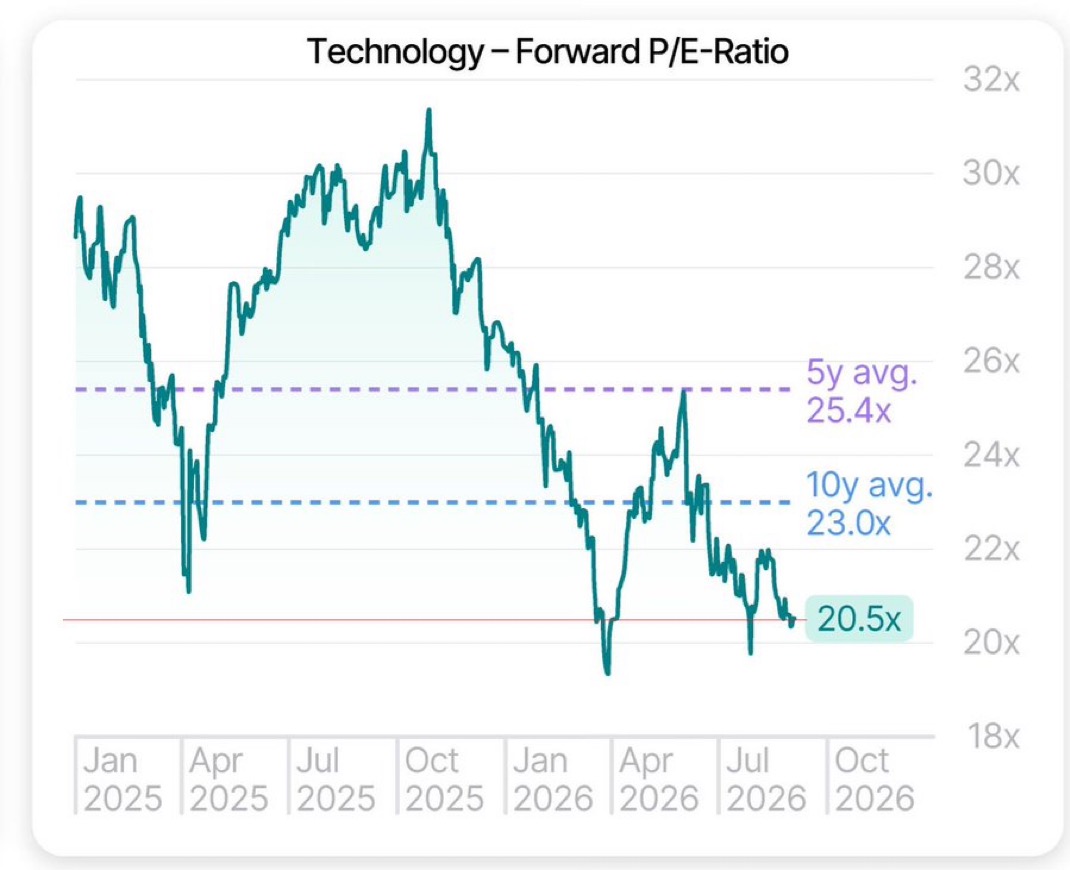
Tech P/E multiples have drifted further down to 20.5x average.
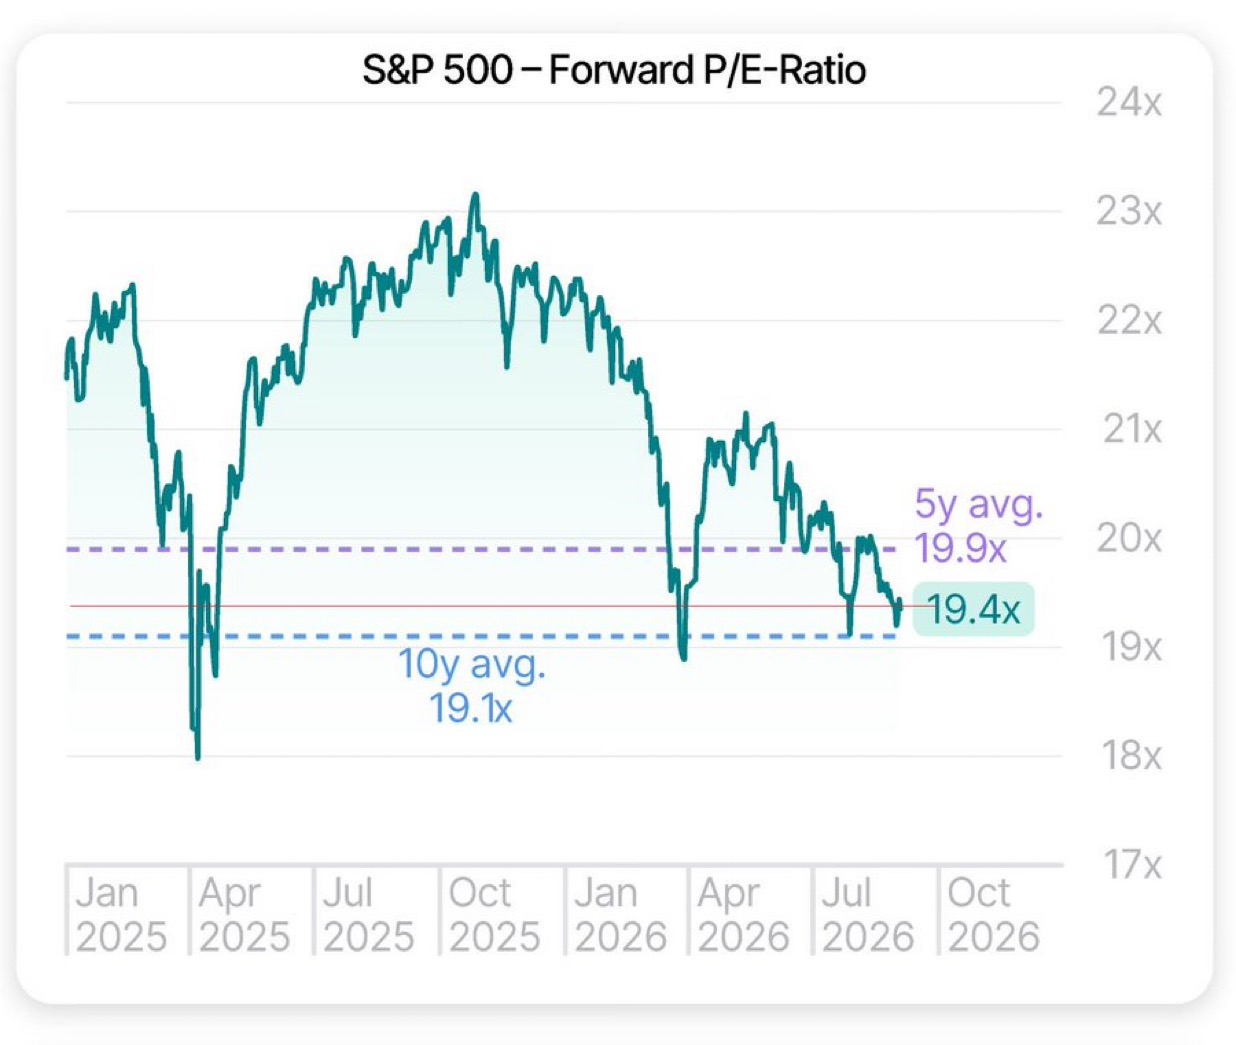
Finally the S&P 500 P/E ratio is down to 19.4x vs 5 year average of 19.9x.
Finally we provide a brief commentary on portfolio reporting period results during the month in the portfolio section of the report. We look forward to providing further updates in our next monthly report in October.
Sincerely yours,
Ron Shamgar and the TAMIM Team.
Fund Performance
Portfolio Highlights

Symal Group (ASX: SYL)
Symal reported record FY26 revenue of $1.14 billion, up 28%, and normalised EBITDA of $124.3 million, up 17.2%, in the upper half of $120–126 million guidance. Normalised NPAT was $49.0 million (20.6 cents). Work-in-hand was about $1.9 billion, net leverage 0.4x and liquidity $258.5 million. Fully franked dividends totalled 8.2 cents. FY27 normalised EBITDA is guided at $153–163 million, including a pro-rata Shamrock Civil contribution; capex is guided at $25–30 million and D&A at $55–60 million.
Since balance date Shamrock has joined the group and a Notice to Proceed lifted the Gawara Baya wind-farm civil contract to $366 million over about 24 months. The tendered pipeline and ECI book is about $9.1 billion. Integration and project execution remain the offsets. SYL is trading on 11x FY27 PE. Further M&A in the electrical/data center segment is a key focus in FY27. The company is one of the cheaper contractors on the ASX and with the delivery of guidance, contract wins and M&A, we see the stock gradually rerating higher.
Bravura Solutions (ASX: BVS)
Bravura grew FY26 revenue 10% to $283.6 million and cash EBITDA 76% to $77.1 million, with the margin at 27.3% and approaching 30% in the second half. Underlying NPAT more than doubled to $63.1 million. Operating cash inflow was $82.8 million; net cash closed at $50.3 million after large dividends. FY27 guidance is revenue of $280–300 million, with about 65% already pre-contracted, and cash EBITDA of $84–94 million (about 30% margin at the midpoint).
The guide assumes AUD/GBP of 1.90 versus 1.98 in FY26, so FX is a headwind. A $50 million buyback and $100 million facility support capital returns. Client concentration, residual churn and the step-down from rapid margin catch-up to steadier growth are the main caveats. More importantly, management noted their offering is becoming known to be best in class and the pipeline of opportunities is significant. Current guidance doesn’t not assume any new material logo wins.

Servcorp (ASX: SRV)
Servcorp beat upgraded FY26 guidance with underlying NPBIT of $87.0 million, up 24%. Statutory revenue rose 4% to $367.5 million and statutory NPBT 29% to $80.9 million. Underlying free cash was $101.9 million and unencumbered cash $152.4 million. Operating margin expanded 150 basis points to 18.5%. Dividends rose to 32 cents.
FY27 underlying NPBIT is guided at $85–90 million and free cash at no less than $105 million, with the dividend not expected below 34 cents. Management said most earnings from recent floor openings should land in FY28, when underlying profit is targeted above $95 million, with at least six new floors planned. Near-term growth is therefore modest after a bumper year. Our view is management guidance is conservative but as the stock has not been rewarded with a multiple re rate the management team has decided to use FY27 as an investment year with significant uplift in FY28.

Comms Group (ASX: CCG)
Comms Group delivered a record FY26 against June guidance of $74–75 million revenue (up about 32%) and underlying EBITDA of $8.0–8.5 million. Recurring services stayed above 90% of revenue. TasmaNet integration was completed as planned. Management is targeting a $9–10 million annualised EBITDA run-rate once TasmaNet synergies and about $0.5 million of duplicated Next/TasmaNet network costs are removed.
The $30 million onPlatinum sale to Thinkex completed on 1 September, with $28.5 million cash upfront; proceeds are earmarked for debt reduction and a later capital-return update. A fully franked final dividend of 0.125 cents was declared. Statutory NPAT remains modest after acquisition amortisation. The next catalyst is a capital return announcement. We expect a 2-3 cents fully franked dividend. The remaining divisions are likely to be sold or divested in the next 12 months.

The Koala Company (ASX: KOA)
Koala posted FY26 revenue of $332.3 million, up 20.1% reported and 24.4% in constant currency. Pro forma EBITDA more than doubled to $27.9 million (8.4% margin), beating the $24.8 million prospectus forecast. Statutory NPAT was $24.6 million versus a $4.6 million loss. The group ended debt-free with $71.2 million net cash. No formal FY27 range was given.
At the 26 August result management said the new financial year had opened with strong sales (20%+ growth), led by Japan and the US, despite a soft Australian consumer backdrop. Priorities are core-range refresh, UK penetration and testing Canada and Europe. Marketing intensity rose in FY26 and discretionary retail demand remains the external risk.
We estimate FY27 net cash to hit $100 million and expect the initiation of dividend during the year. KOA ticks all the boxes we look for in a company: founder led, management alignment with shareholders, strong growth and profitability, cashed up balance sheet, diversified business across several large economies, and finally an undemanding valuation and a lack of market coverage. We built a position right after the FY26 results.
Fund Facts
Investment Parameters
| Management Style: | Active |
| Investments: | Australian Equities |
| Investment Universe: | Australian Small Cap |
| Reference Index: | ASX Small Ords |
| Number of Securities: | 20-40 (10-20 Value, 10-20 Growth) |
| Single Security Limit: | +/-5% |
| Market Capitalisation: | Small Cap |
| Leverage: | No |
| Portfolio Turnover: | <50% p.a. |
| Cash Level (typical): | 0-100% (0-50%) |
Fund Profile
| Investment Structure: | Unlisted Unit Trust (available to wholesale investors) |
| Minimum Investment: | $100,000 |
| Management Fee: | 1.25% p.a. |
| Admin & Expense Recovery: | Up to 0.35% |
| Performance Fee: | 20% of performance in excess of hurdle |
| Hurdle: | Greater of: RBA Cash Rate + 2.50% or 4% |
| Entry/Exit Fee: | Nil |
| Buy/Sell Spread: | +0.25% / -0.25% |
| Distributions: | Semi-annual |
| Applications/Redemptions: | Monthly |
| Redemptions: | Monthly with 30 days' notice |
| Investment Horizon: | 3 - 5 years + |

Invest via TAMIM Fund
Request additional details by using the form or if you're ready to invest select the apply now button.
Invest via IMA
The TAMIM Australia Small Cap strategy is available as an Individually Managed Account (IMA). Please see the Strategy Summary for terms or request Investment Documentation via form.