Guy Carson
The Australian General Insurance landscape is dominated by three players: IAG, QBE and Suncorp. Over the last decade, investors in these companies have seen significantly different outcomes. In order to understand why, it’s important to look at how insurers make money and how they can insulate themselves from disasters.
How does an insurer make money? The below graphic from IAG shows us the basic business model.
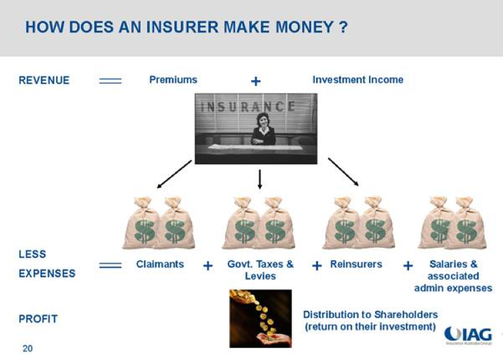
Essentially, an insurer receives income from premiums and investments and in turn faces claims as well as various expenses. The difference between the two becomes the profit.
The confusing thing for investors is that whilst the business model is simple, the terminology used can be confusing. For example most insurance companies quote three different numbers when it comes to premiums:
- Gross Written Premium (GWP) = the total amount received from customers for the payment of their insurance policies.
- Gross Earned Premium (GEP) = When calculating results for the financial year only include the portion of policies up to June 30.
- Net Earned Premium (NEP) = Gross earned premium minus reinsurance costs.
For earnings and valuation purposes it is the Net Earned Premium that matters although it is important to keep an eye on Gross Written Premium to see how the company is growing.
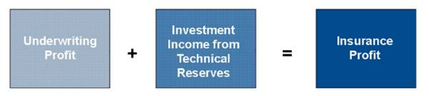
From Net Earned Premium we can then subtract the claims received as well expenses incurred in the course of business to arrive at the Underwriting Profit (or Loss). The first important step in choosing an insurance company is ensuring it makes an Underwriting profit.


So that’s how the business model works. The question is how do we analyse whether an insurance company is performing well? For that there are a few simple ratios that help us understand how the underwriting business is performing. These are:
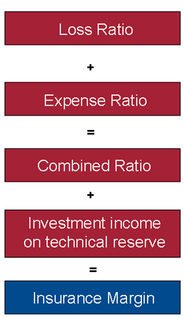
- The Loss Ratio (or Claims ratio) which is the ratio of the net claims expense to Net Earned Premium; in simple terms the percentage of claims they received the premiums they earn.
- The Expense Ratio which is the ratio of Underwriting expenses to Net Earned Premium; In simple terms the amount the company spends on its underlying expenses in order to run its business.
These two ratios together equal the Combined ratio. The combined ratio plus the investment returns earned give the Insurance Profit Margin. This margin describes the profitability of the business.
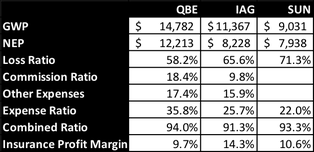
In the table we have separated the expense ratio into two parts for QBE and IAG – commissions and other expenses. This shows one of the critical differences between the QBE model and the other players. Companies with stronger brands tend to pay away less in commissions to sell their products. IAG in Australia and New Zealand has a number of well-known brands (think NRMA, CGU and more recently Coles Insurance). In their expansion overseas QBE took a strategy of rolling up smaller players, in doing so they have ended up with a significantly higher commission base and hence higher expense base. This additional cost pushes up their expense ratio and makes the company less profitable.
In the early days of the expansion, the company appeared to be doing well despite this higher expense base. Their Insurance Profit Margin rose strongly through to 2007 as can be seen below. The drivers included increased premiums, increased investment returns and a benign claim environment.


Of course, defining quality is only part of our investment process. We also have to take into account valuations as well. To this end, one challenge facing Insurance companies is the current low interest rate environment. Low interest rates mean the return on both the policy holders and shareholders’ funds are now lower than previous and hence the multiplier effect is no longer as strong. This suggests that insurance margins moving forward are unlikely to reach the highs of yesteryear. As a result it is also unlikely the shareholder returns of the past will be repeated.
Everything has its price though the question remains whether there is value right now. To that end we believe the market is currently pricing a solid recovery for QBE on the back of improving signs in its US business with the company trading on 13.1x forward earnings with expected growth this year of over 20% and further growth in FY18. The company can’t afford for anything to go wrong in this recovery. Meanwhile, IAG is priced fairly fully at 17.3x with earnings growth expected over the next few years of around 10% (after stripping out the impact of the Berkshire Hathaway quota share arrangement). Any increase in claims will likely weigh on the price. So in our opinion there appears to be no obvious value at the moment; however it is worth keeping an eye on the sector as share prices tend to overreact on events outside of the companies control such as weather related events. When share prices correct due to these events, they can quite often be solid longer term opportunities.