35 Years of Australian Interest Rates – Where has it left us?

35 Years of Australian Interest Rates – Where has it left us?

18 Jun, 2017 | Market Insight

This week we take a look at the peer-to-peer lending space. In a time when term deposit rates are negligible, is it time to look at alternatives for your income? How can you achieve the income you want while minimising the inevitable increase in risk associated with consumer loans?
The 80’s were memorable for a number of reasons. Fluorescent clothing, Olivia Newton John, the Americas Cup win and an average interest rate on one-year term deposits of 13%. There was no Government guarantee of deposits and CBA had not even listed (that happened in 1991 at $5.40 per share).
​Since then rates have been volatile but on a steady downward trend for the last 35 years. Likewise, inflation has come down significantly from highs of over 12% in 1982.
1 Year TD Rate vs Inflation Graph

Source: RBA
What conclusions can we draw from this chart? Obviously, term deposit rates are at a record low. But this is only part of the story. To determine the real value of a term deposit we need to look at the real return. That is, the term deposit rate less the rate of inflation. If that gap is small our real return is small. If inflation is greater than the term deposit rate as it was in 1998, 2001 and 2008 investors are actually losing money by putting it in the bank.

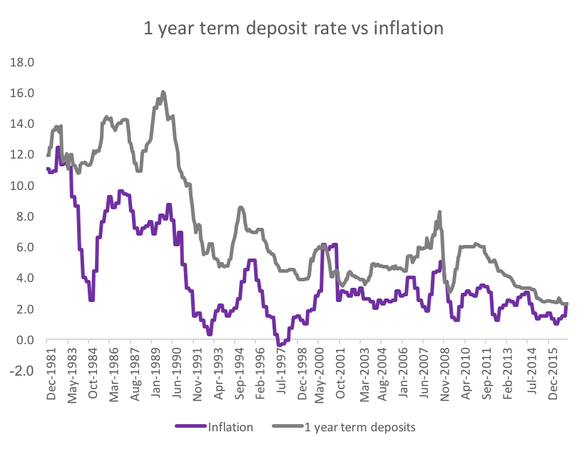
The chart below shows the real rate rates of return on term deposits since December 1981.
Real 1 Year TD Rates

Source: RBA
It is clear that the real return on bank deposits has been decreasing over time. Some of this can be explained by the lower risk – attributable to the Government bank guarantee. But really, this shows that term deposits are just not a good deal. Real returns of less than 1% should not excite anyone.

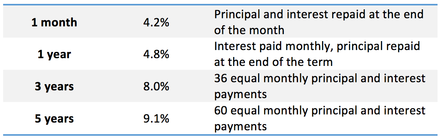
But fortunately, there has never been more choice for Australian’s looking for a better fixed income return. With a moderate increase in risk investors can earn significantly greater returns. The banks have been doing this for years it is high time that retail investors get a chance to invest in similar assets. The chart below shows the rates that banks have charging on various types of loans since 1981.
Interest rates: Personal loans, small business, mortgages Graph

Source: RBA
A few things stand out. Mortgages and small business loan rates have been coming down since April 1995 and we all know why. Disruptors such as Aussie Home Loans and RAMS forced the banks to start pricing fairly.

But, personal loans are basically at the same place as they were 20 years ago. This is during a period when default rates have been low and the economy has been strong.

But the story is more interesting when we look at real returns to the banks on personal loans.

Personal Loans: real returns

Source: RBA
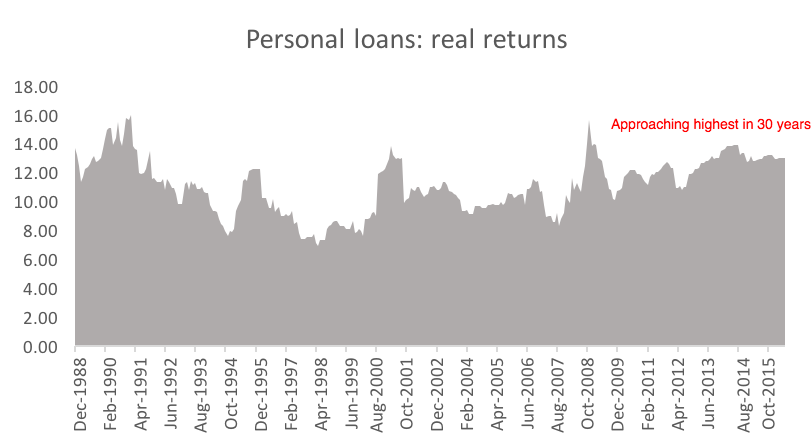
Real rates have actually gone up over the last 20 years. This is in the context of a generally stronger economic conditions and low default rates.

So let’s draw all this together. Term deposits are at historically low returns. More importantly, real returns on term deposits have come down consistently for the last 20 years, in some cases hardly keeping pace with inflation.

In contrast, the real return on personal loans has been increasing giving the banks exceptional returns for the risk.

​Peer-to-peer lending 

Until recently, access to the personal loan asset class was limited to banks and credit unions. Peer-to-peer lending gives retail investors the opportunity, for the first time to access this asset class.

In the USA and the UK, peer-to-peer lending has become very mainstream with over $20 billion dollars lent in 2016.

In a nutshell, peer-to-peer lenders match people looking to borrow money with people who have money to lend. Most peer-to-peer lenders have chosen to focus consumer credit and small business loans. Small loans like this allow greater diversification and lenders benefit from substantial data available to the peer-to-peer platforms which allow them to make informed credit decisions.

Leading peer-to-peer lenders, like RateSetter and Society One, target the top tiers of creditworthy borrowers. They compete against the banks (not payday lenders) for borrowers. Rates offered to borrowers are often lower than what that borrower would pay to a bank as peer-to-peer platforms operate more efferently than banks and pass on costs savings to borrowers and lenders.

There are two peer-to-peer models that have developed, one from the USA and the other from the UK.

UK & US Model P2P Lending Table

What are the risks and returns?

​Peer-to-peer lenders are not banks, so they do not benefit from the Government deposit guarantee. However, many investors have found that by choosing a platform that allows some sharing of the risk between investors (eg. a shared provision fund) or ensuring a diversified portfolio of loans they can earn healthy returns with an acceptable level of risk. For example, RateSetter’s current market rates after fees are:
RateSetter Rates Table

Source: RateSetter website, 20 June 2017
​The best peer-to-peer platforms provide lots of information to allow investors to assess the risks. Data like historical default rates, size of provision fund, number of borrowers and key borrower characteristics. Some platforms, like RateSetter, allow investors to download their entire loan book so that investor can conduct their own analysis on the loans and track record of the peer-to-peer platform.