The chart below from the ABS splits out the different components of GDP for the latest quarter. As you can see the standout from the last quarter was GFCF – Private (Gross Fixed Capital Formation – Private) which represents private investment. This added 0.9% to the final number despite residential investment falling with infrastructure taking up the slack.
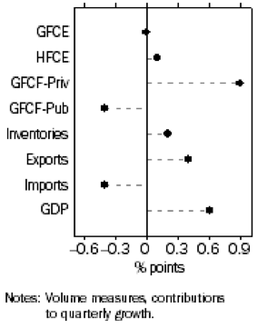
On the other side is the Australia consumer. Household Final Consumption Expenditure (HFCE) added just 0.1% which was the weakest result since 2008. This shouldn’t come as a major surprise and is something we have talked about for some time (see here).
The trend of increased infrastructure investment, lower residential investment and subdued household spending are in our opinion likely to continue (again we wrote about this here). In order to see the economy transition away from the mining boom, the Reserve Bank of Australia cut interest rates to spur economic transition. With the worst of the mining decline now behind us, the RBA is reluctant for the interest rate cuts to continue (and at 1.5% there is a little scope for further cuts anyway). The interest rate cuts spurred a residential boom through both prices and (more importantly for the economy) construction.
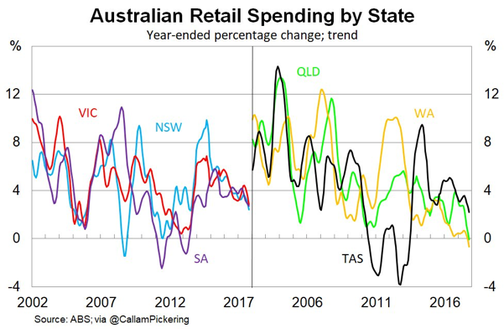
Further interest rates cuts are most likely off the table now and that means no further boosts for the household. It also means house price growth will slow (and potentially reverse). With no sugar hits left for households, consumption is set to be weak and has been slowing for some time. We can see this trend in the chart below looks at retail sales growth by state. The decline has been led by the mining states with Western Australian and Queensland in negative territory whilst the other states are trending downwards as well after a strong bounce in 2012 as the interest rate cuts started.
Retail sales were particularly weak with two key drivers. On July 1, households were hit with two price increases. Firstly, the large amount of household debt got hit with APRA induced interest rate increases. These rate rises were for interest only and investor mortgages. This did see a significant amount of switching from Interest only to Principal and Interest but the overall impact remains capacity taken out of the household budget. Secondly, electricity prices went up 17% across the board. The combined impact is that heavily indebted households have less to spend. Whilst the media has focused on the entrance of Amazon to Australia, it is our opinion that the weakness in household balance sheets has been the major source of weakness for retail companies to date.
We do have to note thought that both of the price rises mentioned above are one off in nature. We do see households as the major risk to the Australian economy; however a stabilisation rather than a capitulation is the most likely scenario in the near term without further external cost increases.
The major question for households therefore becomes how much impact does the wealth effect have? The wealth effect is the theory that when household wealth rises, people will feel richer and spend more. On the flipside, when prices soften, spending will suffer. With a majority of household wealth held in property and prices potentially starting to soften, there is the potential that household confidence will weaken and spending will follow.
For us, the retail and residential sectors (as well as 2nd order derivatives) remain difficult to invest in. There may be specific opportunities but “Green Shoots” remain a distant thought.
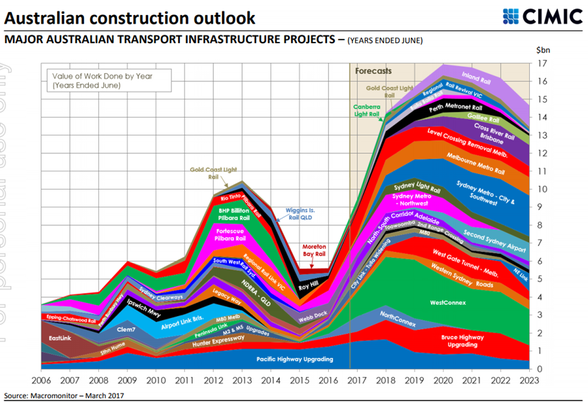
On the flip side, infrastructure investment continues to be the most likely driver of economic growth going forward. The chart below shows the range of projects and the spike in activity set to come. The projects are focused on road work and along the East Coast.
Timing the cycle is always difficult so whilst we do have an exposure to infrastructure, our major sector exposures continue to be Information Technology and Healthcare. These are two sectors that have structural tailwinds and contain quality niche companies that we believe will continue perform strongly regardless of the economic cycle.