
Australian Equities
Australia All Cap

September 2026 | Investor Update
Dear Investor,
We provide this monthly report to you following conclusion of the month of September 2026.
The TAMIM All Cap Fund was down -3.02% (net of fees) during the month, versus the Small Ords down -2.34% and the ASX300 down -2.43%.
September was a relatively quiet month from a portfolio newsflow perspective. We spent the month meeting companies on their results roadshow. Overall commentary is positive with some project delays due to high oil prices and supply shortages in some tech components. There’s some cautiousness in the discretionary retail sector, although there are still some high quality operators that are growing sales strongly. We discuss one of those in the stock spotlight of the report.
Interestingly the luxury goods segment of the retail market has seen a strong rebound last few months, as many retailers are cycling quite poor trading conditions from 12 months ago. The comparable sales will only get easier in the next 6 months. We are targeting some opportunities in this space.
Overall September saw weak sentiment return after a rebound in August. A couple of rate hikes in the US and Australia during the month and oil prices getting back to $100 a barrel – were always going to dampen sentiment.
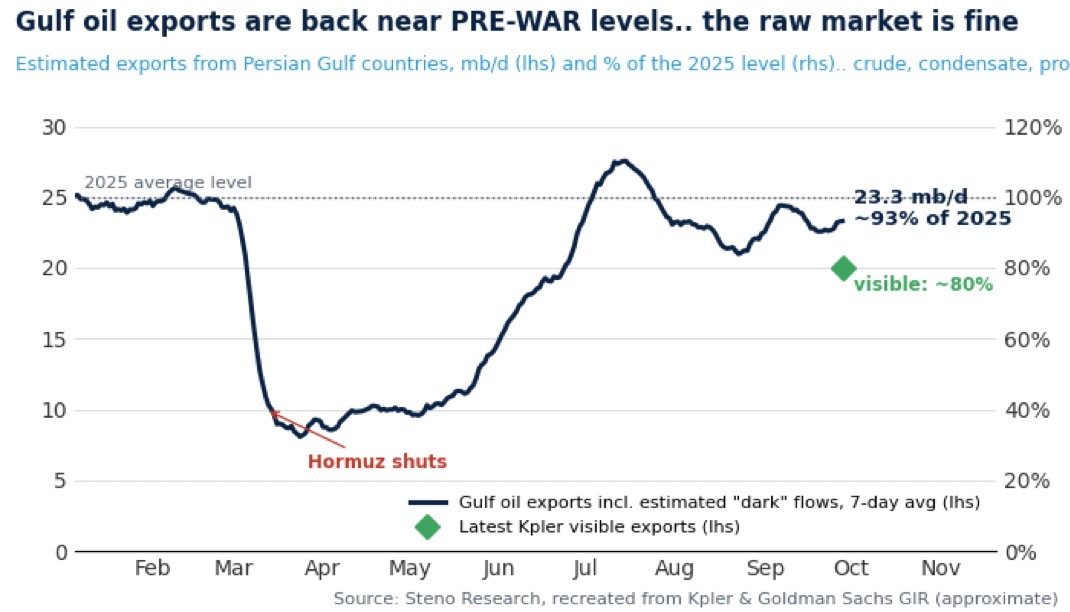
On the positive side, the flow of oil in the Strait of Hormuz has now returned to pre Iran War levels. So in theory oil prices should subside next few months without any renewed escalation. Diesel prices remain elevated as refinery disruptions create some short term headwinds.
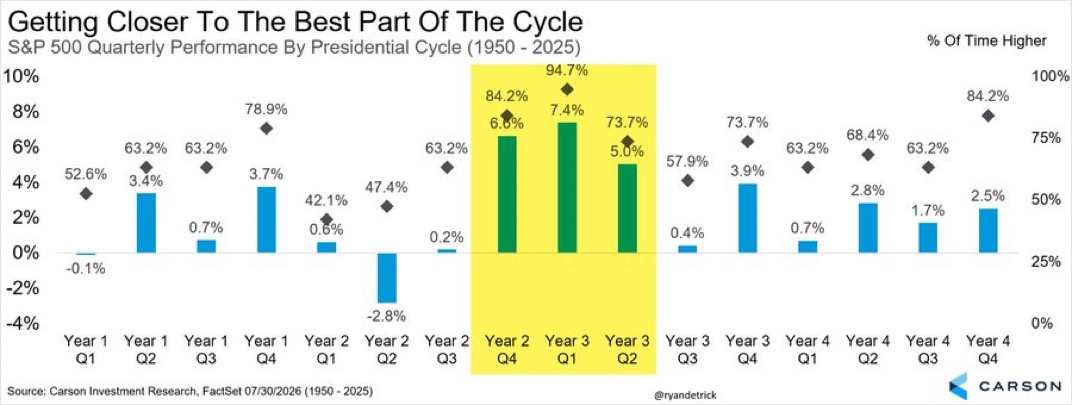
Furthermore, as we enter the seasonally strong Q4 of the calendar year, we expect markets to trade higher. This quarter, and the next two, are normally the three strongest out of the entire four-year presidential cycle. This bodes well for investor sentiment and the Fund performance.
We believe the portfolio is positioned well in cashed up companies, that are forecasting growth this year, are highly profitable, and trading on historically record low multiples. We believe all of these have clear near term catalysts for the stocks to re rate higher.
Finally we provide a brief commentary on portfolio updates during the month in the portfolio section of the report. We look forward to providing further updates in our next monthly report in November.
Sincerely yours,
Ron Shamgar and the TAMIM Team.
Fund Performance
Portfolio Highlights

Tuas Limited (ASX: TUA) Reported FY26 results. Revenue rose 24% to S$187.6m and underlying EBITDA 22% to S$83.8m. Statutory NPAT was S$26.0m, up 277%, and underlying NPAT S$29.6m. Active mobile services grew from 1.254 million to 1.458 million. Management attributed the Q4 slowdown to intense competition, with rivals mimicking Simba’s plans, and to SIM terminations linked to scam activity. Scam-related terminations are ongoing across telcos, so this pressure may continue in FY27.
On spectrum, management said some use permitted by IMDA occurred outside the applicable limitations. They described the issue as involving both software and hardware, declined to elaborate, and gave no timeline for an IMDA decision. Simba is cooperating with the investigation. The M1 deal had already lapsed after the review was suspended.
Simba expects S$15–30m of incremental cybersecurity-related capex and opex in FY27. Management said threats and regulatory requirements are evolving, noted that AI is making threats more sophisticated, and that spending will continue. They gave no capex/opex split or outcome targets, saying the framework is still developing.
In summary, TUA enters FY27 with several headwinds of a higher cost base, slower sub growth and continued regulatory uncertainty. For the first time in many years TUA will have minimal ebitda growth of 5-10% at most. With $550m of cash, the valuation prices all the bad news on 5x EV/Ebitda. We reduced the position on the day of the result and we will track progress at the December AGM. We believe the stock is attractive on a medium term basis but aknowledge short term, there’s not a lot to get excited about.

Alcidion (ASX: ALC) Northern Care Alliance NHS Foundation Trust awarded a three-year Miya Flow contract worth A$7.5m, replacing ExtraMed Flow and extending the platform across four Greater Manchester hospitals: Salford Royal, Royal Oldham, Fairfield General and Rochdale Infirmary. About A$4.5m of revenue is expected in year one, including a six-month ExtraMed renewal during implementation. Options cover a further two years and additional modules, with no value assigned. The win extends Alcidion’s NHS patient-flow footprint on Miya Precision.
We see this win as both de risking FY27 guidance and validating ALC strategy of acquisitions and follow on upsells. We believe the company is well set to win further deals and even a potential large EPR win in the UK. The upside here is significant next 1-2 years.

Symal (ASX: SYL) Gawara Baya Wind Farm received Notice to Proceed, lifting the head contract to A$366m from A$347m, with works starting immediately and a roughly 24-month program in North Queensland. Symal also completed the Shamrock Civil acquisition on 31 August, consolidating from 1 September. Completion consideration was A$50.8m, of which A$34.7m was cash and A$16.1m deferred (A$5.9m cash and A$10.2m in shares).
Earn-outs remain capped at A$28.4m across FY26–FY27. The deal is expected to be EPS-accretive in year one and was already assumed pro-rata in FY27 EBITDA guidance of A$153–163m. Shamrock adds Queensland, South Australia and Northern Territory defence and resources capability. SYL is one of the cheaper contractors on the ASX with exposure to Data center build, Infrastructue spend and renewables. An acquisition in the data center space and further contract wins are the key for the stock to go higher.

BLS pharmaceutical (ASX: BLS) reported a strong FY26 results. Revenue was A$74.2m, up 161% and at the top of guidance. Adjusted EBITDA rose 171% to A$19.0m, a 26% margin, and NPAT was A$15.4m versus A$4.9m. Operating cash flow was A$5.4m, with A$13.3m cash.
Commercial milestones included a two-year, A$50m German supply agreement with ADREXpharma (minimum A$25m in the first 12 months), the start of manufacturing for Aurora Cannabis, first supply into Costa Rica, and continued build of the Scottish GMP plant, due by end-2026.
FY27 guidance is revenue of A$105–115m (+42–55%) and an adjusted EBITDA margin of 23–26%. Guidance is based on Australian demand and existing export contracts and does not include a full contribution from the UK facility. At the midpoint of guidance the company should report $27m of ebitda which historically has seen multiple upgrades through the year. The UK opportunity is significant. We took profits between $1.20-$1.30 and we will continue to hold the remaining position for now.

The Koala Company (ASX: KOA) has spent most of its short life as a listed company in exactly that position.
Koala floated on 31 March 2026 at A$3.40 a share, raising A$68 million at a valuation of around A$305 million. It could hardly have picked a tougher moment. Consumer confidence was sitting near record lows, the RBA was lifting rates and the listed furniture and homewares names had been marked down hard. The shares enjoyed a brief pop on debut, then drifted below the issue price through May, June and July, trading close to A$3.00 for much of that period.
Then, on 26 August, Koala delivered its first full year result as a listed company. It came in ahead of the prospectus forecasts on revenue and earnings, it was debt free, and the new financial year had started stronger still. The share price has since moved meaningfully higher.
Even after that move, we think the market is still pricing Koala like a mattress retailer in a downturn. We think it is something quite different, and considerably better.
The simplest way to describe Koala is this: if Temple & Webster (ASX: TPW) and Nick Scali (ASX: NCK) had a baby, it would look a lot like Koala.
From Temple & Webster it inherits speed and asset light execution. Koala is a digitally led, direct to consumer brand with only two showrooms in total. From Nick Scali it inherits curated product discipline, pricing power and a focus on margin. Koala designs all of its furniture in house rather than reselling white label product.
The result is a capital light global operator that becomes more efficient as each market matures, with an innovation engine that keeps lifting both product quality and unit economics.
Koala concentrates its demand into roughly 20 core products. That sounds like a constraint. In practice it is one of the most important parts of the model.
Fewer, higher volume products drive manufacturing efficiency, lower cost of goods and faster iteration. A Sydney based R&D team ships new generations of each product based on customer feedback, product data and engineering improvements. FY26 delivered the breakout Torquay and Tamarama modular sofas, next generation mattresses, the fourth generation Koala Sofa Bed and the second generation Wonder sofa bed. Each iteration lifted quality and improved margins at the same time.
Sitting furniture is where this gets interesting. Modular sofas and sofa beds carry higher average order values and higher margins, and modularity means one product can generate far more revenue than a smaller item ever could.
The second engine is brand. As brand equity builds in a market, customers trade up into higher value, higher margin products, and each marketing dollar goes further. Contribution margin expands without the business needing to lift its marketing spend at the same rate. Koala has spent a decade building that equity in Australia. It is now running the same playbook offshore.
The result was better than the share price had assumed.
FY26 was a clean result, and the numbers tell the story:
- Revenue of A$332.3 million, up 20.1% (24.4% in constant currency)
- Gross profit of A$216.9 million, up 25.7%, with gross margin up 2.9 percentage points to 65.3%
- Contribution margin of A$88.0 million, or 26.5% of revenue, up 2.2 percentage points
- Operating costs up 8.5%, against revenue up 20%
- Pro forma EBITDA of A$27.9 million, up 139.2%, ahead of the A$24.8 million prospectus forecast
- EBITDA margin of 8.4%, double the 4.2% of the prior year
- Statutory net profit of A$24.6 million
- Operating cash flow of A$28.6 million
- The line I would focus on is operating costs growing at less than half the rate of revenue.
That is what operating leverage looks like in practice. Lean local teams sit on top of shared global capabilities in product, marketing, technology, finance and people. Revenue scales faster than the cost base, and each incremental dollar of sales drops through to earnings at a much higher margin.
Australia. Revenue of A$166.7 million and contribution margin of A$49.7 million, or 29.8%. This is the template market. A decade of brand building underpins strong marketing leverage and a premium product mix.
Japan. Revenue of A$89.4 million and contribution margin of A$25.6 million, or 28.6%. Plenty of Australian retailers have tried Japan and come home bruised. Koala has built a business there with margins almost level with its home market, and is now expanding from mattresses into sitting furniture with strong customer uptake.
United States. Revenue of A$74.9 million, up 67.6%, making it the fastest growing market in the group. Contribution margin was A$13.0 million, or 17.3%. The US is earlier stage, but Koala is positioned at the premium end, where its curated range supports higher price points. It navigated tariffs and volatility during the year while building adoption of its new sofa lines.
The gap between a 17.3% contribution margin in the US and almost 30% in Australia is, to my mind, the most interesting number in the result. It is the opportunity. If the US follows the path Australia and Japan have already travelled, the earnings uplift from margin alone is substantial, before counting any growth.
United Kingdom. Revenue of A$1.2 million in a partial year, with a small negative contribution of A$0.3 million reflecting a deliberately lean launch. Management says the UK turned contribution positive after the period.
Next on the list is Canada, targeted for the second half of FY27, with broader Europe under evaluation. The approach is the same each time: enter lean, build a culturally relevant brand, let mix and margin follow.
In the first eight weeks of FY27 to 23 August, group order revenue rose 27% year on year in constant currency, or 20% in reported Australian dollars. Every market was at or ahead of internal expectations, and international markets accounted for 60% of revenue in the period.
That last figure deserves a moment. Koala is routinely described as an Australian online furniture retailer. Most of its revenue is now earned offshore.
Management has chosen to emphasise execution over formal full year guidance this early in the year. That is sensible for a business still in its first year of listed reporting, and I would rather that than a number set to be beaten.
Koala is debt free with A$71.2 million of net cash. Net assets swung from negative A$9.9 million to positive A$38.1 million over the year.
Just as important is the shape of the balance sheet. Koala runs a negative working capital model, where payables and deferred revenue more than fund inventory. Combined with a light fixed and intangible asset base, the business can grow without consuming its own cash. Growth funds itself.
Management has flagged a flexible capital management stance and a pathway to dividends. We think a dividend policy is likely to be announced at the AGM or with the February result. If no dividend is paid, we expect Koala to finish FY27 with around A$100 million of net cash.
The answer has very little to do with the business.
Koala is a recent IPO. It has limited broker coverage, limited institutional ownership and limited awareness in the broader market. At listing, the large majority of shares were held by founders and early investors under voluntary escrow, which leaves a thin free float and makes the stock hard for larger funds to buy in size.
It has also been lumped in with domestic discretionary retail during a rate hiking cycle. That is understandable. It is also, increasingly, the wrong comparison for a business earning 60% of its revenue outside Australia.
This is a familiar small cap pattern. The fundamentals arrive first and the audience arrives later. The rerating usually happens somewhere in between.
Koala was founded in Byron Bay in 2015 by Dany Milham and Mitch Taylor with a single mattress product. Milham returned as CEO in 2024 and held around 20.7% of the company at listing, with Taylor holding around 16.3%. Perennial Partners, an investor since 2020, held around 22.7%.
That is the kind of alignment we like to see. The people running the business have far more riding on the share price than on their salaries.
Koala is trading on around 13 times forward earnings, while growing earnings at more than 30% a year, with net cash representing a meaningful share of its market value.
In our experience, that combination does not persist for long once a company builds a track record as a listed business. Our valuation is A$8.00 a share.
The catalysts are clear enough:
- A formal dividend policy at the AGM or the February result
- The 1H FY27 result in February 2027, the first half year comparison as a listed company
- Further US contribution margin expansion
- The Canadian launch in the second half of FY27
- Broker initiations and growing institutional awareness as the free float widens
No investment case is complete without an honest look at what could go wrong, and Koala has several.
The Australian consumer. On 29 September the RBA lifted the cash rate to 4.60%, its fourth increase of 2026 and the highest level since 2011, and kept the door open to further hikes. ABS data showed discretionary spending fell 0.3% in August. Australia still generated around half of FY26 revenue, and furniture is one of the easiest purchases for a stretched household to defer.
US execution and tariffs. The US is the growth engine, but it is also the lowest margin market and the most exposed to tariffs and trade policy. Contribution margin convergence with Australia is the opportunity, not a certainty.
Currency. The gap between 27% constant currency growth and 20% reported growth in the FY27 trading update shows that currency is already a headwind. With most revenue now earned offshore, movements in the yen and US dollar will increasingly affect reported results.
Product concentration and supply chain. A focused range of around 20 core products is efficient, but a misstep on a key product hurts more. Koala relies on offshore manufacturing partners and accelerated its supplier diversification program in FY26, which tells you management sees the risk too.
Marketing efficiency. Direct to consumer brands live and die by customer acquisition costs. If digital advertising costs rise sharply or brand momentum fades, the operating leverage that drove FY26 can work in reverse.
Competition. Koala competes with Ecosa and Sleeping Duck in mattresses, with Temple & Webster online and with IKEA at the value end of home furnishings, as well as local players in each offshore market.
New market expansion. The UK, Canada and potentially Europe all consume capital and management attention. The history of Australian retailers expanding offshore is not a kind one. Koala’s record in Japan and the US is encouraging, but each market is a fresh test.
Liquidity, escrow and selling by insiders. Existing shareholders, including co-founder Mitch Taylor, sold A$48.1 million of stock into the IPO. Escrowed shares are scheduled to be released in tranches around the FY26, FY27 and FY28 results, and Perennial’s large holding will at some point need an exit. Supply of stock may weigh on the share price at times, and the thin free float can amplify moves in both directions.
Short track record and limited independent research. Koala has reported only one full year result as a listed company. Research coverage is thin, and the lead managers on the IPO were Barrenjoey and Morgans. We are not aware of published bearish broker views on the stock at the time of writing, which is itself a reflection of how little coverage it has. Our A$8.00 valuation is our own and depends on Koala sustaining strong earnings growth.
Koala listed into one of the worst retail backdrops in years, slipped below its issue price and was largely ignored. Its first result as a listed company then beat the prospectus, showed real operating leverage, and confirmed a debt free balance sheet with A$71.2 million of net cash and a working capital model that funds its own growth.
The market still appears to view Koala as a domestic mattress retailer exposed to rising rates. In reality, it is a founder led, capital light global brand that now earns most of its revenue offshore, is profitable in every established market, and still has a large margin opportunity in the US.
KOA ticks all the boxes Tamim looks for in a company. It is founder led with significant shareholder alignment. It has a strong brand and has executed successfully in multiple countries. It has a cashed up balance sheet, strong growth and profitability, and in our view it is significantly undervalued with clear catalysts ahead.
The lesson for long term investors is a familiar one in small caps. When a newly listed company delivers on its promises and the market has not yet assembled the audience to notice, the gap between price and value can be wide. The job is to judge whether the business is genuinely as good as the result suggests, size the position for the risks, and give the market time to catch up.
Fund Facts
Investment Parameters
| Management Style: | Active |
| Reference Index: | ASX 300 |
| Number of Securities: | 20-50 |
| Single Security Limit: | 10% (typically 5%) |
| Investable Universe: | ASX (focus on ASX300 ex20) |
| Market Capitalisation: | Any |
| Leverage: | No |
| Portfolio Turnover: | < 25% p.a. |
| Cash Level: | 0% - 100% (typically 5 - 30%) |
Fund Profile
| Investment Structure: | Unlisted Unit Trust (available to wholesale investors) |
| Minimum Investment: | $100,000 |
| Management Fee: | 1.25% p.a. |
| Admin & Expense Recovery: | Up to 0.35% |
| Performance Fee: | 20% of performance in excess of hurdle |
| Hurdle: | Greater of RBA Cash Rate + 2.5% or 4% |
| Entry/Exit Fee: | Nil |
| Buy/Sell Spread: | +0.25% / -0.25% |
| Applications: | Monthly |
| Redemptions: | Monthly with 30 days notice |
| Investment Horizon: | 3 - 5 years + |
| Distributions: | Annual |