Australian Equities
Australia Small Cap Income
Investor updates
Below you will find this month’s commentary and portfolio update for TAMIM Australia Small Cap unit class.

February 2025 | Investor Update
Dear Investor,
We provide this monthly report to you following conclusion of the month of February 2025.
The TAMIM Small Cap Fund was down -6.75% (net of fees) during the month, versus the Small Ords down -2.80% and the ASX300 down -3.79%.
February reporting season was one of the more volatile periods we have seen in the last 20 years. Sharp moves in response to earnings results were commonplace, with investors reacting swiftly to any sign of weakness. A miss to consensus was punished – with -20% or -30% share price swings – a common theme.
Unfortunately a combination of volatile markets and getting a handful of positions wrong – contributed to a very disappointing month for the fund.
In cases where a company has fundamentally disappointed we acted swiftly and exited the position. In some cases we took the opportunity to add to a position where we felt the market has undeservingly sold the stock.
Overall we are now quite pleased with the portfolio composition, having exited underperforming positions and added new positions that we believe are providing significant upside this year. We discuss some of these in the report with more disclosure to come in the next few months.
Over the last few weeks (since mid February) the markets here and in the US are officially in correction territory (-10% drawdown). A combination of uncertainty surrounding the new Trump administration Tariff policy and investors concerns about a possible slowdown and risk of a US recession, has seen the market selloff quite aggressively.
In fact the last few weeks since February 19th highs, has seen the quickest -10% drawdown since the COVID crash of March 2020. So should investors be concerned, or is this just another healthy correction in what is a structural long term bull market? We believe the latter holds true and we explain why further below.
The so called Trump 2.0 administration has been given a mandate to fix the US government budget deficits and the unsustainable debt spiral that’s been building over the last few years. This time around, The Trump 2.0 version – is less focused about short term market reactions – and has surrounded himself with a savvy group of policy makers to help fix the US economy and drive sustainable growth.
This is visible with the appointment of the new Secretary of the Treasury – Scott Bessent – who has a very clear plan to reduce government spending and regulations partly through the efforts of Elon Musk and DOGE, and by doing so balance the budget and reduce the long term borrowing costs of the US government (10 years bond yield). For those unaware, Scott Bessent is a legendary Hedge fund manager who understands markets and economics incredibly well.
The best analogy we can think of is the equivalent to Warren Buffett coming to work for us as an equity analyst.
These measures in combination with Tariffs and incentives will bring back investments and manufacturing on shore to the US and support domestic employment. The key focus is to shift unproductive federal government employment into the more productive private sector labour market without putting pressure on labour costs. At the same time tax cuts and a reduction in bond yields will spur domestic spending and stimulate growth.
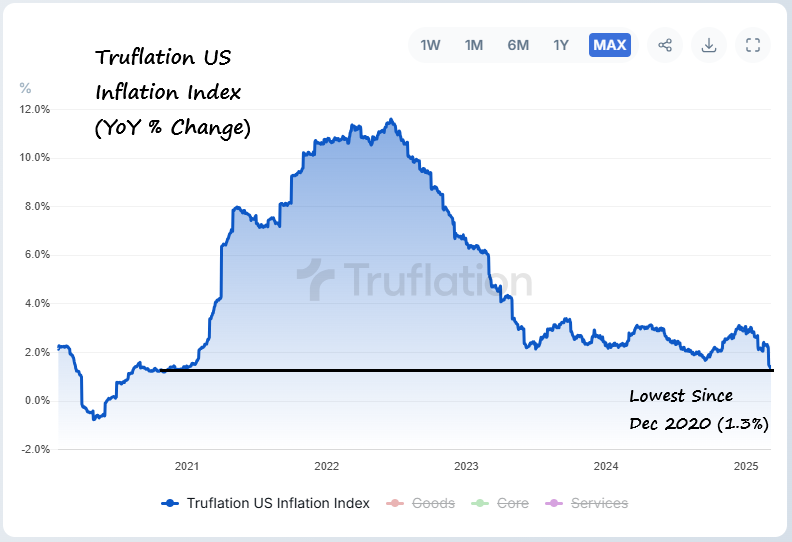
We see these measures as very logical and with true inflation sitting at under 1.5% (Truflation) we believe the Federal reserve will be forced to reduce rates at a faster pace than market expectations. Lower rates and a growing economy following a period of adjustment – should lead to a market rally later this year and into 2026.
In the short term these actions or the so called “Detox Period” will have some economic pain and the market is currently pricing that in. The uncertainty of how much economic pain is required is what causing the current market volatility.
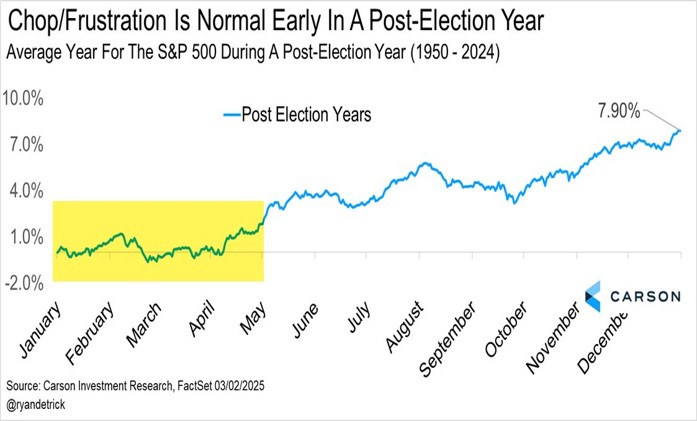
There are some other historical measures to consider in the context of a long term perspective. Historically the first year of a new president tends to see markets volatile in the first half of the year as new policies create uncertainty. We are seeing this play out with the Trump 2.0 tariffs. This so called first year seasonality is normal on a historical perspective.
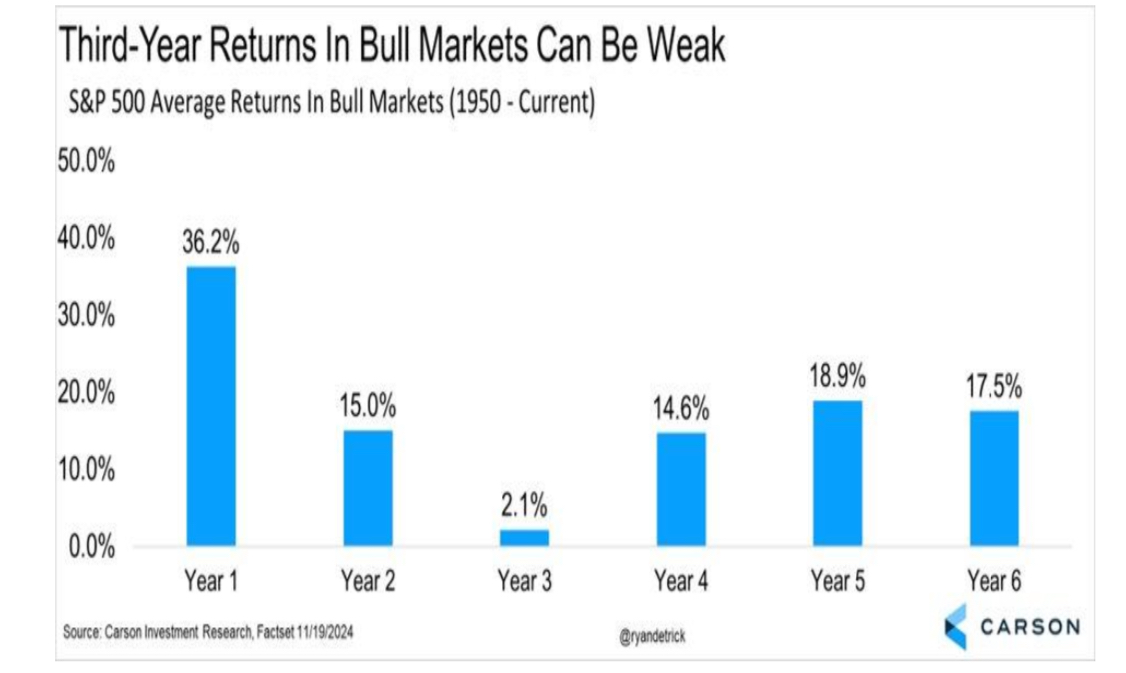
In conjunction, we are currently in the third year of this current bull market and these tend to be the weakest years of an average bull market that is at least 6 years long in average tenure. Investors must remember that the first 2 years tend to be quite strong from a returns perspective and we have seen this play out in 2023 and 2024. The good news is that years 4-6 are back to strong annual returns, so not long to go.
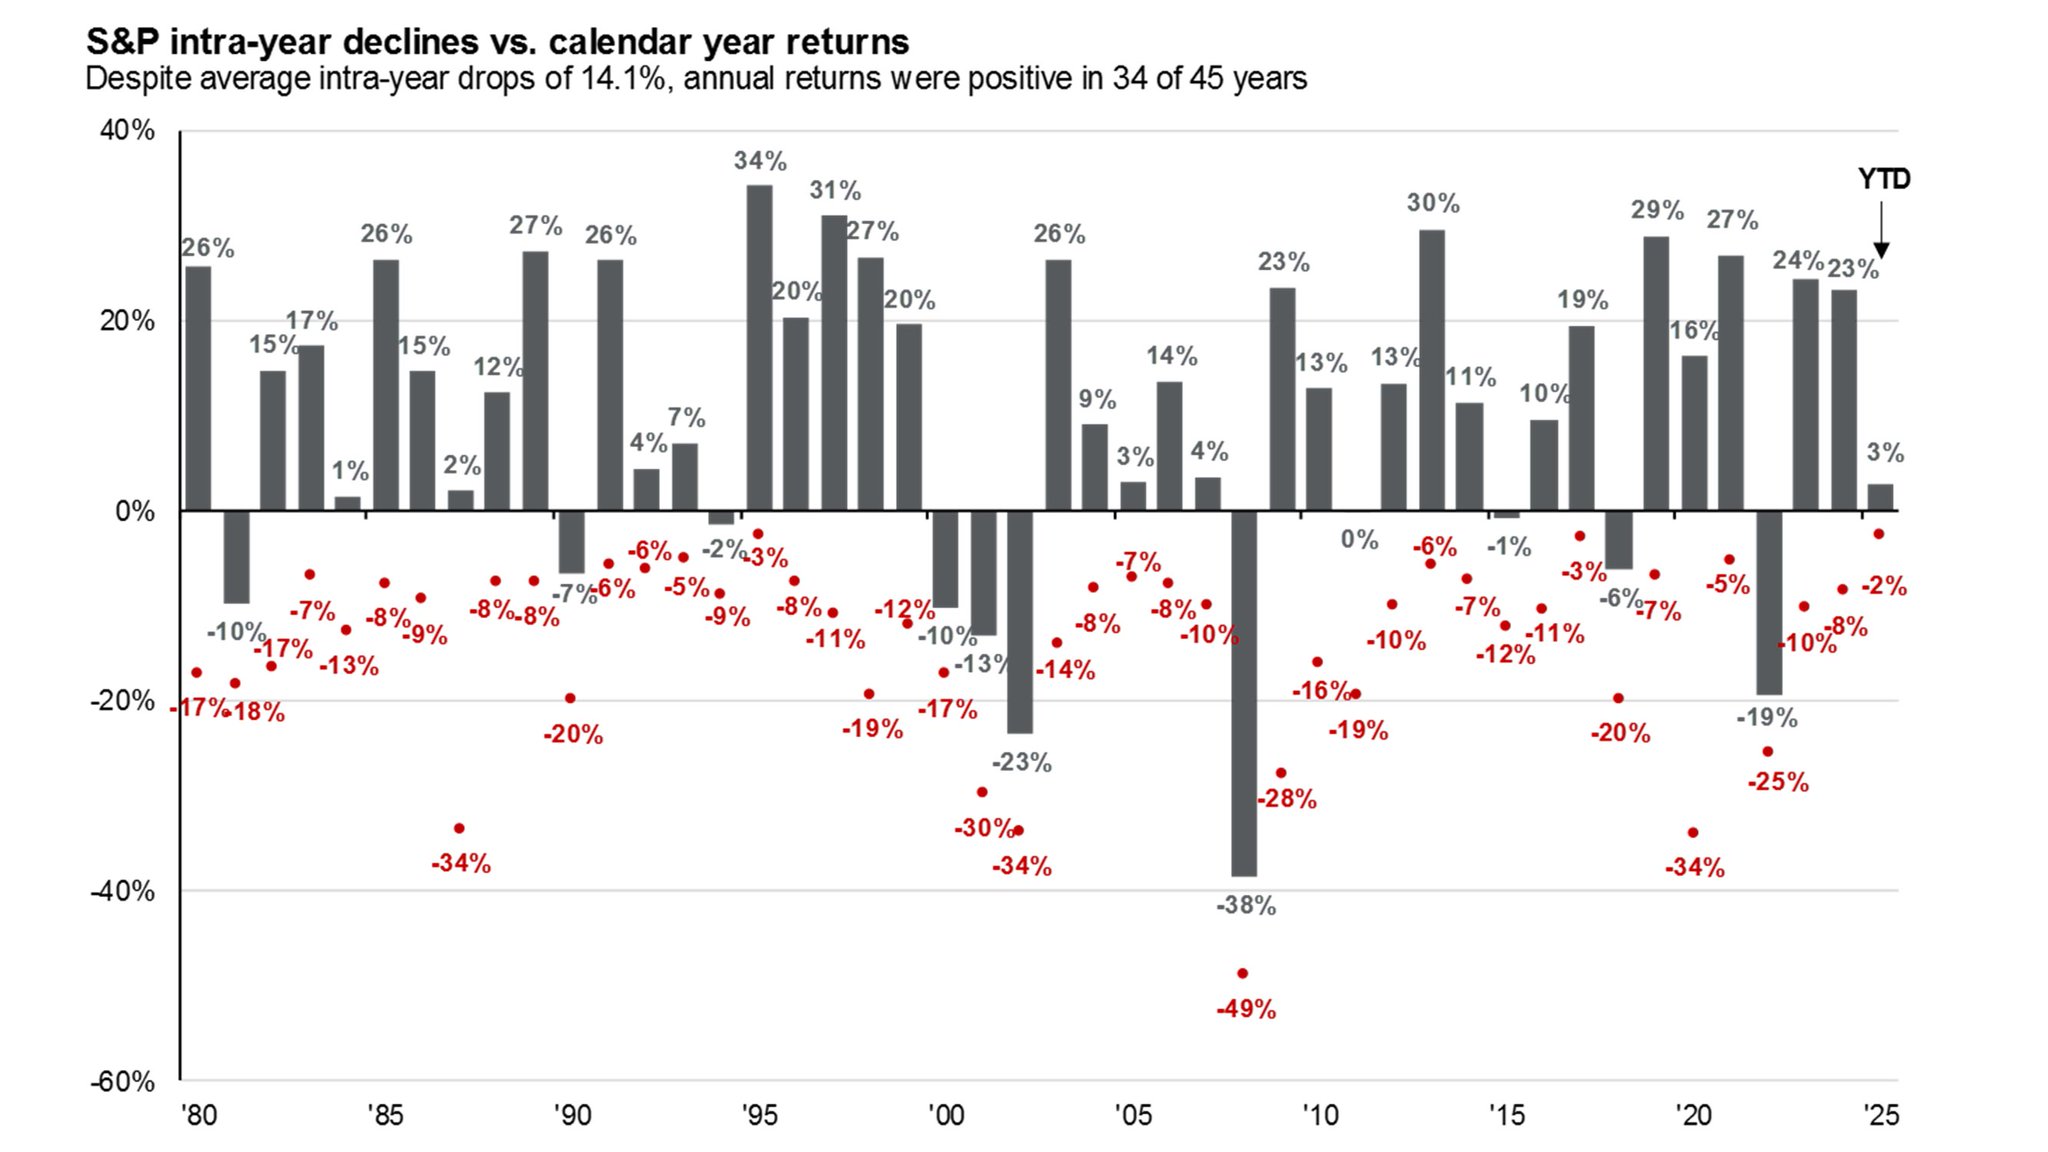
Since this bull market began just over 2 years ago, we have consistently said that every bull market tends to have between 2-3 drawdowns per annum, with each drawdown can be up to -14% on average. As can be seen below the average yearly drawdown is -14% regardless of the full year return. In other words – the price of admission for equity market returns – is volatility.
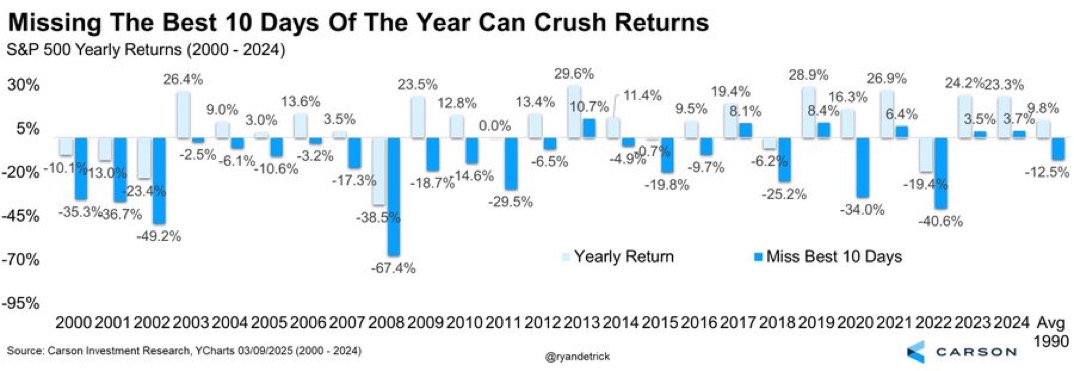
When markets are in a drawdown there is always a reason and each time the reason seems real and creates uncertainty. The current risk of Tariffs is no difference to when Silicon Valley bank collapsed in March 2023 or the Yen carry trade unwind in August 2024 or many other occasions. Trying to time these drawdowns is futile and can be quite detrimental to long term returns. For example, missing the best 10 days each year can be very costly over time.
So what should investors do from here? As always and over the last 6 years we have shown that each of these market drawdowns and corrections have proven to be a great buying opportunity. With all the volatility of the last 6 years, the Fund has proven to consistently deliver strong returns over the long term. Every time there is a correction we have always encouraged investors to take advantage of these opportunities and deploy funds into the market. Now is no different.
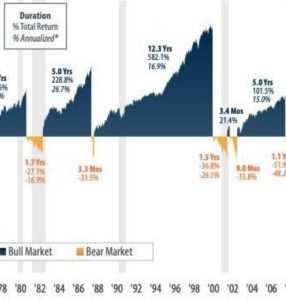
We view the current correction as a healthy pullback in what is a structurally long term mega bull market that will be driven by a healthier US economy, lower interest rates, and innovation led growth as a result of the AI technology revolution. We believe the current period is similar to the early 1990s Dotcom mega bull market that lasted for 12 years. That period was very profitable for patient investors.
Finally we provide a brief commentary on portfolio updates from reporting season during the month in the portfolio section of the report. We look forward to providing further updates in our next monthly report in April.
Sincerely yours,
Ron Shamgar and the TAMIM Team.
Fund Performance
Portfolio Highlights

Healius (ASX: HLS) is Australia’s 2nd largest pathology provider undergoing a critical transformation phase in its pathology division, with current challenges masking substantial long-term value creation opportunities. The first-half 2025 results highlight a strategic pivot aimed at improving operational efficiency and margin performance.
Currently, the pathology division struggles with compressed EBIT margins, hovering around 1%, significantly below the market benchmark of 7-10%. This is across a revenue base of close to $1.3 Billion.
The company’s 1H FY25 7% revenue growth, driven by a 5% volume increase and a 45% surge in genomic diagnostics, demonstrates underlying market strength. Strategic investments are focused on workforce optimisation, collection center productivity, and specialist revenue stream development.
Margin compression stems from deliberate investments in labor cost restructuring, collection center staffing improvements, call center technology implementation, and pathologist remuneration realignment. Despite these short-term pressures, the company sees significant upside potential.
Operational efficiency gains are equally promising. The company has already reduced collection center closures by 50% and is investing $20 million in technology, targeting productivity gains of 15-20%. The pending Imaging division sale for $965 million provides additional strategic flexibility, with net proceeds exceeding $800 million and the potential for a special dividend over $300 million with $160 million of franking credits available to distribute. The March investor day will be crucial in providing detailed insights into the transformation roadmap.
Our thesis is simple, post imaging sale which is imminent and payment of debt, the company will have $450m of net cash. The current market cap is $950m. We believe a $350m+ fully franked dividend will be paid. This implies an EV for the remaining pathology business of circa $350-$450 million.
Under the right management we believe a pathology business generating such revenue should be yielding EBIT margins of 8-10%. This implies $100m of potential earnings upside. It is not clear whether the current management is up to the task. Hence we are confident that such a strategic asset will be acquired post capital return. A renewed merger offer with Australian Clinicsl Labs (ACL) makes strategic sense with material synergies. Either way we feel there’s 40% upside to the current valuation in the near term.
Bravura Solutions (ASX: BVS) reported robust financial performance for the first half of fiscal year 2025, showcasing significant improvements in its operational and financial metrics. Group CEO Andrew Russell highlighted the company's successful execution of its "energised build and grow" strategy, demonstrating renewed focus on client solutions and operational efficiency.
Financial Highlights:
-
- Revenue: $127.5 million (0.4% increase from previous period)
- EBITDA: $23.8 million (up $15.9 million)
- Cash EBITDA: $20 million (up $20.3 million)
- Net Profit: $11.3 million (up $13 million)
- Closing Cash Balance: $151.8 million
The company announced a comprehensive capital return strategy, including:
-
- A special dividend of $40 million (8.9 cents per share)
- First-half dividend of $7.2 million (1.6 cents per share)
- Total cash distribution to shareholders of 26.8 cents per share in FY25
Bravura is concentrating on four key strategic pillars:
-
- EMEA and APAC market expansion
- Delivering client-focused technology solutions
- Positioning for growth with existing clients
- Building a high-quality technology business
The company has upgraded its full-year guidance, now forecasting:
-
- Revenue: $248 million to $252 million
- EBITDA: $46 million to $49 million
- Cash EBITDA: $38 million to $41 million
Notably, the company is seeing promising developments in its APAC digital advice proposition, which is gaining market traction and driving increased project work. Management emphasised ongoing efforts to reduce software customisation, improve engineering capabilities, and maintain a flexible cost base.
Management highlighted the company's approach to cost management, noting that most expenses can be flexibly adjusted based on project opportunities. The team is particularly focused on improving engineering efficiency, with recent efforts showing reduced code defects and more streamlined development processes.
While the company remains cautious about immediate large-scale investments in emerging technologies like AI, they are actively exploring potential integration and partnership opportunities that could benefit their clients.
Looking ahead, Bravura appears well-positioned for continued growth. The leadership team believes they are rebuilding market confidence through consistent delivery and strategic alignment with clients. The company expects to see further improvements in financial performance in FY26, driven by revenue growth opportunities and ongoing operational efficiencies.
Servcorp (ASX: SRV) delivered strong financial performance in the first half of 2025, highlighting its position as a pioneering coworking space provider with a 40-year track record of consistent growth. Key financial highlights include:
-
- Underlying operating revenue of $158.8 million, up $10.9 million or 7% on first half of FY2024
- Statutory net profit after tax of $34.6 million, up 76% on first half of FY2024
- Cash and investment balances currently in excess of $120.0 million
- Underlying EPS of 31.5 cents, up 21% from 26.0 cents in first half of FY2024
- NTA of $2.10 per share, up 19% on 30 June 2024
Management is focusing on controlled, organic growth, Exploring expansion in Middle East, Japan, Potential London opportunities, whilst avoiding markets without sufficient return on capital. The Key Competitive Advantages of SRV are:
-
- Pioneering coworking space concept
- Advanced IT systems and global client database
- Sustainable subscription-based income model
- Low-risk expansion approach
The company remains confident in its business model, with a strategy focused on sustainable growth. The Saudi division IPO has been put on hold for now. We continue to see the stock as undervalued displaying all the qualities we look for in an investment such as Founder led (50% ownership), profitable and growing, strong balance sheet ($120m net cash), paying dividends (5.5% yield) and an undemanding valuation (PE of 8.5x). The stock is now up over 100% since we first invested.

ClearView (ASX: CVW) 1H FY25 results reflect a company in transition. While a temporary spike in claims impacted the first quarter, the sharp recovery in Q2 profitability suggests this was an anomaly rather than a trend. Management has moved quickly to reprice policies, improve claims oversight, and refocus the business, ensuring that growth and earnings trajectory remain intact. Now, with an aggressive share buyback in play, strong premium growth, and a renewed focus on profitability, the stock’s risk-reward profile looks increasingly attractive.
ClearView’s net assets stand at $363 million, or 55.1 cents per share, yet the stock continues to trade at around 45-50 cents, representing a 20% discount to net asset value. The company’s embedded value per share has also increased by 9.5% to 94 cents, yet the market still applies an astonishing 45% discount to this figure.
Management is now taking action to close this valuation gap. Instead of paying a dividend, ClearView has announced a share buyback of up to 10% of issued capital, reflecting its confidence in the underlying business and the attractiveness of repurchasing shares at current depressed levels.
This move is particularly compelling given that life insurance businesses typically become more valuable in a falling interest rate environment, where their embedded value rises as discount rates decline. The real question now is whether the buyback will be fully executed or deployed opportunistically, either way, it represents a clear signal that management sees significant upside potential in the stock.
ClearView continues to strengthen its market position, with its advice in-force premium market share holding at 3.8% ($356 million) and gross premium growth increasing by 8% to $191.4 million. New business market share sits at 10.6%, with new business revenue at $16.3 million.
The first half of FY25 was defined by a short-term hit to profitability. Life Insurance Underlying NPAT dropped 22% to $15.2 million, largely due to a $6.2 million claims loss in Q1. However, the rebound in Q2 earnings confirms that claims experience has normalised.
NPAT in Q1 stood at $4.2 million, but by Q2, it had recovered to $11.0 million, restoring profitability to historical trends. While group Underlying NPAT fell 28% to $12.5 million, this was expected given the Q1 impact. Importantly, management has already taken steps to prevent a repeat of these claims losses, implementing repricing, improved claims management, and retention measures.
Looking ahead, ClearView is on track for a much stronger second half, with multiple tailwinds in place to support earnings recovery and stock re-rating. For FY25, gross premium revenue is forecast to reach $395 - $400 million, supported by stable policyholder retention and premium growth. Management expects Life Insurance NPAT margins to improve to 9-10% for the full year, with a further expansion to 10-12% in the second half.
With FY25 Group Underlying NPAT expected to come in at $32.5 million, ClearView remains undervalued at a PE ratio of 8.9x, a discount that does not accurately reflect its improving earnings trajectory.
Looking further ahead, ClearView has upgraded its FY26 gross premium target to $440 million, up from the previous $400 million forecast. The company’s new business market share target remains 12-14%, while Life Insurance NPAT margins are expected to expand to 11-13%.
At the midpoint, this translates to FY26 Life Insurance NPAT of $52.8 million and Group NPAT of $46.8 million, putting ClearView on an exceptionally attractive PE ratio of just 6.2x.
ClearView is at a critical inflection point and if FY26 targets are met, the stock could easily re-rate toward a fair value of 70-80 cents per share within the next 6-12 months.
Fund Facts
Investment Parameters
| Management Style: | Active |
| Investments: | Australian Equities |
| Investment Universe: | Australian Small Cap |
| Reference Index: | ASX Small Ords |
| Number of Securities: | 20-40 (10-20 Value, 10-20 Growth) |
| Single Security Limit: | +/-5% |
| Market Capitalisation: | Small Cap |
| Leverage: | No |
| Portfolio Turnover: | <50% p.a. |
| Cash Level (typical): | 0-100% (0-50%) |
Fund Profile
| Investment Structure: | Unlisted Unit Trust (available to wholesale investors) |
| Minimum Investment: | $100,000 |
| Management Fee: | 1.25% p.a. |
| Admin & Expense Recovery: | Up to 0.35% |
| Performance Fee: | 20% of performance in excess of hurdle |
| Hurdle: | Greater of: RBA Cash Rate + 2.50% or 4% |
| Entry/Exit Fee: | Nil |
| Buy/Sell Spread: | +0.25% / -0.25% |
| Distributions: | Semi-annual |
| Applications/Redemptions: | Monthly |
| Redemptions: | Monthly with 30 days' notice |
| Investment Horizon: | 3 - 5 years + |

Invest via TAMIM Fund
Request additional details by using the form or if you're ready to invest select the apply now button.
Invest via IMA
The TAMIM Australia Small Cap strategy is available as an Individually Managed Account (IMA). Please see the Strategy Summary for terms or request Investment Documentation via form.