Australian Equities
Australia All Cap
Below you will find this months commentary and portfolio update for TAMIM Australia All Cap unit class.
May 2024 | Investor Update
Dear Investor,
We provide this monthly report to you following conclusion of the month of May 2024.
The TAMIM All Cap Fund was up +4.05% (net of fees) during the month, versus the Small Ords up -0.05% and the ASX300 up +0.85%. CYTD the fund is up +17.04% net of fees versus the ASX300 up +3.21%.
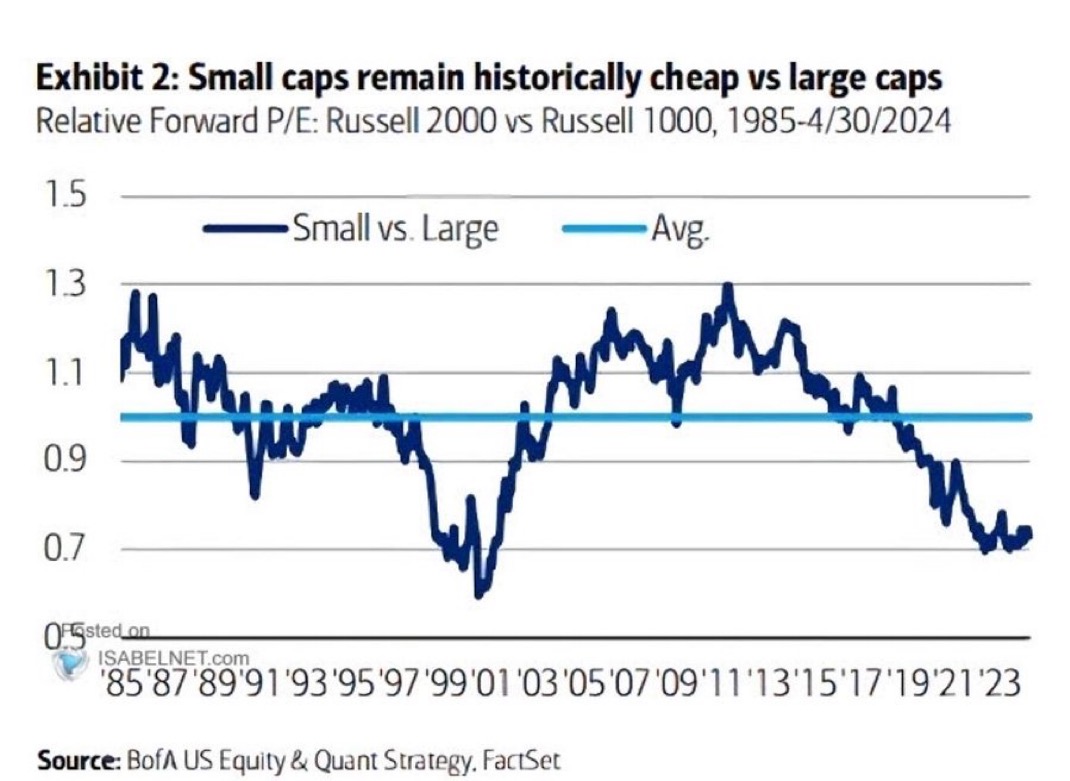
We are continuing to identify undervalued opportunities for the Fund from both emerging growth companies that are highly profitable, or unloved turnaround stories that are not yet fully appreciated by the market. We continue to see the overall small to mid cap part of the market as considerably undervalued.
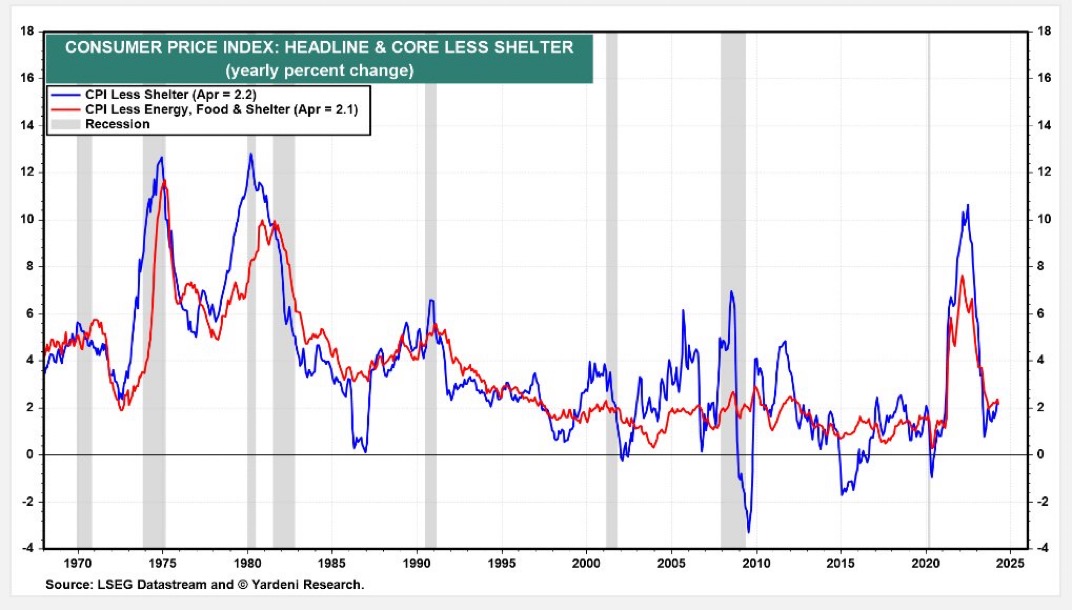
As we have flagged previously this year, we believe the latter part of the calendar year to deliver better returns to the overall market and in particular the small end as investors begin to see inflation come off (In the US for example, CPI excluding shelter is low versus the headline figure) and rate cut expectations increase. If our assessment is correct then our portfolio holdings should see a significant re rating as we saw towards the end of last year.
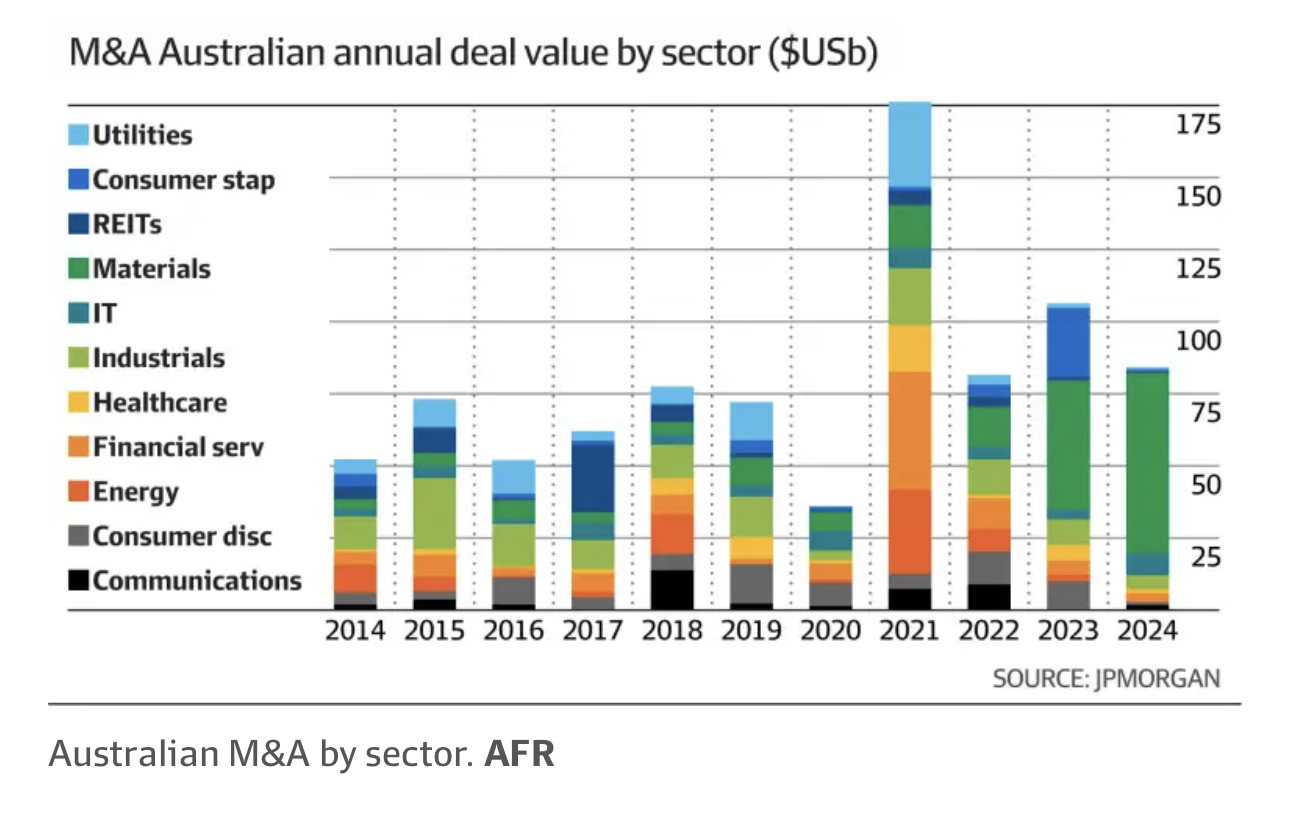
We also expect M&A activity to pickup and accelerate through the year with 2024 already seeing activity but mostly driven by the recent BHP/Anglo bid. History shows M&A activity rebounds strongly following a drop off we have seen in the last 2 years.
We provide a brief commentary on portfolio holdings results during the month in the portfolio section of the report. We look forward to providing further updates in our next monthly report in July.
Sincerely yours,
Ron Shamgar and the TAMIM Team
Fund Performance
Portfolio Highlights

Gentrack Group Limited (ASX: GTK) reported strong financial results for the first half of FY24, with revenue increasing by 21% to $102 million compared to the same period last year. The company's cash balance stood at $39.3 million as of March 31, 2024.
Excluding one-off revenues from insolvent customers in the prior period, the underlying revenue growth was an impressive 58%. The company's operating earnings stood at $12.3 million, tracking well against its full-year guidance. Gentrack's Utilities segment experienced a 17% increase in revenue to $86.5 million, with underlying revenue growth of 60% when excluding the one-off revenues from the prior year.
The company secured new customers, including in Saudi Arabia, and witnessed strong growth in its core markets of New Zealand, Australia, and the UK. Annual recurring revenue in the Utilities segment grew by 49%.
The Veovo division, which serves airports, saw a 49.4% increase in revenue to $15.5 million, driven by new customer wins in the UK and the Middle East. Non-recurring revenues more than doubled, fueled by project implementations and hardware sales. Annual recurring revenue in Veovo grew by 16%. Gentrack invested $12.9 million in a 10% stake in Amber, an Australian energy technology company, to develop innovative solutions for household batteries, EV chargers, and smart devices.
Looking ahead, Gentrack has upgraded its revenue guidance for FY24 to approximately $200 million, up from the previous guidance of at least $170 million. The company expects operating earnings to range between $23.5 million and $26.5 million (12%-13% margin), reflecting continued investment in strategic R&D and international expansion. Overall, Gentrack's results demonstrate strong growth across its Utilities and Veovo businesses, driven by new customer acquisitions, upselling, and upgrades.
We feel that Gentrack has some of the strongest tailwinds and revenue growth potential for the next 5 plus years. In our view all global utilities have to upgrade their billing systems with the Gentrack tech stack resonating well with customers. This is now the fifth upgrade to earnings this year.
The company is well-positioned to capitalise on the transformative trends in the utilities and airports industries, with a focus on innovation and international expansion. We first invested in the stock at $1.50 in 2022 and continue to see large upside to the share price.

OFX Group Limited (ASX: OFX), a leading provider of online international payment and foreign exchange services, reported strong financial results for the year ended 31 March 2024, in line with its guidance.
The company's performance was underpinned by strong execution, synergies from acquisitions, and a strategic pivot towards the lucrative B2B segments. The company's net operating income (NOI) rose 6.3% year-over-year to $227.5 million, driven by a 2.1% increase in fee and trading income to $229.7 million. Underlying operating earnings grew 3.4% to $64.6 million, and excluding the Paytron acquisition, it increased by 8.2%.
However, underlying net profit after tax (NPAT) declined 10.1% to $33.8 million, primarily due to higher operating expenses associated with the Paytron integration and core business growth.
The B2B segment emerged as a key growth driver, with revenue increasing by 4.8% to $146.1 million, fueled by a 3 basis point margin expansion and a 5.2% rise in transactions. The Enterprise segment, in particular, witnessed a remarkable 32.8% revenue growth, and the pipeline of prospects increased from 67 to 77. The Consumer segment, however, experienced a 4.4% revenue decline due to lower transaction volumes and average transaction values (ATV).
Geographically, the US market remained resilient, with transaction volumes up 19.6% and revenues up 14.2%, supported by a strong economy and favourable USD exchange rates.
The UK market also performed well, with an 18.7% revenue increase driven by a 9 basis point margin improvement and higher transactions. Additionally, European revenues skyrocketed 140.6%, with active clients increasing by 16.3%.
OFX continued its on-market share buy-back program, acquiring 8.6 million shares for approximately $14.3 million, demonstrating its commitment to enhancing shareholder value.
The company plans to launch a new integrated Corporate platform in Q1 FY25, offering accounts payable, invoicing, expense management, and Corporate card services globally, unlocking new revenue streams beyond FX services.
Looking ahead, OFX expects to grow NOI by at least 10% per annum, with an underlying operating earnings margin of 28%-30% over the next three years. The company is well-positioned to benefit from further industry consolidation, leveraging its strong balance sheet and cash generation capabilities.
For FY25, OFX is confident in achieving its goals through organic growth, margin expansion, new client revenue, contribution from new revenue streams, and additional trading days.
With implied forecast operating earnings of $70-$75 million OFX trades on a multiple of 5.5 whilst also trading on a price to earnings multiple of 13. With a bullish medium and long term outlook, net cash of $25 million and growing, we believe there is significant merger and acquisition potential.

Smartpay (ASX: SMP) reported their FY24 full year results during the month. Full Year Financial Highlights were the following:
- Normalised profit before tax of $9.8m, compared to the prior year of $7.6m
- Revenue $96.5m, a 24% increase
- Australian acquiring transactional revenue of $79.0m, a 30.6% increase
- Monthly acquiring revenue grew to $7.2m per month
- Normalised EBITDA $22.3m, a 21% increase
- Australian transacting terminal fleet grew to 18,400+ at 31 March 2024, up from 15,700
- Net cash increased to $2.2m
Prior to the result, SMP announced a significant milestone by signing their processing partner in Australia, Cuscal, to launch in NZ. This means SMP can rollout their transactional revenue model to their NZ terminal fleet of 30,000+.
Management is forecasting converting existing and new terminals in NZ from 2H FY25 at a rate of 500-800 per month with GM of 35%+. In Australia average revenue per terminal sits at $4,400 NZD pa versus $400 pa in NZ. We believe due to different interchange laws in NZ, the potential revenue per terminal on the new model will be around $3,000+ pa per terminal.
The traction in NZ and specific revenue and margin metrics as they emerge over time will determine the upside in the stock. We estimate adding or converting half the fleet will add an incremental $30m of Ebitda. If we are correct then the stock is worth double. We continue to hold as a core position.

Catapult (ASX: CAT) is a technology software company that provides performance measurement gear for athletes and video tracking and analysis software to over 3,300 professional sports team globally. The company has had a volatile history as it transitioned to a fully recurring revenue model, completed several acquisitions and seen several management changes. We mostly watched the company from the sidelines over the years as we waited for free cashflow (FCF) inflection.
During the month CAT reported FY24 results of $100m (USD) in revenues and Annualised contracted value up 20% to $82m. A significant milestone was the company for the first time generated $1m of FCF based on our analysis and measurement. Net incremental margin hit 46% and tracking to management target of 55%. This means for every additional $1 of revenue growth CAT should generate 46%+ of FCF.
The company was confident to forecast continued growth of 20% pa for the next few years which should see significant Ebitda and FCF growth. We estimate FY26 FCF generation of $24m. CAT has 17% share of the potential 20,000 professional sports team globally so we think there’s large runway for growth. We took a position in the stock prior to the results and increased our holding since then. We believe there’s another 40% upside to our estimate of FY26 fair value.
Fund Facts
Investment Parameters
| Management Style: | Active |
| Reference Index: | ASX 300 |
| Number of Securities: | 20-50 |
| Single Security Limit: | 10% (typically 5%) |
| Investable Universe: | ASX (focus on ASX300 ex20) |
| Market Capitalisation: | Any |
| Leverage: | No |
| Portfolio Turnover: | < 25% p.a. |
| Cash Level: | 0% - 100% (typically 5 - 30%) |
Fund Profile
| Investment Structure: | Unlisted Unit Trust (available to wholesale investors) |
| Minimum Investment: | $100,000 |
| Management Fee: | 1.25% p.a. |
| Admin & Expense Recovery: | Up to 0.35% |
| Performance Fee: | 20% of performance in excess of hurdle |
| Hurdle: | Greater of RBA Cash Rate + 2.5% or 4% |
| Entry/Exit Fee: | Nil |
| Buy/Sell Spread: | +0.25% / -0.25% |
| Applications: | Monthly |
| Redemptions: | Monthly with 30 days notice |
| Investment Horizon: | 3 - 5 years + |
| Distributions: | Annual |

Invest via TAMIM Fund
Request additional details by using the form or if you're ready to invest select the apply now button.
Invest via IMA
The TAMIM Australia All Cap strategy is available as an Individually Managed Account (IMA). Please see the Strategy Summary for terms or request Investment Documentation via form.

