Listed Property
Investor Updates

June 2024 | Investor Update
Dear Investor,
The TAMIM Listed Property unit class delivered a -1.01% return for the month of June 2024. For comparison the A-REIT index was -0.90% while the G-REIT index was +0.84%.
Australian Listed REIT Portfolio (AUD)
The portfolio was down -1.36% for the month. On the 25th of June, the portfolio was still trading above where it started the month. The REIT market then took a nose-dive after CPI data came in higher then expected, which hurt the monthly returns. There were only six stocks in the portfolio which were above water for the month of which our largest two holdings were part of (GMG +4.12% and NSR +5.13%).
GMG has exceeded all expected returns over the past year, by delivering a 75% Total Return since the start of July 2023. The question is, how long will it continue to deliver, or will there be a pull back at some point where investors take profits.
The A-REIT Index was down for the month, delivering -0.90%. It underperformed the Global REIT market which delivered 0.84%. The A-REIT market is sounding like a broken record where GMG is played repeatedly. It absolutely dominates the ASX 200 REIT Index (at roughly 41%), and it continues to go up in price. That in turn drives the Industrial sector.
Industrial was the best performing sector for the month, delivering a notable 3.9% with office in second place albeit that it was down -1.3% for the month. There were a few transactions in the Office sector which reset property values slightly higher.
UBS sees the overall A-REIT market as expensive as it is trading at 3% above their fair value estimate. The 2025 expected dividend yield is 3.9%. The worst performing sector for the month was Diversified which was down -3.1% and driven by negative contributions from SGP (-3.7%) and CHC (- 5.9%).
The best performing individual stock was Abacus Property Group, up 5.51% with National Storage REIT (NSR), the second largest position in the portfolio, coming in second after delivering 5.13%. A contributing factor to NSR’s performance was the announcement in the middle of the month that they are establishing the National Storage Ventures Fund JV with GIC for an initial 5-year period. NSR will hold a 25% holding in the JV which will acquire 10 assets from NSR for ~$120m and the proceeds used to reduce debt. NSR will also receive fees for development management of these assets as well as other services provided.
Inflation numbers were released on 26 June and was higher than expected. The actual reading came in at 4.0%, where the market expected 3.8%. An increase of 0.4% from the previous month’s reading of 3.6%. Inflation has now steadily been climbing since December 2023, when it was 3.4% and the whisper in some corners are that there might be a possibility of another hike to curb the steady rise since the beginning of the year (this is not our house view).
The RBA held the cash rate constant in the June meeting on 18 June, which was notedly before the inflation data released. The central bank has kept the cash rate constant since December last year and have cautioned that inflation was still above the midpoint of the 2-3% target range, attributing it to the persistently high cost of services. Further softening economic indicators included easing GDP growth, rising jobless rates and slower-than-expected wage growth.
Had it not been for the performance of Goodman, the A-REIT market would not have kept its head above the water for the first half of 2024. GMG delivered 38.04% for the first half of the year. HMC is the only other notable performer, coming in with 18.20% for the same period. HMC is however a much smaller company and a small component of the A-REIT market. It remains to be seen how the incoming data will affect the RBA’s rate decisions and whether REITs will be able to navigate an uncertain second half of the year.
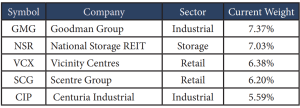
The current Australian portfolio component consists of 24 stocks. Below are the top 5 holdings:

Reitway Global Property Portfolio (USD)
The portfolio was slightly positive for the month, delivering +0.36%. This was on the back of a good month in May of +4.09% return. The GPR 250 REIT index was up +1.27% for the month. REITs were down for the first 6 months of the year by -3.29%. Investors are losing their patience with the asset class not performing due to higher interest rates driven by sticky inflation data. We believe that the market could well turn quickly once some positive inflation data start coming through, so hold on to your seats.
We saw the annual inflation rate in the US for May come down by 0.1% to 3.3%, as announced on the 12th of June. It beat the consensus estimate by 0.1% and REIT investors found it a positive reading. The metric used by the Federal Reserve in the US to gauge inflation is PCE (Personal Consumption Expenditure) and it is an indicator of the economy’s overall health. Similar to the inflation data release in June, PCE also came down by 0.1% as was expected by the market. The annual PCE inflation rate in the US now sits at 2.6%. Some interesting statistic to note on PCE is that the annual change for the US from 1960 until 2024 was 3.30%, reaching an all time high of 11.60% in 1980 and a record low of – 1.47% in 2009. The inflation rate is still above the Fed’s target over the long term of 2%.
The story continues for 2024 where most REIT indices are in a similar position to where they were in the beginning of the year. It appears every time a glimmer of hope appears on the horizon a small cloud of negative news or data arrives and covers that optimism. The Fed Funds interest rate was last changed in July 2023, after the hikes started in March 2022. Since the last increase any communications by the Federal Reserve was almost ended with the words “data dependent”. To some extent, the increases have worked, but the asset class have been under pressure at interest rates elevated from past levels.
The US carried the REIT market in June, delivering 3.18% in a month where the benchmark return was just 1.27%. All other regions were down for the month, with France (-10.39%), Spain (-7.65%) and Belgium (-7.01%) being the hardest hit. In general, Europe had a torrid month with the surprise of US inflation data and US stocks coming back into flavour.
All markets in the benchmark have been negative of the first half of the year. The worst performerwas Singapore (-16.21%) followed by Canada (-12.63%). The best of the pick for the first half was the US (-2.17%) and then the UK (-5.34%). Some of that gains in USD can be attributed to the strengthening of the Greenback compared to most other currencies of this period. Another would be the latest positive inflation data released versus others that might even be in talks of rate hikes. Overall, the US has been steady and is probably well primed to start ticking up should more positive data come out.
Self-Storage was the best performing sector for the month, especially in the US and Australia. In the UK, Self-Storage was in contrast one of the worst performing sectors in the benchmark. We did not have exposure to UK storage but were also under-exposed to US storage which had an excellent month, delivering +7.31%. The sector reacted positively on 12 June when CPI data was release that was lower than the market expected. That momentum on the positive news carried through to the 25th of June when the sector started giving back some of those gains. The outlook for storage is still fairly bleak with a slow housing market where the sub-sector is even expected to see a mini recession in 2024.
The two main sectors that pulled down the portfolio during June were Specialised and Apartments. Within Specialised the sub-sector of Towers took a hit with Cellnex in Europe being the worst stock in the portfolio (-10.53%) as well as Crown Castle in the US down for the month (-3.18%). Towers is one of our larger overweight sectors and we believe the short-term underperformance will turn around in due course based on solid fundamental drivers such as strong demand and increasing capacity requirements based on AI, population growth and technological development of various regions. In Apartments, German name Vonovia pulled down the sector by coming in with a negative -8.44%. balanced by our holding in Camden Property Trust (CPT) which delivered +7.3%.
The top performing stocks in the portfolio came from the top performing sectors, driven by more sector wide sentiment. AVB (+8.26%) is the largest apartment name in the benchmark and EQR (+6.63%) the third largest. They were in the top three performers in the portfolio for the month of June. On a relative YoY comparison, rental growth is expected to outperform in coastal markets as observed in quarter 1 of 2024 for the coming quarters. West coast markets saw stronger than seasonal top line rental growth in 1Q as well as accelerating asking rent growth. There were a few transactions in the sector where deals were done at valuations in line with or even above Greenstreet’s ascribed values, adding to the market sentiment.
Fund positioning remains roughly the same (quality, value, structural trend riders, and blend between offensive and defensive), with a slight uptick in risk appetite due to continuing optimism growing in markets awaiting rate cut announcements with the possibility of September seeing the first cut.
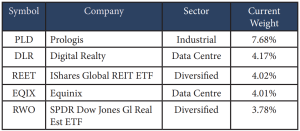
The Tamim global property portion invested in the Reitway Global Property Portfolio currently consists of 45 stocks. Below are the top 5 holdings:

Fund Facts
Investment Parameters
| Management Style: | Active |
| Investments: | Listed property & property related securities |
| Number of securities: | 40-50 |
| Single security limit: | 10% |
| Region limit: | 70% |
| Sector limit: | 70% |
| Investable universe: | Listed property & property related securities |
| Market capitalisation: | N/A |
| Derivatives: | Yes – special instances & hedging |
| Leverage: | No |
| Portfolio turnover: | Typically < 25% p.a. |
| Cash level: | 0-100% (typically 0-20%) |
Fund Profile
| Investment Structure: | Unlisted Unit Trust (available to wholesale investors) |
| Minimum Investment: | $100,000 |
| Management Fee: | 0.98% p.a. |
| Admin & Expense Recovery: | Up to 0.25% |
| Performance Fee: | Nil |
| Hurdle: | N/A |
| Entry/Exit Fee: | Nil |
| Buy/Sell Spread: | +0.25% / -0.25% |
| Applications: | Monthly |
| Redemptions: | Monthly (with 30 day notice) |
| Distribution: | Quarterly |
| Investment Horizon: | 3-5+ years |

